Monitoring the Sun Storage J4000 Array Family
|
This chapter describes the monitoring process and how to set up monitoring system wide and on individual arrays. It contains the following sections:
For more information about the concepts introduced in this chapter, see the appropriate topic in the online help.
Monitoring Overview
The Fault Management Service (FMS) is a software component of the Sun StorageTek Common Array Manager that is used to monitor and diagnose the storage systems. The primary monitoring and diagnostic functions of the software are:
- Array health monitoring
- Event and alarm generation
- Notification to configured recipients
- Device and device component reporting
An FMS agent, which runs as a background process, monitors all devices managed by the Sun StorageTek Common Array Manager.
The high-level steps of a monitoring cycle are as follows.
1. Verify that the agent is idle.
The system generates instrumentation reports by probing the device for all relevant information, and it saves this information. The system then compares the report data to previous reports and evaluates the differences to determine whether health-related events need to be generated.
Events are also created from problems reported by the array. If the array reports a problem, an alarm is generated directly. When the problem is no longer reported by the array, the alarm is removed.
2. Store instrumentation reports for future comparison.
Event logs are accessible by accessing the Events page for an array from the navigation pane in the user interface. The software updates the database with the necessary statistics. Some events require that a certain threshold be attained before an event is generated. For example, having the cyclic redundancy count (CRC) of a switch port increase by one is not sufficient to trigger an event, since a certain threshold is required.
3. Send the alarms to interested parties.
Alarms are sent only to recipients that have been set up for notification. The types of alarms can be filtered so that only pertinent alarms are sent to each individual.
Note: If they are enabled, the email providers receive notification of all alarms.
Alarms are created when a problem is encountered that requires action. When the root-cause problem of the alarm is corrected, the alarm will either be cleared automatically or you must manually clear the alarm. See the CAM Service Advisor procedures for details.
Monitoring Strategy
The following procedure is a typical strategy for monitoring.
1. Monitor the devices.
To get a broad view of the problem, the site administrator or Sun personnel can review reported information in context. This can be done by:
- Displaying the device itself
- Analyzing the device’s event log
2. Isolate the problem.
For many alarms, information regarding the probable cause and recommended action can be accessed from the alarm view. In most cases, this information enables you to isolate the source of the problem. In cases where the problem is still undetermined, diagnostic tests are necessary.
Once the problem is fixed, in most cases the management software automatically clears the alarm for the device.
The Event Life-Cycle
Most storage network events are based on health transitions. For example, a health transition occurs when the state of a device goes from online to offline. It is the transition from online to offline that generates an event, not the actual offline value. If the state alone were used to generate events, the same events would be generated repeatedly. Transitions cannot be used for monitoring log files, so log events can be repetitive. To minimize this problem, the agent uses predefined thresholds to entries in the log files.
The software includes an event maximums database that keeps track of the number of events generated about the same subject in a single eight-hour time frame. This database prevents the generation of repetitive events. For example, if the port of a switch toggles between offline and online every few minutes, the event maximums database ensures that this toggling is reported only once every eight hours instead of every five minutes.
Event generation usually follows this process:
1. The first time a device is monitored, a discovery event is generated. It is not actionable but is used to set a monitoring baseline This event describes, in detail, the components of the storage device. Every week after a device is discovered, an audit event is generated with the same content as the discovery event.
2. A log event can be generated when interesting information is found in storage log files. This information is usually associated with storage devices and sent to all users.
3. Events are generated when the software detects a change in the Field Replaceable Unit (FRU) status. The software periodically probes the device and compares the current FRU status to the previously reported FRU status, which is usually only minutes old. ProblemEvent, LogEvent, and ComponentRemovalEvent categories represent most of the events that are generated.
| Note - Aggregated events and events that require action by service personnel (known as actionable events) are also referred to as alarms. Some alarms are based on a single state change and others are a summary of events where the event determined to be the root cause is advanced to the head of the queue as an alarm. The supporting events are grouped under the alarm and are referred to as aggregated events.
|
Setting Up Notification for Fault Management
The fault management features of the Sun StorageTek Common Array Manager software enables you to monitor and diagnose your arrays and storage environment. Alarm notification can be provided by:
- Email notification
- Simple Network Management Protocol (SNMP) traps
You can also set up Sun Service notification by enabling Auto Service Request as described in Setting Up Auto Service Request.
1. In the navigation pane, under General Configuration, choose Notification.
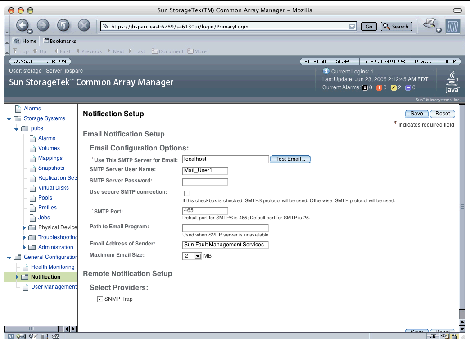
The following Notification Setup page is displayed.

TABLE 4-1 describes the fields and buttons on the Notification Setup page.
TABLE 4-1 Fields and Buttons on the Notification Setup Page
|
Field
|
Description
|
|
Email Notification Setup
|
|
Use this SMTP Server for Email
|
The address of the Simple Mail Transfer Protocol (SMTP) server that will process remote email transmission.
|
|
Test Email
|
Click to send a test email to a test email service.
|
|
SMTP Server User Name
|
The user name used with the SMTP server.
|
|
SMTP Server Password
|
The password used with the SMTP server.
|
|
Use secure SMTP connection
|
Check the box to enable the secure SMTP (SMTPS) protocol. Otherwise, the SMTP protocol will be used.
|
|
SMTP Port
|
The port used with by SMTP server.
|
|
Path to Email Program
|
The server path to the email application that is to be used when the SMTP server is unavailable.
|
|
Email Address of Sender
|
The email address to be specified as the sender for all email transmissions.
|
|
Maximum Email Size
|
The largest size allowed for a single email message.
|
|
Remote Notification Setup
|
|
Select Providers
|
Select the check box to enable the SNMP remote notification provider.
|
The Email Fault Notification Setup screen is where you specify SMTP servers and recipients of email notification.
2. Enable local email.
a. Enter the name of the SMTP server.
If the host running this software has the sendmail daemon running, you can accept the default server, localhost, or the name of this host in the required field.
b. Specify the other optional parameters, as desired.
c. If you have changed or entered any parameters, click Save.
d. (Optional) Click Test Local Email to test your local email setup by sending a test email.
If you need help on any of the fields, click the Help button.
3. (Optional) Set up remote notifications by SNMP traps to an enterprise management application.
a. Select SNMP as the provider.
b. Click Save.
4. Set up local email notification recipients.
a. Click Administration > Notification > Email.
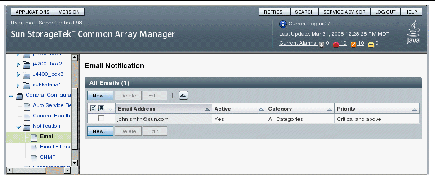
The following Email Notification page is displayed.

TABLE 4-2 describes the fields and buttons on the Email Notification page.
TABLE 4-2 Fields and Buttons on the Email Notification Page
|
Field
|
Description
|
|
New
|
Click to add an email recipient.
|
|
Delete
|
Click to delete an email recipient.
|
|
Edit
|
Click to edit an email recipient’s information.
|
|
Email Address
|
The email address of a current email recipient.
|
|
Active
|
Whether the current email recipient is configured as active and receiving email notifications.
|
|
Category
|
The types of devices for which the corresponding email recipient receives email notifications. Options include one, multiple categories, or all categories of device types.
|
|
Priority
|
The alarm types for which the corresponding email recipient receives email notifications. Options include:
- All
- Major and Above
- Critical and Above
|
b. Click New.
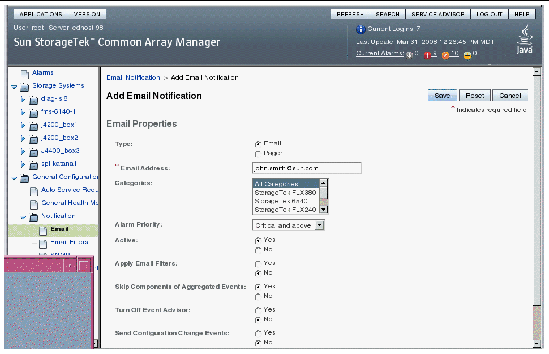
The following Add Email Notification page is displayed.

TABLE 4-3 describes the fields on the Add Email Notification page.
TABLE 4-3 Fields on the Add Email Notification Page
|
Field
|
Description
|
|
Type
|
The format of the notification: email or pager.
|
|
Email Address
|
The email address of the new email notification recipient.
|
|
Categories
|
The types of devices for which the email recipient will receive email notifications. Options include one, multiple categories, or all categories of device types.
|
|
Alarm Priority
|
The alarm types for which the email recipient will receive email notifications. Options include:
- All
- Major and Above
- Critical and Above
|
|
Active
|
Select Yes to enable email notification for the new email notification recipient.
|
|
Apply Email Filters
|
Select Yes to apply email filters to this recipient.
|
|
Skip Components of Aggregated Events
|
Select Yes if you do not want notification sent for single events that are also part of aggregated events.
|
|
Turn Off Event Advisor
|
Select Yes if you do not want Event Advisor messages included in email notifications.
|
|
Send Configuration Change Events
|
Select Yes if you want to send configuration change notices in the notifications.
|
c. Enter an email address for local notification. At least one address is required to begin monitoring events. You can customize emails to specific severity, event type, or product type.
d. Click Save.
5. (Optional) Set up email filters to prevent email notification about specific events that occur frequently. You can still view filtered events in the event log.
a. Click Administration > Notification > Email Filters.
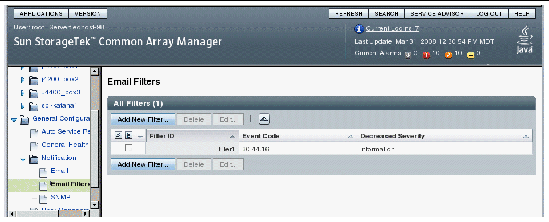
The following Email Filters page is displayed.

TABLE 4-4 describes the fields and buttons on the Email Filters page.
TABLE 4-4 Fields and Buttons on the Email Filters Page
|
Field
|
Description
|
|
Add New Filter
|
Click to add a new email filter.
|
|
Delete
|
Click to delete the selected email filter.
|
|
Edit
|
Click to edit the selected email filter.
|
|
Filter ID
|
The identification (ID) for the email filter.
|
|
Event Code
|
The event code to which this filter applies.
|
|
Decreased Severity
|
Select Information or No Event to prevent email notification for the specified event code.
|
b. Click Add New Filter.
The following Add Filter page is displayed.

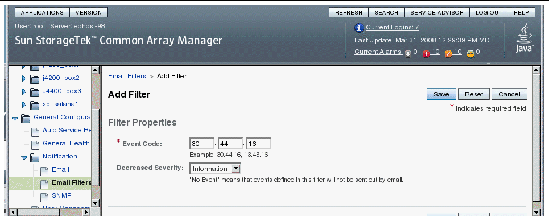
TABLE 4-5 describes the fields on the Add Filter page.
TABLE 4-5 Fields on the Add/Edit Email Filters Page
|
Field
|
Description
|
|
Event Code
|
The event code to which this filter applies.
|
|
Decreased Severity
|
The alarm types to which the filter applies. Options include:
|
c. Enter the event code that you want to filter. You can obtain event codes from the Event Details page of the event you want to filter to prevent email notification for events with that event code.
d. Click Save.
6. (Optional) Set up SNMP trap recipients.
a. Click Administration > Notification > SNMP
The following SNMP Notification page is displayed.

TABLE 4-6 describes the fields and buttons on the SNMP Notification page. See SNMP Trap MIB for more information.
TABLE 4-6 Fields and Buttons on the SNMP Notification Page
|
Field
|
Description
|
|
New
|
Click to add a Simple Network Management Protocol (SNMP) recipient.
|
|
Delete
|
Click to delete an SNMP recipient.
|
|
Edit
|
Click to edit an SNMP recipient’s information.
|
|
IP Name/Address
|
The identifying Internet Protocol (IP) address or name of the current SNMP recipient.
|
|
Port
|
Port to which (SNMP) notifications are sent.
|
|
Minimum Alert Level
|
The minimum alarm level for which SNMP notifications are sent to the corresponding SNMP recipient. Options include:
- Down
- Critical
- Major
- Notice
|
b. Click New.
The following Add SNMP Notification page is displayed.

TABLE 4-7 describes the fields on the Add SNMP Notification page.
TABLE 4-7 Fields on the Add SNMP Notification Page
|
Field
|
Description
|
|
IP Name/Address
|
The identifying Internet Protocol (IP) address or name of the new SNMP recipient.
|
|
Port
|
The port to which SNMP notifications are to be sent.
|
|
Minimum Alert Level
|
The minimum alarm level for which SNMP notifications are to be sent to the new SNMP recipient. Options include:
- Down
- Critical
- Major
- Notice
|
|
Send Configuration Change Events
|
Select Yes if you want to send configuration change notices in the SNMP notifications.
|
c. Enter the event code that you want to filter. You can obtain event codes from the Event Details page of the event you want to filter to prevent email notification for events with that event code.
d. Click Save.
7. (Optional) Set up remote notifications by SNMP traps to an enterprise management application.
a. Click Administration > Notification > SNMP
The SNMP Notification page is displayed.
b. Click New.
The Add SNMP Notification page is displayed.
c. Enter the following information
- IP address of the SNMP recipient
- The port used to send SNMP notifications.
- (Optional) From the drop down menu, select the minimum alarm level for which SNMP notifications are to be sent to the new SNMP recipient.
- (Optional) Specify whether you want to send configuration change events.
d. Click Save.
8. Perform optional fault management setup tasks:
- Confirm administration information.
- Add and activate agents.
- Specify system timeout settings.
Configuring Array Health Monitoring
To enable array health monitoring, you must configure the Fault Management Service (FMS) agent, which probes devices. Events are generated with content, such as probable cause and recommended action, to help facilitate isolation to a single field-replaceable unit (FRU).
You must also enable array health monitoring for each array you want monitored.
|
 To Configure the FMS Agent To Configure the FMS Agent
|
1. In the navigation pane, expand General Configuration.
The navigation tree is expanded.
2. Choose General Health Monitoring.
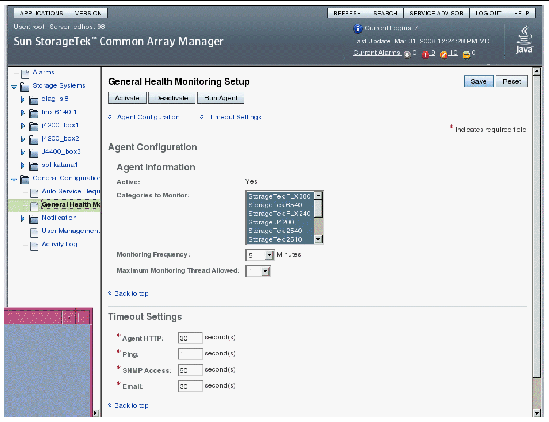
The following General Health Monitoring Setup page is displayed.

TABLE 4-8 describes the fields and buttons on the General Health Monitoring Setup page.
TABLE 4-8 Fields and Buttons on the General Health Monitoring Page
|
Field/Button
|
Description
|
|
Activate
|
Click to activate the health monitoring agent.
|
|
Deactivate
|
Click to deactivate the health monitoring agent.
|
|
Run Agent
|
Click to manually run the health monitoring agent.
|
|
Agent Information
|
|
Active
|
The status of the agent.
|
|
Categories to Monitor
|
The type of arrays to be monitored. You can select more than one type of array by using the shift key.
|
|
Monitoring Frequency
|
How often, in minutes, the agent monitors the selected array categories.
|
|
Maximum Monitoring Thread Allowed
|
The maximum number of arrays to be monitored concurrently. If the number of arrays to be monitored exceeds the number selected to be monitored concurrently, the agent will monitor the specified number of additional arrays serially.
|
|
Timeout Settings
|
|
Agent HTTP
|
The amount of time for which the agent will attempt to connect to the Internet before generating a timeout.
|
|
Ping
|
The amount of time for which the management station will attempt a ping operation before generating a timeout.
|
|
SNMP Access
|
The amount of time, in seconds, before an SNMP notification will generate a timeout.
|
|
Email
|
The amount of time, in seconds, before an email notification will generate a timeout.
|
3. Select the types of arrays that you want to monitor from the Categories to Monitor field. Use the shift key to select more than one array type.
4. Specify how often you want to monitor the arrays by selecting a value in the Monitoring Frequency field.
5. Specify the maximum number of arrays to monitor concurrently by selecting a value in the Maximum Monitoring Thread field.
6. In the Timeout Setting section, set the agent timeout settings.
The default timeout settings are appropriate for most storage area network (SAN) devices. However, network latencies, I/O loads, and other device and network characteristics may require that you customize these settings to meet your configuration requirements. Click in the value field for the parameter and enter the new value.
7. When all required changes are complete, click Save.
The configuration is saved.
|
 To Enable Health Monitoring for an Array To Enable Health Monitoring for an Array
|
1. In the navigation pane, select an array for which you want to display or edit the health monitoring status.
2. Click Array Health Monitoring
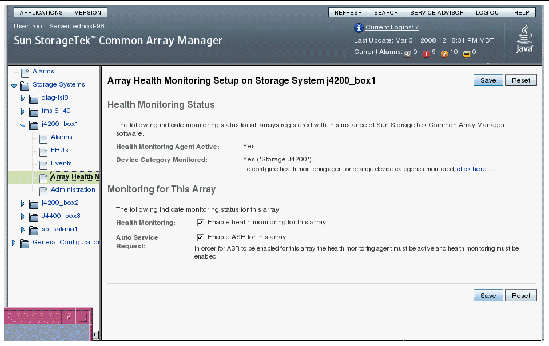
The following Array Health Monitoring Setup page is displayed.

TABLE 4-9 describes the fields on the Array Health monitoring Setup page.
TABLE 4-9 Fields on the Array Health Monitoring Setup Page
|
Field/Button
|
Description
|
|
Health Monitoring Status
|
|
Health Monitoring Agent Active
|
Identifies whether the health monitoring agent is active or inactive.
|
|
Device Category Monitored
|
Identifies whether health monitoring is enabled for this array type.
|
|
Monitoring for this Array
|
|
Health Monitoring
|
Enables or disables health monitoring for this array. Select the checkbox to enable health monitoring for the array; deselect the checkbox to disable health monitoring for this array.
|
|
Auto Service Request
|
Enables or disables the Auto Service Request monitoring service for this array. Select the checkbox to enable the Auto Service Request service for this array; deselect the checkbox to disable the Auto Service Request service for this array. Note: to enable Auto Service Request, you must also enable Health Monitoring for this array and the monitoring agent must be active.
|
3. For the array to be monitored, ensure that the monitoring agent is active and that the Device Category Monitored is set to Yes. If not, go to Configuring Array Health Monitoring
4. Select the checkbox next to Health Monitoring to enable health monitoring for this array; deselect the checkbox to disable health monitoring for the array.
5. Click Save.
Monitoring Alarms and Events
Events are generated to signify a health transition in a monitored device or device component. Events that require action are classified as alarms.
There are four event severity levels:
- Down - Identifies a device or component as not functioning and in need of immediate service
- Critical - Identifies a device or component in which a significant error condition is detected that requires immediate service
- Major - Identifies a device or component in which a major error condition is detected and service may be required
- Minor - Identifies a device or component in which a minor error condition is detected or an event of significance is detected
You can display alarms for all arrays listed or for an individual array. Events are listed for each array only.
|
 To Display Alarm Information To Display Alarm Information
|
1. To display alarms for all registered arrays, in the navigation pane, choose Alarms.
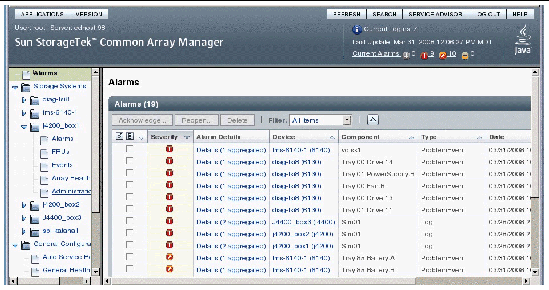
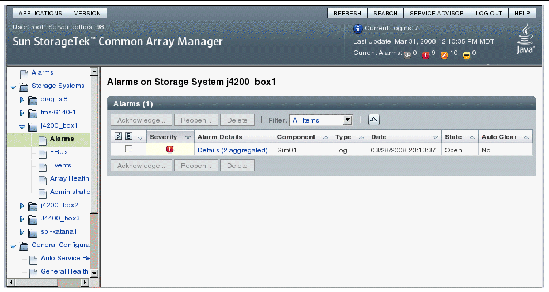
The following Alarm Summary page for all arrays is displayed.

TABLE 4-10 describes the fields and buttons on the Alarms page and the Alarms Summary page.
TABLE 4-10 Fields and Buttons on the Alarms Page and the Alarm Summary Page
|
Field
|
Description
|
|
Acknowledge
|
Click to change the state of any selected alarms from Open to Acknowledged.
|
|
Reopen
|
Click to change the state of any selected alarms from Acknowledged to Open. This button is grayed out until the alarm has been acknowledged.
|
|
Delete
|
Click to remove selected alarms. This button is grayed out for any auto-clear alarm.
|
|
Severity
|
The severity level of the event. Possible severity levels are:
- Black - Down
- Red - Critical
- Yellow - Major
- Blue - Minor
|
|
Alarm Details
|
Click to display detailed information about the alarm.
|
|
Component
|
The component to which the alarm applies.
|
|
Type
|
The general classification of the alarm.
|
|
Date
|
The date and time when the alarm was generated.
|
|
State
|
The current state of the alarm; for example, open or acknowledged.
|
|
Auto Clear
|
Whether or not this alarm will automatically be cleared when the underlying problem is resolved. Alarms which do not have the auto-clear state will need to be deleted by the user when the underlying problem is resolved.
|
2. To display alarms that apply to an individual array, in the navigation pane select the array whose alarms you want to view and choose Alarms below it.
The following Alarm Summary page for that array is displayed.

3. To view detailed information about an alarm, in the Alarm Summary page, click Details for the alarm.
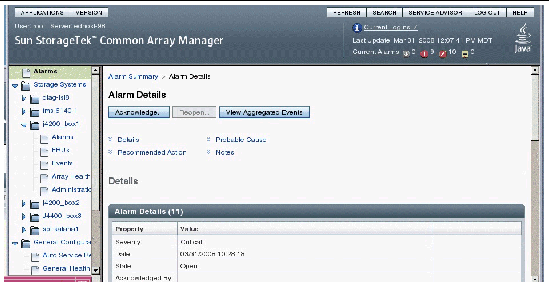
The following Alarm Details page is displayed.

TABLE 4-11 describes the fields on the Alarm Details page.
TABLE 4-11 Fields and Buttons on the Alarm Details Page
|
Field
|
Description
|
|
Acknowledge
|
Click to change the state of this alarm from Open to Acknowledged.
|
|
Reopen
|
Click to change the state of this alarm from Acknowledged to Open. This button is grayed out until the alarm has been acknowledged.
|
|
View Aggregated Events
|
Click to display all events associated with this alarm.
|
|
Details
|
|
Severity
|
The severity level of the event. The possible severity levels are:
- Down
- Critical
- Major
- Minor
|
|
Date
|
The date and time when the alarm was generated.
|
|
State
|
The current state of the alarm; for example, Open or Acknowledged.
|
|
Acknowledged by:
|
The user who acknowledged the alarm. This field displays only if an alarm has not yet been acknowledged.
|
|
Reopened by:
|
The user who reopened the alarm.This field displays only after an alarm has been acknowledged and then reopened.
|
|
Auto Clear
|
Whether or not this alarm will automatically be cleared when the underlying problem is resolved. Alarms which do not have the auto-clear state will need to be deleted by the user when the underlying problem is resolved.
|
|
Description
|
A technical explanation of the condition that caused the alarm.
|
|
Info
|
A non-technical explanation of the condition that caused the alarm.
|
|
Device
|
The device to which the alarm applies. Click the device name for detailed information about the component; for example, J007(J4200).
|
|
Component
|
The component element to which the alarm applies.
|
|
Event Code
|
The event code used to identify this alarm type.
|
|
Aggregated Count
|
The number of events aggregated for this alarm.
|
|
Probable Cause
|
|
The most likely reasons that the alarm was generated.
|
|
Recommended Action
|
|
The procedure, if any, that you can perform to attempt to correct the alarm condition. A link to the Service Advisor is displayed if replacement of a field-replaceable unit (FRU) is recommended.
|
|
Notes
|
|
Optional. You can specify text to be stored with the alarm detail to document the actions taken to address this alarm.
|
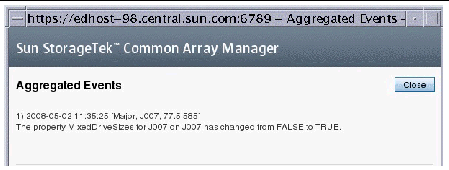
4. To view the a list of events associated with an alarm, from the Alarm Details page, click Aggregated Events.
The following Aggregated Events page is displayed.
| Note - The aggregation of events associated with an alarm can vary based on the time that an individual host probes the device. When not aggregated, the list of events, is consistent with all hosts.
|

Managing Alarms
An alarm that has the Auto Clear function set will be automatically deleted from the alarms page when the underlying fault has been addressed and corrected. To determine whether an alarm will be automatically deleted when it has been resolved, view the alarm summary page and examine the Auto Clear column. If the Auto Clear column is set to yes, then that alarm will be automatically deleted when the fault has been corrected, otherwise, the alarm will need to be manually removed after a service operation has been completed.
If the Auto Clear function is set to No, when resolved that alarm will not be automatically deleted from the Alarms page and you must manually delete that alarm from the Alarms page.
Acknowledging Alarms
When an alarm is generated, it remains open in the Alarm Summary page until you acknowledge it. Acknowledging an alarm is a way for administrators to indicate that an alarm has been seen and evaluated; it does not affect if or when an alarm will be cleared.
|
 To Acknowledge One or More Alarms To Acknowledge One or More Alarms
|
1. Display the Alarm Summary page by doing one of the following in the navigation pane:
- To see the Alarm Summary page for all arrays, choose Alarms.
- To see alarms for a particular array, expand that array and choose Alarms below it.
2. Select the check box for each alarm you want to acknowledge, and click Acknowledge.
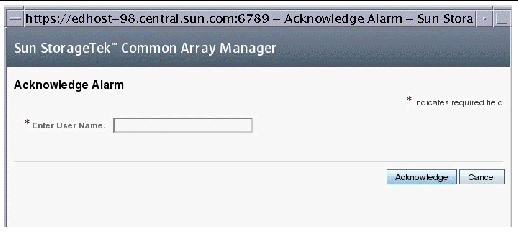
The following Acknowledge Alarms confirmation window is displayed.
.

3. Enter an identifying name to be associated with this action, and click Acknowledge.
The Alarm Summary page is redisplayed, and the state of the acknowledged alarms is displayed as Acknowledged.
Note: You can also acknowledge an alarm from the Alarm Details page. You can also reopen acknowledged alarms from the Alarm Summary and Alarm Details pages.
Deleting Alarms
When you delete an open or acknowledged alarm, it is permanently removed from the Alarm Summary page.
Note: You cannot delete alarms which are designated as Auto Clear alarms. These alarms are removed from the Alarm Summary page either when the array is removed from the list of managed arrays or when the condition related to the problem is resolved.
|
 To Delete One or More Alarms To Delete One or More Alarms
|
1. In the navigation pane, display the Alarm Summary page for all registered arrays or for one particular array:
- To see the Alarm Summary page for all arrays, choose Alarms.
- To see alarms for a particular array, select that array and choose Alarms below it.
The Alarm Summary page displays a list of alarms.
2. Select the check box for each acknowledged alarm you want to delete, and click Delete.
The Delete Alarms confirmation window is displayed.
3. Click OK.
The Alarm Summary page is redisplayed without the deleted alarms.
Displaying Event Information
To gather additional information about an alarm, you can display the event log to view the underlying events on which the alarm is based.
Note: The event log is a historical representation of events in an array. In some cases the event log may differ when viewed from multiple hosts since the agents run at different times on separate hosts. This has no impact on fault isolation.
 To Display Information About Events To Display Information About Events
|
1. In the navigation pane select the array for which you want to view the event log and choose Events.
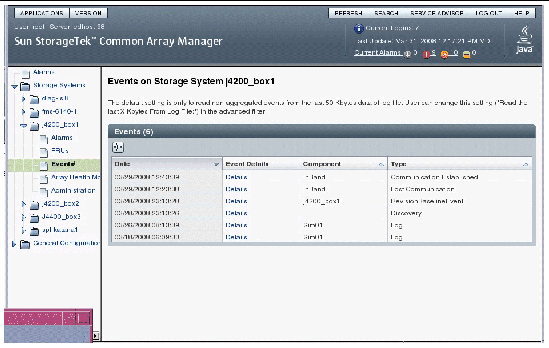
The following Events page displays.

TABLE 4-12describes the fields on the Events page.
TABLE 4-12 Events Page
|
Field
|
Description
|
|
Date
|
The date and time when the event occurred.
|
|
Event Details
|
Click Details to display detailed information for the corresponding event.
|
|
Component
|
The component to which the event applies.
|
|
Type
|
A brief identifier of the nature of the event, such as Log, State Change, or Value Change.
|
2. To see detailed information about an event, click Details in the row that corresponds to the event.
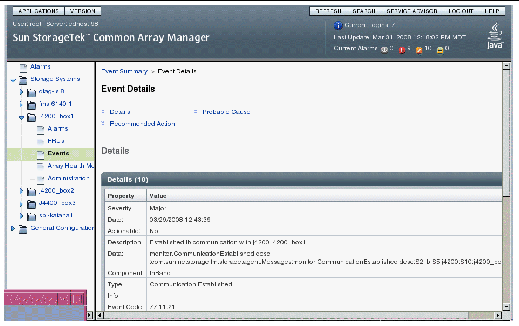
The Event Details page is displayed for the selected event.

TABLE 4-13describes the fields on the Event Details page.
TABLE 4-13 Event Details Page
|
Field
|
Description
|
|
Details
|
|
Severity
|
The severity level of the event. Possible severity levels are:
- Down
- Critical
- Major
- Minor
|
|
Date
|
The date and time when the event was generated.
|
|
Actionable
|
Whether the event requires user action.
|
|
Description
|
A technical explanation of the condition that caused the event.
|
|
Data
|
Additional event data.
|
|
Component
|
The component to which the alarm applies.
|
|
Type
|
A brief identifier of the nature of the event, such as Log, State Change, or Value Change.
|
|
Info
|
A non-technical explanation of the condition that caused the event.
|
|
Event Code
|
The event code used to identify this event type.
|
|
Aggregated
|
The number of events aggregated for this event.
|
|
Probable Cause
|
|
The most likely reasons that the event was generated.
|
|
Recommended Action
|
|
The procedure, if any, that you can perform to correct the event condition.
|
Monitoring Field-Replaceable Units (FRUs)
The Common Array Manager software enables you to view a quick listing of the FRU components in the array, and to get detailed information about the health of each type of FRU. For a listing of the FRU components in your system, go to the FRU Summary page.
| Note - All FRUs in the J4000 Array Family are also Customer Replaceable Units (CRUs).
|
For detailed information about each FRU type, refer to the hardware documentation for your array.
|
 To View the Listing of FRUs in the Array To View the Listing of FRUs in the Array
|
1. In the navigation pane, select the array whose FRUs you want to list and click FRUs.
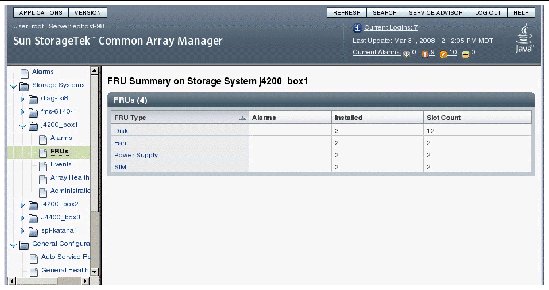
The FRU Summary page is displayed. It lists the FRU types available and provides basic information about the FRUs. The types of FRU components available depend on the model of your array.
The following figure shows the FRU Summary page for the Sun Storage J4200 array.

TABLE 4-14describes the fields on the FRU Summary page.
TABLE 4-14 Fields on the FRU Summary Page
|
Field
|
Indicates
|
|
FRU Type
|
The type of FRU installed on the array.
|
|
Alarms
|
Alarms on the FRU type.
|
|
Installed
|
The quantity of FRU components of a particular type installed on array.
|
|
Slot Count
|
The quantity of slots allocated for the particular FRU type.
|
2. To view the list of FRU components of a particular type, click on name of the FRU in the FRU Type column.
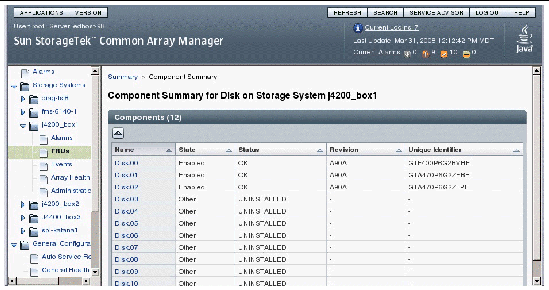
The Component Summary page displays the list of FRUs available, along with basic information about each FRU component.

TABLE 4-15 describes the fields on the Component Summary page.
TABLE 4-15 Fields on the Component Summary Page
|
Field
|
Indicates
|
|
Name
|
Name of the FRU component.
|
|
State
|
The state of the FRU component. Valid values are:
|
|
Status
|
Status of the FRU component. Valid values are:
- OK
- Degraded
- Uninstalled
- Degraded
- Disabled
- Failed
- Critical
- Unknown
|
|
Revision
|
The revision of the FRU component.
|
|
Unique Identifier
|
The unique identifier associated with this FRU component.
|
3. To view detailed health information about a particular FRU component, click on the component name.
Depending on the FRU type of the selected component, one of the following pages will display:
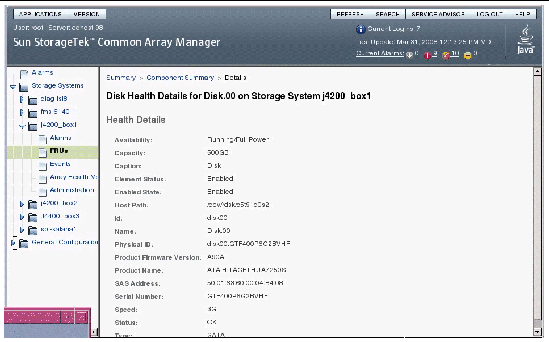
Disk Health Details Page
The disk drives are used to store data. For detailed information about the disk drives and each of its components, refer to the hardware documentation for your array.
The following figure shows the Disk Health Detail page.

TABLE 4-16 describes the fields on the Disk Health Details page.
TABLE 4-16 Fields on the Disk Health Detail Page
|
Field
|
Indicates
|
|
Availability
|
The availability of this disk drive. Valid values are:
- Running/Full Power
- Degraded
- Not Installed
- Unknown
|
|
Capacity
|
The total capacity of this disk.
|
|
Caption
|
The general name of this FRU type.
|
|
Element Status
|
The operational status of this FRU component. Valid values are:
- OK
- Degraded
- Error
- Lost Communication
|
|
Enabled State
|
Physical state of this disk drive. Valid values are:
- Enabled
- Removed
- Other
- Unknown
|
|
Host Path
|
The path where the disk drive is located.
|
|
Id
|
The unique ID assigned to this disk drive.
|
|
Name
|
The name assigned to this disk drive.
|
|
Physical ID
|
The physical ID assigned to this disk drive.
|
|
Product Firmware Version
|
The version of firmware running on this disk drive.
|
|
Product Name
|
Name of the disk drive manufacturer.
|
|
Name
|
Name assigned to this disk drive.
|
|
Product Name.
|
Model number of the array where this disk drive is installed.
|
|
SAS Address
|
SAS address assigned to this disk drive.
|
|
Serial Number
|
The serial number associated with this disk.
|
|
Speed
|
The speed at which this disk is rotating.
|
|
Status
|
Health status of this FRU component. Valid values are:
- OK
- Uninstalled
- Degraded
- Disabled
- Failed
- Critical
- Unknown
|
|
Type
|
The type of disk drive, such as SAS or SATA.
|
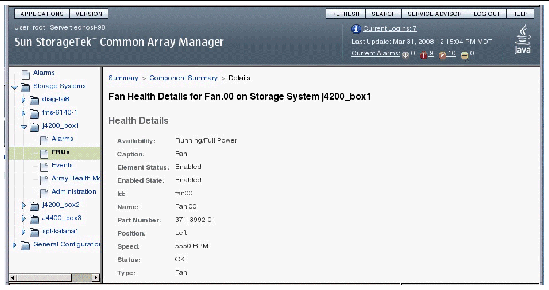
Fan Health Details Page
The fans in the Sun Storage J4000 Array Family circulate air inside the tray. Some array models, such as the J4200 array, contains two hot-swappable fans to provide redundant cooling. Other array models, such as the J4400, include fans in the power supplies. For detailed information, consult the hardware installation guide for your array.
The following figure shows the Fan Health Detail page.

TABLE 4-17 describes the fields on the Fan Health Details page.
TABLE 4-17 Fields on the Fan Health Details Page
|
Field
|
Indicates
|
|
Availability
|
The availability of this fan. Valid values are:
- Running/Full Power
- Degraded
- Not Installed
- Unknown
|
|
Caption
|
The general name of this FRU type.
|
|
Element Status
|
The operational status of this FRU component. Valid values are:
- OK
- Degraded
- Error
- Lost Communication
|
|
Enabled State
|
The physical state of this fan. Valid values are:
- Enabled
- Removed
- Other
- Unknown
|
|
ID
|
The unique ID assigned to this fan.
|
|
Name
|
Name assigned to the fan.
|
|
Part Number
|
The part number assigned to this fan.
|
|
Physical ID
|
The physical ID assigned to this fan.
|
|
Position
|
The location of this fan in the chassis when viewing the chassis from the back. Valid values are:
|
|
Serial Number
|
Serial number of the fan. The serial number is assigned by the fan manufacturer.
|
|
Speed
|
The speed, in rotations per minute (RPMs) at which the fan is operating.
|
|
Status
|
Health status of this FRU component. Valid values are:
- OK
- Uninstalled
- Degraded
- Disabled
- Failed
- Critical
- Unknown
|
|
Type
|
The type of FRU.
|
NEM Health Details Page
The NEM card is attached to the J4500 array. For detailed information about the disk drives and each of its components, refer to the hardware documentation for your array.
TABLE 4-18 describes the buttons and fields on the NEM Health Details page.
TABLE 4-18 Fields on the NEM Health Details Page
|
Field
|
Indicates
|
|
Availability
|
The availability of this component. Valid values are:
- Running/Full Power
- Degraded
- Not Installed
- Unknown
|
|
Caption
|
The general name of this FRU type.
|
|
Element Status
|
The status of this FRU component. Valid values are:
- OK
- Degraded
- Error
- Lost Communication
|
|
Enabled State
|
State of this FRU component. Valid values are:
- Enabled
- Removed
- Other
- Unknown
|
|
ID
|
The unique ID assigned to this component.
|
|
Model
|
The model name of this FRU component.
|
|
Name
|
Name assigned to the component.
|
|
Physical ID
|
The physical ID assigned to this fan.
|
|
Product Revision
|
Revision of this FRU component.
|
|
Serial Number
|
Serial number of the fan. The serial number is assigned by the fan manufacturer.
|
|
Status
|
Status of this FRU component. Valid values are:
- OK
- Uninstalled
- Degraded
- Disabled
- Failed
- Critical
- Unknown
|
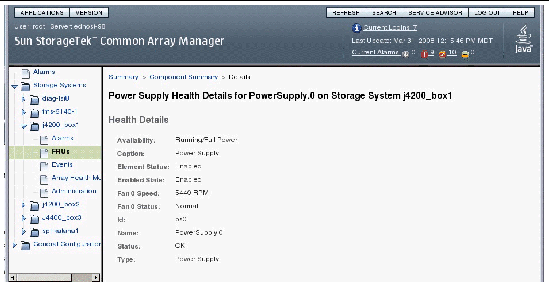
Power Supply Health Details Page
Each tray in the Sun StorageTek J4000 Array Family has hot-swappable, redundant power supplies. If one power supply is turned off or malfunctions, the other power supply maintains electrical power to the array.
The following figure shows the Power Supply Health Detail page.

TABLE 4-19 describes the fields on the Power Supply Health Details page.
TABLE 4-19 Fields on the Power Supply Health Details Page
|
Field
|
Indicates
|
|
Availability
|
The availability of this power supply. Valid values are:
- Running/Full Power
- Degraded
- Not Installed
- Unknown
|
|
Caption
|
The general name of this FRU type.
|
|
Element Status
|
The operational status of this FRU component. Valid values are:
- OK
- Degraded
- Error
- Lost Communication
|
|
Enabled State
|
The physical state of this power supply. Valid values are:
- Enabled
- Removed
- Other
- Unknown
|
|
Fan 0 Speed
|
The speed, in rotations per minute (RPMs) at which this fan is operating. If the fan operation is not within acceptable limits, an alarm is reported.
|
|
Fan1 Speed
|
The speed, in rotations per minute (RPMs) at which this fan is operating. If the fan operation is not within acceptable limits, an alarm reported.
|
|
ID
|
Unique identifier assigned to this power supply.
|
|
Fan Status
|
Status of the fan associated with this power supply. Valid values are:
|
|
Name
|
Name assigned to this power supply.
|
|
Status
|
Health status of this FRU component. Valid values are:
- OK
- Uninstalled
- Degraded
- Disabled
- Failed
- Critical
- Unknown
|
|
Type
|
Type of component.
|
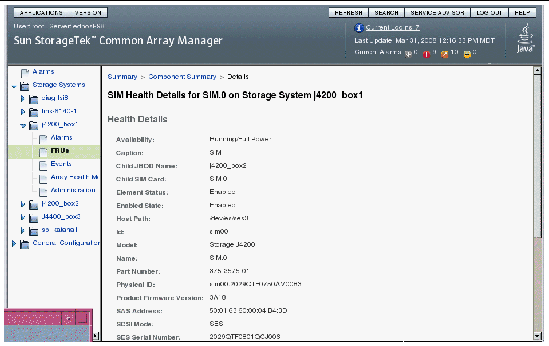
SIM Health Details Page
The SAS Interface Module (SIM) is a hot-swappable board that contains two SAS outbound connectors, one SAS inbound connector, and one serial management port. The serial management port is reserved for Sun Service personnel only.
The following figure shows the SIM Health Detail page.

TABLE 4-20 describes the fields on the SIM Health Details page.
TABLE 4-20 Fields on the SIM Health Details Page
|
Field
|
Indicates
|
|
Availability
|
The availability of this SIM. Valid values are:
- Running/Full Power
- Degraded
- Not Installed
- Unknown
|
|
Caption
|
The general name of this FRU type.
|
|
Controller Temperature 1
|
Temperature of the controller at location 1. If the temperature at this location is not within acceptable limits, an alarm is reported.
|
|
Controller Temperature 2
|
Temperature of the controller at location 2. If the temperature at this location is not within acceptable limits, an alarm is reported.
|
|
Controller Temperature 3
|
Temperature of the controller at location 3. If the temperature at this location is not within acceptable limits, an alarm is reported.
|
|
Element Status
|
The operational status of this FRU component. Valid values are:
- Enabled
- OK
- Degraded
- Error
- Lost Communication
|
|
Enabled State
|
The physical state of this FRU component. Valid values are:
- Enabled
- Removed
- Other
- Unknown
|
|
Host Path
|
/dev/es/ses#
|
|
ID
|
Unique ID assigned to this controller.
|
|
Model
|
The model number of the array.
|
|
Name
|
The name assigned to this controller.
|
|
Part Number
|
The part number assigned to this controller.
|
|
Physical ID
|
The physical ID associated with this controller.
|
|
Product Firmware Version
|
The version of the firmware loaded on the controller.
|
|
SAS Address
|
SAS address assigned to this controller.
|
|
SCSI Mode
|
The SCSI mode assigned to this controller.
|
|
SES Serial Number
|
Serial number assigned to SIM’s enclosure.
|
|
SES Temperature 1
|
Temperature within the SES enclosure at location 1. If the temperature at this location is not within acceptable limits, an alarm is reported.
|
|
SES Temperature 2
|
Temperature within the SES enclosure at location 2. If the temperature at this location is not within acceptable limits, an alarm is reported.
|
|
Serial number
|
Serial number assigned to the SIM.
|
|
Status
|
Health status of this FRU component. Valid values are:
- OK
- Uninstalled
- Degraded
- Disabled
- Failed
- Critical
- Unknown
|
|
Voltage (1.2V)
|
The actual voltage of this 1.2 volt circuit. If the voltage is not within acceptable limits, an alarm is reported.
|
|
Voltage (12V)
|
The actual voltage of this 12 volt circuit. If the voltage is not within acceptable limits, an alarm is reported.
|
|
Voltage (3.3V)
|
The actual voltage of this 3.3 volt circuit. If the voltage is not within acceptable limits, an alarm is reported.
|
|
Voltage (5V)
|
The actual voltage of this 5 volt circuit. If the voltage is not within acceptable limits, an alarm is reported.
|
Storage Module Health Details Page
The storage module is available as part of the Sun Storage B6000 array. For information about the system controller, refer to the hardware documentation for your array.
TABLE 4-21 describes the buttons and fields on the Storage Module Health Details page.
TABLE 4-21 Fields and Buttons on the Storage Module Health Details Page
|
Field
|
Indicates
|
|
Availability
|
The availability of this storage module. Valid values are:
- Running/Full Power
- Degraded
- Not Installed
- Unknown
|
|
Caption
|
The general name of this FRU type.
|
|
Element Status
|
The status of this FRU component. Valid values are:
- OK
- Degraded
- Error
- Lost Communication
|
|
Enabled State
|
State of this FRU component. Valid values are:
- Enabled
- Removed
- Other
- Unknown
|
|
Expander 0 Host Path
|
The path the operating system uses to access this expander.
|
|
Expander 0 Name
|
The location of this expander.
|
|
Expander 0 Product Revision
|
Revision of the firmware on this expander.
|
|
Expander 0 Serial Number
|
The serial number assigned to this expander.
|
|
Expander 0 Status
|
The operating status of this expander. Valid values are OK or Failed.
|
|
Expander 1 Host Path
|
The path the operating system uses to access this expander.
|
|
Expander 1 Name
|
The location of this expander.
|
|
Expander 1 Product Revision
|
Revision of the firmware on this expander.
|
|
Expander 1 Serial Number
|
The serial number assigned to this expander.
|
|
Expander 1 Status
|
The operating status of this expander. Valid values are OK or Failed.
|
|
ID
|
Unique ID assigned to this storage module.
|
|
Name
|
The name assigned to this storage module.
|
|
Part Number
|
The part number assigned to this storage module.
|
|
Physical ID
|
The physical ID associated with this storage module.
|
|
Product Name
|
The model number of the array
|
|
Product Firmware Version
|
The version of the firmware loaded on the storage module.
|
|
Serial number
|
Serial number assigned to the storage module.
|
|
Status
|
Status of this FRU component. Valid values are:
- OK
- Uninstalled
- Degraded
- Disabled
- Failed
- Critical
- Unknown
|
|
Temp Sensor Ambient Temp
|
One of two temperature sensors on the storage module. If the temperature at this location is not within acceptable limits, an alarm is reported.
|
|
Temp Sensor Exp Junct Temp
|
One of two temperature sensors on the storage module. If the temperature at this location is not within acceptable limits, an alarm is reported.
|
|
Voltage Sensor 12 V In
|
The actual voltage of this 12 volt circuit. If the voltage is not within acceptable limits, an alarm is reported.
|
|
Voltage Sensor 3.3V
|
The actual voltage of this 3.3 volt circuit. If the voltage is not within acceptable limits, an alarm is reported.
|
|
Voltage Sensor 5V In
|
The actual voltage of this 5 volt circuit. If the voltage is not within acceptable limits, an alarm is reported.
|
System Controller Health Details Page
The system controller is available as part of the Sun Storage J4500 array. The system controller is a hot-swappable board that contains four LSI SAS x36 expanders. These expanders provide a redundant set of independent SAS fabrics (two expanders per fabric), enabling two paths to the array’s disk drives. The serial management is reserved for Sun Service personnel only.
For more information about the system controller, refer to the hardware documentation for your array.
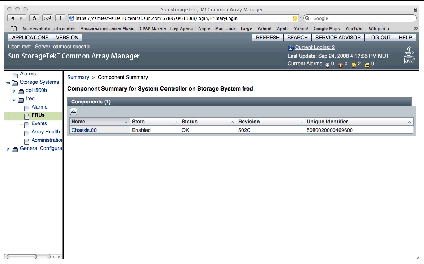
The following figure shows the Component Summary for the System Controller page.

TABLE 4-22 describes the buttons and fields on the System Controller Health Details page.
TABLE 4-22 Fields and Buttons on the System Controller Health Details Page
|
Field
|
Indicates
|
|
Availability
|
The availability of this system controller. Valid values are:
- Running/Full Power
- Degraded
- Not Installed
- Unknown
|
|
Caption
|
The general name of this FRU type.
|
|
Element Status
|
The status of this FRU component. Valid values are:
- OK
- Degraded
- Error
- Lost Communication
|
|
Enabled State
|
State of this FRU component. Valid values are:
- Enabled
- Removed
- Other
- Unknown
|
|
Expander 0 Host Path
|
The path the operating system uses to access this expander.
|
|
Expander 0 Name
|
The location of this expander.
|
|
Expander 0 Product Revision
|
Revision of the firmware on this expander.
|
|
Expander 0 Serial Number
|
The serial number assigned to this expander.
|
|
Expander 0 Status
|
The operating status of this expander. Valid values are OK or Failed.
|
|
Expander 1 Host Path
|
The path the operating system uses to access this expander.
|
|
Expander 1 Name
|
The location of this expander.
|
|
Expander 1 Product Revision
|
Revision of the firmware on this expander.
|
|
Expander 1 Serial Number
|
The serial number assigned to this expander.
|
|
Expander 1 Status
|
The operating status of this expander. Valid values are OK or Failed.
|
|
Expander 2 Host Path
|
The path the operating system uses to access this expander.
|
|
Expander 2 Name
|
The location of this expander.
|
|
Expander 2 Product Revision
|
Revision of the firmware on this expander.
|
|
Expander 2 Serial Number
|
The serial number assigned to this expander.
|
|
Expander 2 Status
|
The operating status of this expander. Valid values are OK or Failed.
|
|
Expander 3 Host Path
|
The path the operating system uses to access this expander.
|
|
Expander 3 Name
|
The location of this expander.
|
|
Expander 3 Product Revision
|
Revision of the firmware on this expander.
|
|
Expander 3 Serial Number
|
The serial number assigned to this expander.
|
|
Expander 3 Status
|
The operating status of this expander. Valid values are OK or Failed.
|
|
ID
|
Unique ID assigned to this controller.
|
|
Name
|
The name assigned to this controller.
|
|
Part Number
|
The part number assigned to this controller.
|
|
Physical ID
|
The physical ID associated with this controller.
|
|
Product Name
|
The model number of the array
|
|
Product Firmware Version
|
The version of the firmware loaded on the controller.
|
|
Serial number
|
Serial number assigned to the system controller.
|
|
Status
|
Status of this FRU component. Valid values are:
- OK
- Uninstalled
- Degraded
- Disabled
- Failed
- Critical
- Unknown
|
|
Temp Sensor Ambient Temp
|
One of two temperature sensors on the system controller board. If the temperature at this location is not within acceptable limits, an alarm is reported.
|
|
Temp Sensor LM75 Temp Sensor
|
One of two temperature sensors on the system controller board. If the temperature at this location is not within acceptable limits, an alarm is reported.
|
|
Voltage Sensor 12 V In
|
The actual voltage of this 12 volt circuit. If the voltage is not within acceptable limits, an alarm is reported.
|
|
Voltage Sensor 3.3V Main
|
The actual voltage of this main 3.3 volt circuit. If the voltage is not within acceptable limits, an alarm is reported.
|
|
Voltage Sensor 3.3V Stby
|
The actual voltage of this standby 3.3 volt circuit. If the voltage is not within acceptable limits, an alarm is reported.
|
|
Voltage Sensor 5V In
|
The actual voltage of this 5 volt circuit. If the voltage is not within acceptable limits, an alarm is reported.
|
|
Voltage Sensor AIN0
|
The actual voltage of this 5 volt circuit. If the voltage is not within acceptable limits, an alarm is reported.
|
|
Voltage Sensor VCCP
|
The actual voltage of this VCCP circuit. If the voltage is not within acceptable limits, an alarm is reported.
|
Viewing Activity on All Arrays
The activity log lists user-initiated actions performed for all registered arrays, in chronological order. These actions may have been initiated through either the Sun StorageTek Common Array Manager or the command-line interface (CLI).
|
 To View the Activity Log To View the Activity Log
|
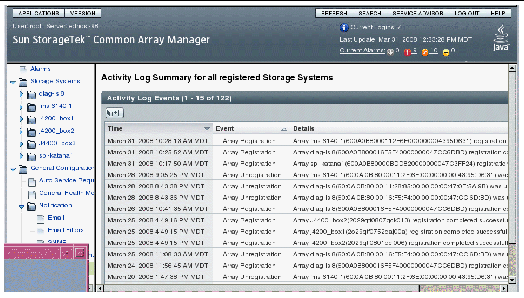
1. In the navigation pane, click General Configuration > Activity Log.
The Activity Log Summary page is displayed.

TABLE 4-23 describes the fields on the Activity Log Summary page.
TABLE 4-23 Fields on the Activity Log Page
|
Field
|
Description
|
|
Time
|
The date and time when an operation occurred on the array.
|
|
Event
|
The type of operation that occurred, including the creation, deletion, or modification of an object type.
|
|
Details
|
Details about the operation performed, including the specific object affected and whether the operation was successful.
|
Monitoring Storage Utilization
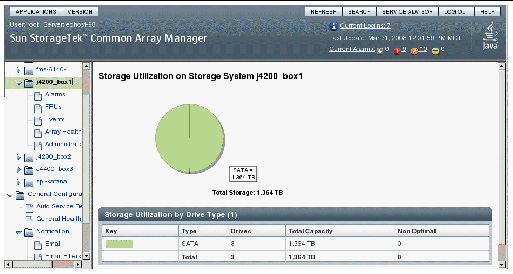
Common Array Manager graphically provides a summary of the total storage capacity of an array and the number of disk drives that provide that storage.

TABLE 4-24 describes the buttons and fields on the Storage Utilization page.
TABLE 4-24 Fields on the Storage Utilization Page
|
Field
|
Description
|
|
Key
|
A color-coded key that corresponds to the type of disk drive represented in the pie chart.
|
|
Type
|
The type of disk drive: FC, SATA or SAS.
|
|
Drives
|
The number of disk drives of the specified type.
|
|
Total Capacity
|
The sum of the capacities of all discovered disks, including spares and disks whose status is not optimal
|
|
Non Optimal
|
The number of disk drives that are in any of the following states:
- Unknown
- Failed
- Replaced
- Bypassed
- Unresponsive
- Removed
- Predictive Failure
|
| Sun StorageTek Common Array Manager User Guide for the J4000 Array Family
|
820-3765-11
|
   
|
Copyright © 2008 Sun Microsystems, Inc. All Rights Reserved.
