|
| |
| Sun Java System Message Queue 3 2005Q1 Administration Guide | |
Chapter 11
Analyzing and Tuning a Message ServiceThis chapter covers a number of topics about how to analyze and tune a Message Queue service to optimize the performance of your messaging applications. It includes the following topics:
About PerformanceThis section provides some background information on performance tuning.
The Performance Tuning Process
The performance you get out of a messaging application depends on the interaction between the application and the Message Queue service. Hence, maximizing performance requires the combined efforts of both the application developer and the administrator.
The process of optimizing performance begins with application design and continues through to tuning the message service after the application has been deployed. The performance tuning process includes the following stages:
- Defining performance requirements for the application
- Designing the application taking into account factors that affect performance (especially trade-offs between reliability and performance)
- Establishing baseline performance measures
- Tuning or reconfiguring the message service to optimize performance.
The process outlined above is often iterative. During deployment of the application, a Message Queue administrator evaluates the suitability of the message server for the application’s general performance requirements. If the benchmark testing meets these requirements, the administrator can tune the system as described in this chapter. However, if benchmark testing does not meet performance requirements, a redesign of the application might be necessary or the deployment architecture might need to be modified.
Aspects of Performance
In general, performance is a measure of the speed and efficiency with which a message service delivers messages from producer to consumer. However, there are several different aspects of performance that might be important to you, depending on your needs.
Connection Load The number of message producers, or message consumers, or the number of concurrent connections a system can support.
Message throughput The number of messages or message bytes that can be pumped through a messaging system per second.
Latency The time it takes a particular message to be delivered from message producer to message consumer.
Stability The overall availability of the message service or how gracefully it degrades in cases of heavy load or failure.
Efficiency The efficiency of message delivery; a measure of message throughput in relation to the computing resources employed.
These different aspects of performance are generally inter-related. If message throughput is high, that means messages are less likely to be backlogged in the message server, and as a result, latency should be low (a single message can be delivered very quickly). However, latency can depend on many factors: the speed of communication links, message server processing speed, and client processing speed, to name a few.
In any case, there are several different aspects of performance. Which of them are most important to you generally depends on the requirements of a particular application.
Benchmarks
Benchmarking is the process of creating a test suite for your messaging application and of measuring message throughput or other aspects of performance for this test suite.
For example, you could create a test suite by which some number of producing clients, using some number of connections, sessions, and message producers, send persistent or non-persistent messages of a standard size to some number of queues or topics (all depending on your messaging application design) at some specified rate. Similarly, the test suite includes some number of consuming clients, using some number of connections, sessions, and message consumers (of a particular type) that consume the messages in the test suite’s physical destinations using a particular acknowledgment mode.
Using your standard test suite you can measure the time it takes between production and consumption of messages or the average message throughput rate, and you can monitor the system to observe connection thread usage, message storage data, message flow data, and other relevant metrics. You can then ramp up the rate of message production, or the number of message producers, or other variables, until performance is negatively impacted. The maximum throughput you can achieve is a benchmark for your message service configuration.
Using this benchmark, you can modify some of the characteristics of your test suite. By carefully controlling all the factors that might have an impact on performance (see Application Design Factors that Affect Performance), you can note how changing some of these factors affects the benchmark. For example, you can increase the number of connections or the size of messages five-fold or ten-fold, and note the impact on performance.
Conversely, you can keep application-based factors constant and change your broker configuration in some controlled way (for example, change connection properties, thread pool properties, JVM memory limits, limit behaviors, built-in versus plugged-in persistence, and so forth) and note how these changes affect performance.
This benchmarking of your application provides information that can be valuable when you want to increase the performance of a deployed application by tuning your message service. A benchmark allows the effect of a change or a set of changes to be more accurately predicted.
As a general rule, benchmarks should be run in a controlled test environment and for a long enough period of time for your message service to stabilize. (Performance is negatively impacted at startup by the Just-In-Time compilation that turns Java code into machine code.)
Baseline Use Patterns
Once a messaging application is deployed and running, it is important to establish baseline use patterns. You want to know when peak demand occurs and you want to be able to quantify that demand. For example, demand normally fluctuates by number of end-users, activity levels, time of day, or all of these.
To establish base-line use patterns you need to monitor your message server over an extended period of time, looking at data such as the following:
You can also use average and peak values provided in metrics data.
It is important to check these baseline metrics against design expectations. By doing so, you are checking that client code is behaving properly: for example, that connections are not being left open or that consumed messages are not being left unacknowledged. These coding errors consume message server resources and could significantly affect performance.
The base-line use patterns help you determine how to tune your system for optimal performance. For example:
- If one physical destination is used significantly more than others, you might want to set higher message memory limits on that physical destination than on others, or to adjust limit behaviors accordingly.
- If the number of connections needed is significantly greater than allowed by the maximum thread pool size, you might want to increase the thread pool size or adopt a shared thread model.
- If peak message flows are substantially greater than average flows, that might influence the limit behaviors you employ when memory runs low.
In general, the more you know about use patterns, the better you are able to tune your system to those patterns and to plan for future needs.
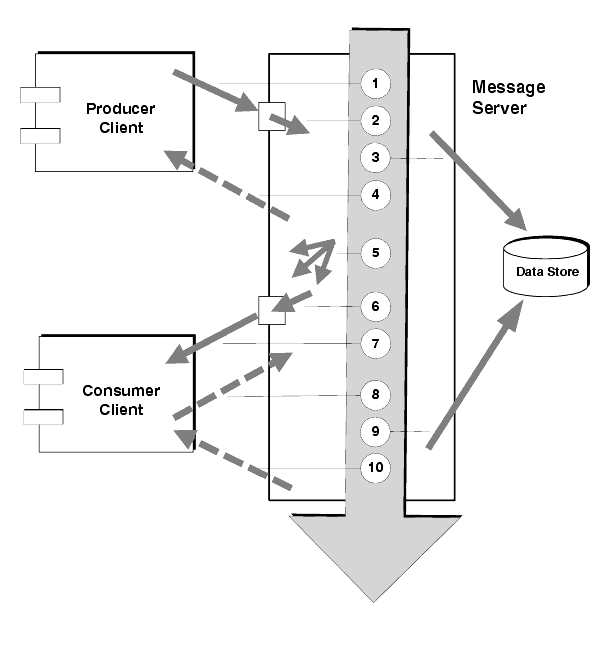
Factors That Affect PerformanceMessage latency and message throughput, two of the main performance indicators, generally depend on the time it takes a typical message to complete various steps in the message delivery process. These steps are shown below for the case of a persistent, reliably delivered message. The steps are described following the illustration.
Figure 11-1 Message Delivery Through a Message Queue Service
- The message is delivered from producing client to message server
- The message server reads in the message
- The message is placed in persistent storage (for reliability)
- The message server confirms receipt of the message (for reliability)
- The message server determines the routing for the message
- The message server writes out the message
- The message is delivered from message server to consuming client
- The consuming client acknowledges receipt of the message (for reliability)
- The message server processes client acknowledgment (for reliability)
- The message server confirms that client acknowledgment has been processed
Since these steps are sequential, any step can be a potential bottleneck in the delivery of messages from producing clients to consuming clients. Most of these steps depend upon physical characteristics of the messaging system: network bandwidth, computer processing speeds, message server architecture, and so forth. Some, however, also depend on characteristics of the messaging application and the level of reliability it requires.
The following subsections discuss the impact of both application design factors and messaging system factors on performance. While application design and messaging system factors closely interact in the delivery of messages, each category is considered separately.
Application Design Factors that Affect Performance
Application design decisions can have a significant effect on overall messaging performance.
The most important factors affecting performance are those that impact the reliability of message delivery. Among these are the following factors:
Other application design factors impacting performance are the following:
The sections that follow describe the impact of each of these factors on messaging performance. As a general rule, there is a trade-off between performance and reliability: factors that increase reliability tend to decrease performance.
Table 11-1 shows how the various application design factors generally affect messaging performance. The table shows two scenarios—a high reliability, low performance scenario and a high performance, low reliability scenario—and the choice of application design factors that characterizes each. Between these extremes, there are many choices and trade-offs that affect both reliability and performance.
Note
In the graphs that follow, performance data were generated on a two-CPU, 1002 Mhz, Solaris 8 system, using file-based persistence. The performance test first warmed up the Message Queue broker, allowing the Just-In-Time compiler to optimize the system and the persistent database to be primed.
Once the broker was warmed up, a single producer and single consumer were created and messages were produced for 30 seconds. The time required for the consumer to receive all produced messages was recorded, and a throughput rate (messages per second) was calculated. This scenario was repeated for different combinations of the application design factors shown in Table 11-1.
Delivery Mode (Persistent/Non-persistent Messages)
Persistent messages guarantee message delivery in case of message server failure. The broker stores the message in a persistent store until all intended consumers acknowledge they have consumed the message.
Broker processing of persistent messages is slower than for non-persistent messages for the following reasons:
- A broker must reliably store a persistent message so that it will not be lost should the broker fail.
- The broker must confirm receipt of each persistent message it receives. Delivery to the broker is guaranteed once the method producing the message returns without an exception.
- Depending on the client acknowledgment mode, the broker might need to confirm a consuming client’s acknowledgment of a persistent message.
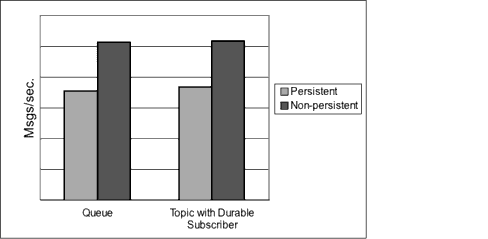
The differences in performance between the persistent and non-persistent modes can be significant. Figure 11-2 compares throughput for persistent and non-persistent messages in two reliable delivery cases: 10k-sized messages delivered both to a queue and to a topic with durable subscriptions. Both cases use the AUTO_ACKNOWLEDGE acknowledgment mode.
Figure 11-2 Performance Impact of Delivery Modes
Use of Transactions
A transaction is a guarantee that all messages produced in a transacted session and all messages consumed in a transacted session will be either processed or not processed (rolled back) as a unit.
Message Queue supports both local and distributed transactions.
A message produced or acknowledged in a transacted session is slower than in a non-transacted session for the following reasons:
- Additional information must be stored with each produced message.
- In some situations, messages in a transaction are stored when normally they would not be (for example, a persistent message delivered to a topic destination with no subscriptions would normally be deleted, however, at the time the transaction is begun, information about subscriptions is not available).
- Information on the consumption and acknowledgment of messages within a transaction must be stored and processed when the transaction is committed.
Acknowledgment Mode
One mechanism for ensuring the reliability of JMS message delivery is for a client to acknowledge consumption of messages delivered to it by the Message Queue message server.
If a session is closed without the client acknowledging the message or if the message server fails before the acknowledgment is processed, the broker redelivers that message, setting a JMSRedelivered flag.
For a non-transacted session, the client can choose one of three acknowledgment modes, each of which has its own performance characteristics:
- AUTO_ACKNOWLEDGE. The system automatically acknowledges a message once the consumer has processed it. This mode guarantees at most one redelivered message after a provider failure.
- CLIENT_ACKNOWLEDGE. The application controls the point at which messages are acknowledged. All messages processed in that session since the previous acknowledgment are acknowledged. If the message server fails while processing a set of acknowledgments, one or more messages in that group might be redelivered.
- DUPS_OK_ACKNOWLEDGE. This mode instructs the system to acknowledge messages in a lazy manner. Multiple messages can be redelivered after a provider failure.
(Using CLIENT_ACKNOWLEDGE mode is similar to using transactions, except there is no guarantee that all acknowledgments will be processed together if a provider fails during processing.)
Acknowledgment mode affects performance for the following reasons:
- Extra control messages between broker and client are required in AUTO_ACKNOWLEDGE and CLIENT_ACKNOWLEDGE modes. The additional control messages add additional processing overhead and can interfere with JMS payload messages, causing processing delays.
- In AUTO_ACKNOWLEDGE and CLIENT_ACKNOWLEDGE modes, the client must wait until the broker confirms that it has processed the client’s acknowledgment before the client can consume additional messages. (This broker confirmation guarantees that the broker will not inadvertently redeliver these messages.)
- The Message Queue persistent store must be updated with the acknowledgment information for all persistent messages received by consumers, thereby decreasing performance.
Durable and Non-durable Subscriptions
Subscribers to a topic destination fall into two categories, those with durable and non-durable subscriptions.
Durable subscriptions provide increased reliability but slower throughput, for the following reasons:
- The Message Queue message server must persistently store the list of messages assigned to each durable subscription so that should a message server fail, the list is available after recovery.
- Persistent messages for durable subscriptions are stored persistently, so that should a message server fail, the messages can still be delivered after recovery, when the corresponding consumer becomes active. By contrast, persistent messages for non-durable subscriptions are not stored persistently (should a message server fail, the corresponding consumer connection is lost and the message would never be delivered).
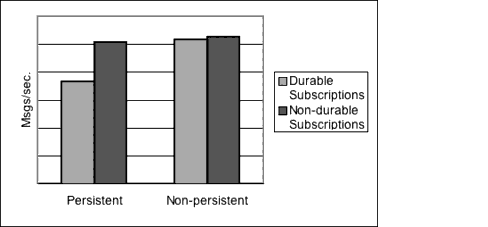
Figure 11-3 compares throughput for topic destinations with durable and non-durable subscriptions in two cases: persistent and non-persistent 10k-sized messages. Both cases use AUTO_ACKNOWLEDGE acknowledgment mode.
You can see from Figure 11-3 that the performance impact of using durable subscriptions is manifest only in the case of persistent messages; and the impact in that case is because persistent messages are only stored persistently for durable subscriptions, as explained above.
Figure 11-3 Performance Impact of Subscription Types
Use of Selectors (Message Filtering)
Application developers often want to target sets of messages to particular consumers. They can do so either by targeting each set of messages to a unique physical destination or by using a single physical destination and registering one or more selectors for each consumer.
A selector is a string requesting that only messages with property values that match the string are delivered to a particular consumer. For example, the selector NumberOfOrders >1 delivers only the messages with a NumberOfOrders property value of 2 or more.
Registering consumers with selectors lowers performance (as compared to using multiple physical destinations) because additional processing is required to handle each message. When a selector is used, it must be parsed so that it can be matched against future messages. Additionally, the message properties of each message must be retrieved and compared against the selector as each message is routed. However, using selectors provides more flexibility in a messaging application.
Message Size
Message size affects performance because more data must be passed from producing client to broker and from broker to consuming client, and because for persistent messages a larger message must be stored.
However, by batching smaller messages into a single message, the routing and processing of individual messages can be minimized, providing an overall performance gain. In this case, information about the state of individual messages is lost.
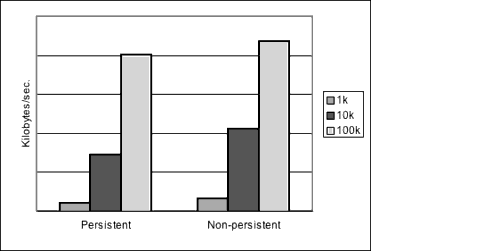
Figure 11-4 compares throughput in kilobytes per second for 1k, 10k, and 100k-sized messages in two cases: persistent and non-persistent messages. All cases send messages are to a queue destination and use AUTO_ACKNOWLEDGE acknowledgment mode.
Figure 11-4 shows that in both cases there is less overhead in delivering larger messages compared to smaller messages. You can also see that the almost 50% performance gain of non-persistent messages over persistent messages shown for 1k and 10k-sized messages is not maintained for 100k-sized messages, probably because network bandwidth has become the bottleneck in message throughput for that case.
Figure 11-4 Performance Effect of a Message Size
Message Body Type
JMS supports five message body types, shown below roughly in the order of complexity:
While, in general, the message type is dictated by the needs of an application, the more complicated types (MapMessage and ObjectMessage) carry a performance cost—the expense of serializing and deserializing the data. The performance cost depends on how simple or how complicated the data is.
Message Service Factors that Affect Performance
The performance of a messaging application is affected not only by application design, but also by the message service performing the routing and delivery of messages.
The following sections discuss various message service factors that can affect performance. Understanding the impact of these factors is key to sizing a message service and diagnosing and resolving performance bottlenecks that might arise in a deployed application.
The most important factors affecting performance in a Message Queue service are the following:
The sections below describe the impact of each of these factors on messaging performance.
Hardware
For both the Message Queue message server and client applications, CPU processing speed and available memory are primary determinants of message service performance. Many software limitations can be eliminated by increasing processing power, while adding memory can increase both processing speed and capacity. However, it is generally expensive to overcome bottlenecks simply by upgrading your hardware.
Operating System
Because of the efficiencies of different operating systems, performance can vary, even assuming the same hardware platform. For example, the thread model employed by the operating system can have an important impact on the number of concurrent connections a message server can support. In general, all hardware being equal, Solaris is generally faster than Linux, which is generally faster than Windows.
Java Virtual Machine (JVM)
The message server is a Java process that runs in and is supported by the host JVM. As a result, JVM processing is an important determinant of how fast and efficiently a message server can route and deliver messages.
In particular, the JVM’s management of memory resources can be critical. Sufficient memory has to be allocated to the JVM to accommodate increasing memory loads. In addition, the JVM periodically reclaims unused memory, and this memory reclamation can delay message processing. The larger the JVM memory heap, the longer the potential delay that might be experienced during memory reclamation.
Connections
The number and speed of connections between client and broker can affect the number of messages that a message server can handle as well as the speed of message delivery.
Message Server Connection Limits
All access to the message server is by way of connections. Any limit on the number of concurrent connections can affect the number of producing or consuming clients that can concurrently use the message server.
The number of connections to a message server is generally limited by the number of threads available. Message Queue uses a Thread Pool Manager, which you can configure to support either a dedicated thread model or a shared thread model (see Thread Pool Manager).
The dedicated thread model is very fast because each connection has dedicated threads, however the number of connections is limited by the number of threads available (one input thread and one output thread for each connection). The shared thread model places no limit on the number of connections, however there is significant overhead and throughput delays in sharing threads among a number of connections, especially when those connections are busy.
Transport Protocols
Message Queue software allows clients to communicate with the message server using various low-level transport protocols. Message Queue supports the connection services (and corresponding protocols) described in Connection Services.
The choice of protocols is based on application requirements (encrypted, accessible through a firewall), but the choice impacts overall performance.
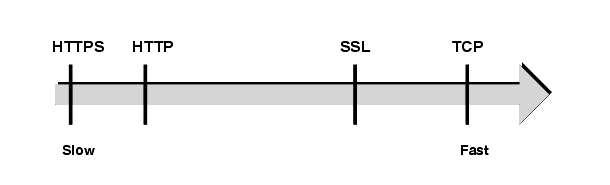
Figure 11-5 Transport Protocol Speeds
Figure 11-5 reflects the performance characteristics of the various protocol technologies:
- TCP provides the fastest method to communicate with the broker.
- SSL is 50 to 70 percent slower than TCP when it comes to sending and receiving messages (50 percent for persistent messages, closer to 70 percent for non-persistent messages). Additionally, establishing the initial connection is slower with SSL (it might take several seconds) because the client and broker (or Web Server in the case of HTTPS) need to establish a private key to be used when encrypting the data for transmission. The performance drop is caused by the additional processing required to encrypt and decrypt each low-level TCP packet.
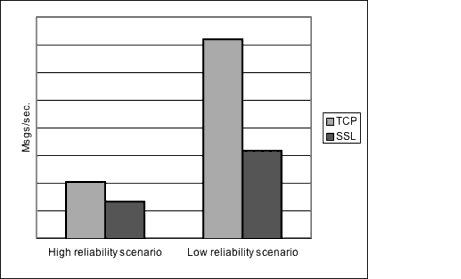
Figure 11-6 compares throughput for TCP and SSL for two cases: a high reliability scenario (1k persistent messages sent to topic destinations with durable subscriptions and using AUTO_ACKNOWLEDGE acknowledgment mode) and a high performance scenario (1k non-persistent messages sent to topic destinations without durable subscriptions and using DUPS_OK_ACKNOWLEDGE acknowledgment mode).
Figure 11-6 shows that protocol has less impact in the high reliability case. This is probably because the persistence overhead required in the high reliability case is a more important factor in limiting throughput than the protocol speed.
Figure 11-6 Performance Impact of Transport Protocol
- HTTP is slower than either the TCP or SSL. It uses a servlet that runs on a Web server as a proxy between the client and the broker. Performance overhead is involved in encapsulating packets in HTTP requests and in the requirement that messages go through two hops--client to servlet, servlet to broker--to reach the broker.
- HTTPS is slower than HTTP because of the additional overhead required to encrypt the packet between client and servlet and between servlet and broker.
Message Server Architecture
A Message Queue message server can be implemented as a single broker or as multiple interconnected broker instances—a broker cluster.
As the number of clients connected to a broker increases, and as the number of messages being delivered increases, a broker will eventually exceed resource limitations such as file descriptor, thread, and memory limits. One way to accommodate increasing loads is to add more broker instances to a Message Queue message server, distributing client connections and message routing and delivery across multiple brokers.
In general, this scaling works best if clients are evenly distributed across the cluster, especially message producing clients. Because of the overhead involved in delivering messages between the brokers in a cluster, clusters with limited numbers of connections or limited message delivery rates, might exhibit lower performance than a single broker.
You might also use a broker cluster to optimize network bandwidth. For example, you might want to use slower, long distance network links between a set of remote brokers within a cluster, while using higher speed links for connecting clients to their respective broker instances.
For more information on clusters, see Chapter 9, "Working With Broker Clusters."
Broker Limits and Behaviors
The message throughput that a message server might be required to handle is a function of the use patterns of the messaging applications the message server supports. However, the message server is limited in resources: memory, CPU cycles, and so forth. As a result, it would be possible for a message server to become overwhelmed to the point where it becomes unresponsive or unstable.
The Message Queue message server has mechanisms built in for managing memory resources and preventing the broker from running out of memory. These mechanisms include configurable limits on the number of messages or message bytes that can be held by a broker or its individual physical destinations, and a set of behaviors that can be instituted when physical destination limits are reached.
With careful monitoring and tuning, these configurable mechanisms can be used to balance the inflow and outflow of messages so that system overload cannot occur. While these mechanisms consume overhead and can limit message throughput, they nevertheless maintain operational integrity.
Data Store Performance
Message Queue supports both built-in and plugged-in persistence. Built-in persistence is a file-based data store. Plugged-in persistence uses a Java Database Connectivity (JDBC™) interface and requires a JDBC-compliant data store.
The built-in persistence is significantly faster than plugged-in persistence; however, a JDBC-compliant database system might provide the redundancy, security, and administrative features needed for an application.
In the case of built-in persistence, you can maximize reliability by specifying that persistence operations synchronize the in-memory state with the data store. This helps eliminate data loss due to system crashes, but at the expense of performance.
Client Runtime Configuration
The Message Queue client runtime provides client applications with an interface to the Message Queue message service. It supports all the operations needed for clients to send messages to physical destinations and to receive messages from such destinations. The client runtime is configurable (by setting connection factory attribute values), allowing you to set properties and behaviors that can generally improve performance and message throughput.
For example, the Message Queue client runtime supports the following configurable behaviors:
- Connection flow metering (imqConnectionFlowCount), which helps you prevent congestion due to the flow of both JMS messages and Message Queue control messages across the same connection.
- Connection flow limits (imqConnectionFlowLimit), which helps you avoid client resource limitations by limiting the number of messages that can be delivered over a connection to the client runtime, waiting to be consumed.
- Consumer flow limits (imqConsumerFlowLimit), which helps improve load balancing among consumers in multi-consumer queue delivery situations (so no one consumer can be sent a disproportionate number of messages) and which helps prevent any one consumer on a connection from overwhelming other consumers on the connection. This property limits the number of messages per consumer that can be delivered over a connection to the client runtime, waiting to be consumed. This property can also be configured as a queue destination property (consumerFlowLimit).
For more information on these behaviors and the attributes used to configure them, see Client Runtime Message Flow Adjustments.
Adjusting Configuration To Improve PerformanceSystem Adjustments
The following sections describe adjustments you can make to the operating system, JVM, and communication protocols.
Solaris Tuning: CPU Utilization, Paging/Swapping/Disk I/O
See your system documentation for tuning your operating system.
Java Virtual Machine Adjustments
By default, the broker uses a JVM heap size of 192MB. This is often too small for significant message loads and should be increased.
When the broker gets close to exhausting the JVM heap space used by Java objects, it uses various techniques such as flow control and message swapping to free memory. Under extreme circumstances it even closes client connections in order to free the memory and reduce the message inflow. Hence it is desirable to set the maximum JVM heap space high enough to avoid such circumstances.
However, if the maximum Java heap space is set too high, in relation to system physical memory, the broker can continue to grow the Java heap space until the entire system runs out of memory. This can result in diminished performance, unpredictable broker crashes, and/or affect the behavior of other applications and services running on the system. In general, you need to allow enough physical memory for the operating system and other applications to run on the machine.
In general it is a good idea to evaluate the normal and peak system memory footprints, and configure the Java heap size so that it is large enough to provide good performance, but not so large as to risk system memory problems.
To change the minimum and maximum heap size for the broker, use the -vmargs command line option when starting the broker. For example:
/usr/bin/imqbrokerd -vmargs "-Xms256m -Xmx1024m"
This command will set the starting Java heap size to 256MB and the maximum Java heap size to 1GB.
- On Solaris or Linux, if starting the broker via /etc/rc* (that is, /etc/init.d/imq), specify broker command-line arguments in the file /etc/imq/imqbrokerd.conf (Solaris) or /etc/opt/sun/mq/imqbrokerd.conf (Linux). See the comments in that file for more information.
- On Windows, if starting the broker as a Window's service, specify JVM arguments using the -vmargs option to the imqsvcadmin install command. See imqsvcadmin in Chapter 13, "Command Reference."
In any case, verify settings by checking the broker's log file or using the
imqcmd metrics bkr -m cxn command.Tuning Transport Protocols
Once a protocol that meets application needs has been chosen, additional tuning (based on the selected protocol) might improve performance.
A protocol's performance can be modified using the following three broker properties:
For TCP and SSL protocols, these properties affect the speed of message delivery between client and broker. For HTTP and HTTPS protocols, these properties affect the speed of message delivery between the Message Queue tunnel servlet (running on a Web server) and the broker. For HTTP/HTTPS protocols there are additional properties that can affect performance (see HTTP/HTTPS Tuning).
The protocol tuning properties are described in the following sections.
nodelay
The nodelay property affects Nagle's algorithm (the value of the TCP_NODELAY socket-level option on TCP/IP) for the given protocol. Nagle's algorithm is used to improve TCP performance on systems using slow connections such as wide-area networks (WANs).
When the algorithm is used, TCP tries to prevent several small chunks of data from being sent to the remote system (by bundling the data in larger packets). If the data written to the socket does not fill the required buffer size, the protocol delays sending the packet until either the buffer is filled or a specific delay time has elapsed. Once the buffer is full or the time-out has occurred, the packet is sent.
For most messaging applications, performance is best if there is no delay in the sending of packets (Nagle’s algorithm is not enabled). This is because most interactions between client and broker are request/response interactions: the client sends a packet of data to the broker and waits for a response. For example, typical interactions include:
For these interactions, most packets are smaller than the buffer size. This means that if Nagle's algorithm is used, the broker delays several milliseconds before sending a response to the consumer.
However, Nagle's algorithm may improve performance in situations where connections are slow and broker responses are not required. This would be the case where a client sends a non-persistent message or where a client acknowledgment is not confirmed by the broker (DUPS_OK_ACKNOWLEDGE session).
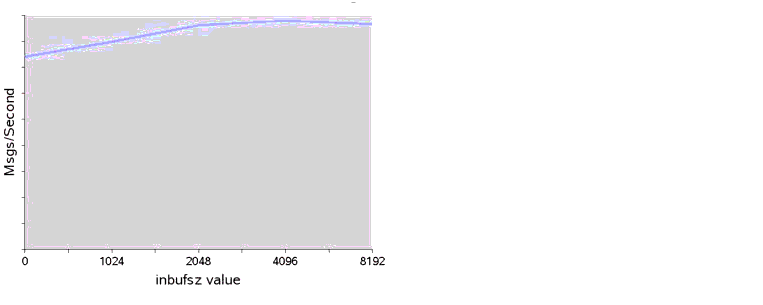
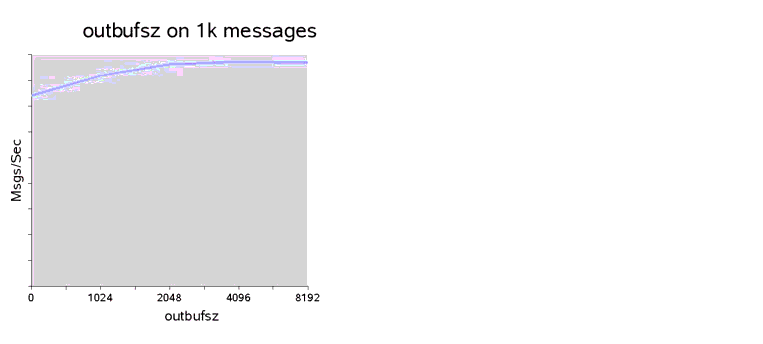
inbufsz/outbufsz
The inbufsz property sets the size of the buffer on the input stream reading data coming in from a socket. Similarly, outbufsz sets the buffer size of the output stream used by the broker to write data to the socket.
In general, both parameters should be set to values that are slightly larger than the average packet being received or sent. A good rule of thumb is to set these property values to the size of the average packet plus 1k (rounded to the nearest k).
For example, if the broker is receiving packets with a body size of 1k, the overall size of the packet (message body + header + properties) is about 1200 bytes. An inbufsz of 2k (2048 bytes) gives reasonable performance.
Increasing the inbufsz or outbufsz greater than that size may improve performance slightly; however, it increases the memory needed for each connection.
Figure 11-7 shows the consequence of changing inbufsz on a 1k packet.
Figure 11-7 Effect of Changing inbufsz on a 1k (1024 bytes) Packet
Figure 11-8 shows the consequence of changing outbufsz on a 1k packet.
Figure 11-8 Effect of Changing outbufsz on a 1k (1024 bytes) Packet
HTTP/HTTPS Tuning
In addition to the general properties discussed in the previous two sections, HTTP/HTTPS performance is limited by how fast a client can make HTTP requests to the Web server hosting the Message Queue tunnel servlet.
A Web server might need to be optimized to handle multiple requests on a single socket. With JDK version 1.4 and later, HTTP connections to a Web server are kept alive (the socket to the Web server remains open) to minimize resources used by the Web server when it processes multiple HTTP requests. If the performance of a client application using JDK version 1.4 is slower than the same application running with an earlier JDK release, you might need to tune the Web server keep-alive configuration parameters to improve performance.
In addition to such Web-server tuning, you can also adjust how often a client polls the Web server. HTTP is a request-based protocol. This means that clients using an HTTP-based protocol periodically need to check the Web server to see if messages are waiting. The imq.httpjms.http.pullPeriod broker property (and the corresponding imq.httpsjms.https.pullPeriod property) specifies how often the Message Queue client runtime polls the Web server.
If the pullPeriod value is -1 (the default value), the client runtime polls the server as soon as the previous request returns, maximizing the performance of the individual client. As a result, each client connection monopolizes a request thread in the Web server, possibly straining Web server resources.
If the pullPeriod value is a positive number, the client runtime periodically sends requests to the Web server to see if there is pending data. In this case, the client does not monopolize a request thread in the Web server. Hence, if large numbers of clients are using the Web server, you might conserve Web server resources by setting the pullPeriod to a positive value.
Tuning the File-based Persistent Store
For information on tuning the file-based persistent store, see Persistence Manager.
Broker Adjustments
The following sections describe adjustments you can make to broker properties to improve performance.
Memory Management: Increasing Broker Stability Under Load
Memory management can be configured on a destination-by-destination level or on a system-wide level (for all destinations, collectively).
Using Physical Destination Limits
For information on physical destination limits, see Chapter 6, "Managing Physical Destinations."
Using System-wide Limits
If message producers tend to overrun message consumers, messages can accumulate in the broker. The broker contains a mechanism for throttling back producers and swapping messages out of active memory in low memory conditions, but it is wise to set a hard limit on the total number of messages (and message bytes) that the broker can hold.
Control these limits by setting the imq.system.max_count and the imq.system.max_size broker properties.
For example
imq.system.max_count=5000
The defined value above means that the broker will only hold up to 5000 undelivered/unacknowledged messages. If additional messages are sent, they are rejected by the broker. If a message is persistent then the producer will get an exception when it tries to send the message. If the message is non-persistent, the broker silently drops the message.
To have non-persistent messages return an exception like persistent messages, set the following property on the connection factory object used by the client:
imqAckOnProduce = true
The setting above may decrease the performance of sending non-persistent messages to the broker (the client waits for a reply before sending the next message), but often this is acceptable since message inflow to the broker is typically not a system bottleneck.
When an exception is returned in sending a message, the client should pause for a moment and retry the send again.
Multiple Consumer Queue Performance
The efficiency with which multiple queue consumers process messages in a queue destination depends on the following configurable queue destination attributes:
To achieve optimal message throughput there must be a sufficient number of active consumers to keep up with the rate of message production for the queue, and the messages in the queue must be routed and then delivered to the active consumers in such a way as to maximize their rate of consumption. The general mechanism for balancing message delivery among multiple consumers is described in the Sun Java System Message Queue Technical Overview.
If messages are accumulating in the queue, it is possible that there is an insufficient number of active consumers to handle the message load. It is also possible that messages are being delivered to the consumers in batch sizes that cause messages to be backing up on the consumers. For example, if the batch size (consumerFlowLimit) is too large, one consumer might receive all the messages in a queue while other active consumers receive none. If consumers are very fast, this might not be a problem.
However, if consumers are relatively slow, you want messages to be distributed to them evenly, and therefore you want the batch size to be small. The smaller the batch size, the more overhead is required to deliver messages to consumers. Nevertheless, for slow consumers, there is generally a net performance gain to using small batch sizes.
Client Runtime Message Flow Adjustments
This section discusses flow control behaviors that affect performance (see Client Runtime Configuration). These behaviors are configured as attributes of connection factory administered objects. For information on setting connection factory attributes, see Chapter 8, "Managing Administered Objects."
Message Flow Metering
Messages sent and received by clients (JMS messages), as well as Message Queue control messages, pass over the same client-broker connection. Delays in the delivery of control messages, such as broker acknowledgments, can result if control messages are held up by the delivery of JMS messages. To prevent this type of congestion, Message Queue meters the flow of JMS messages across a connection.
JMS messages are batched (as specified with the imqConnectionFlowCount property) so that only a set number are delivered. When the batch has been delivered, delivery of JMS messages is suspended, and only pending control messages are delivered. This cycle repeats, as other batches of JMS messages are delivered, followed by pending control messages.
The value of imqConnectionFlowCount should be kept low if the client is doing operations that require many responses from the broker; for example, the client is using the CLIENT_ACKNOWLEDGE or AUTO_ACKNOWLEDGE modes, persistent messages, transactions, queue browsers, or if the client is adding or removing consumers. If, on the other hand, the client has only simple consumers on a connection using DUPS_OK_ACKNOWLEDGE mode, you can increase imqConnectionFlowCount without compromising performance.
Message Flow Limits
There is a limit to the number of JMS messages that the Message Queue client runtime can handle before encountering local resource limitations, such as memory. When this limit is approached, performance suffers. Hence, Message Queue lets you limit the number of messages per consumer (or messages per connection) that can be delivered over a connection and buffered in the client runtime, waiting to be consumed.
Consumer-based Limits
When the number of JMS messages delivered to the client runtime exceeds the value of imqConsumerFlowLimit for any consumer, message delivery for that consumer stops. It is resumed only when the number of unconsumed messages for that consumer drops below the value set with imqConsumerFlowThreshold.
The following example illustrates the use of these limits: consider the default settings for topic consumers
imqConsumerFlowLimit=1000
imqConsumerFlowThreshold=50
When the consumer is created, the broker delivers an initial batch of 1000 messages (providing they exist) to this consumer without pausing. After sending 1000 messages, the broker stops delivery until the client runtime asks for more messages. The client runtime holds these messages until the application processes them. The client runtime then allows the application to consume at least 50% (imqConsumerFlowThreshold) of the message buffer capacity (i.e. 500 messages) before asking the broker to send the next batch.
In the same situation, if the threshold were 10%, the client runtime would wait for the application to consume at least 900 messages before asking for the next batch.
The next batch size is calculated as follows:
imqConsumerFlowLimit - (current number of pending msgs in buffer)
So, if imqConsumerFlowThreshold is 50%, the next batch size can fluctuate between 500 and 1000, depending on how fast the application can process the messages.
If the imqConsumerFlowThreshold is set too high (close to 100%), the broker will tend to send smaller batches, which can lower message throughput. If the value is set too low (close to 0%), the client might be able to finish processing the remaining buffered messages before the broker delivers the next set, causing message throughput degradation. Generally speaking, unless you have specific performance or reliability concerns, you will not have to change the default value of imqConsumerFlowThreshold attribute.
The consumer-based flow controls (in particular imqConsumerFlowLimit) are the best way to manage memory in the client runtime. Generally, depending on the client application, you know the number of consumers you need to support on any connection, the size of the messages, and the total amount of memory that is available to the client runtime.
Connection-based Limits
In the case of some client applications, however, the number of consumers might be indeterminate, depending on choices made by end users. In those cases, you can still manage memory, using connection-level flow limits.
Connection-level flow controls limit the total number of messages buffered for all consumers on a connection. If this number exceeds the imqConnectionFlowLimit, delivery of messages through the connection stops until that total drops below the connection limit. (The imqConnectionFlowLimit is only enabled if you set the imqConnectionFlowLimitEnabled property to true.)
The number of messages queued up in a session is a function of the number of message consumers using the session and the message load for each consumer. If a client is exhibiting delays in producing or consuming messages, you can normally improve performance by redesigning the application to distribute message producers and consumers among a larger number of sessions or to distribute sessions among a larger number of connections.