Using Thread Analyzer to Evaluate Mandelbrot
The Thread Analyzer is used to see where the performance bottlenecks are occurring. In our example, we chose to check which procedures were waiting on locks.
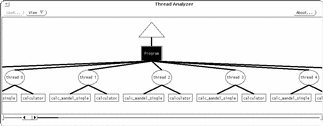
In our example, after recompiling the program to instrument it for Thread Analyzer, we displayed the main window. The main window shows the program's threads and the procedures they call.
Figure 8-1 Thread Analyzer Main Window (partial)
Thread Analyzer allows you to view the program in many ways, including those listed in Table 8-1:
Table 8-1 Thread Analyzer Views|
View |
Meaning |
|---|---|
|
Graph |
Plot the value of selected metrics against wallclock time. |
|
gprof(1) Table |
Display call-graph profile data for threads and functions. |
|
prof(1) Table |
Display profile data for program, threads, and functions. |
|
Sorted Metric Profile Table |
Display a metric for a particular aspect of the program. |
|
Metric Table |
Show multiple metrics for a particular thread or function. |
|
Filter Threads by CPU |
Display the threads whose percent of CPU is equal to or above a designated threshold. |
|
Filter Functions by CPU |
Display the functions whose percent of CPU is equal to or above a designated threshold. |
To look at wallclock and CPU times, choose the Graph view, and select CPU, Wallclock time, and Mutex Wait metrics. Figure 8-2 displays the Graph view of the wallclock and CPU times:
Figure 8-2 Thread Analyzer: Wallclock and CPU Time
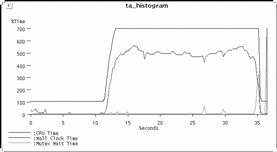
According to this graph, CPU time is consistently below wallclock time. This indicates that fewer threads than were allocated are being used, because some threads are blocked (that is, contending for resources).
Look at mutex wait times to see which threads are blocked. To do this, you can select a thread node from the main window, and then Mutex Wait from the Sorted Metrics menu. The table in Figure 8-3 displays the amount of time each thread spent waiting on mutexes:
Figure 8-3 Thread Analyzer: Mutex Wait Time
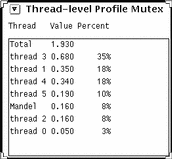
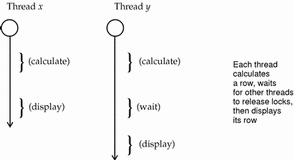
The various threads spend a lot of time waiting for each other to release locks. (In this example, Thread 3 waits so much more than the others because of randomness.) Because the display is a serial resource--a thread cannot display until another thread has finished displaying--the threads are probably waiting for other threads to give up the display lock.
Figure 8-4 shows what's happening.
Figure 8-4 Mandelbrot Multithreaded: Each Thread Calculates and Displays
To speed things up, rewrite the code so that the calculations and the display are entirely separate. Figure 8-5 shows how the rewritten code uses several threads simultaneously to calculate rows of points and write th results into a buffer, while another thread reads from the buffer and displays rows:
Figure 8-5 Mandelbrot Threaded (Separate Display Thread)
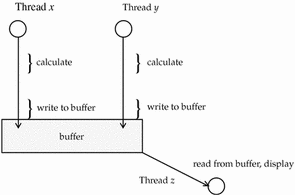
Now, instead of the display procedure of each thread waiting for another thread to calculate and display, only the display thread waits (for the current line of the buffer to be filled). While it waits, other threads are calculating and writing, so that there is little time spent waiting for the display lock.
Display the mutex wait times again to see the amount of time spent waiting on a mutex:
Figure 8-6 Thread Analyzer: Mutex Wait Time (Separate Display Thread)
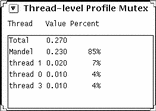
The program spends almost all of its time in the main loop (Mandel), and the time spent waiting for locks is reduced significantly. In addition, Mandelbrot runs noticeably faster.
- © 2010, Oracle Corporation and/or its affiliates
