|
Lights Out Management Module |
The Lights Out Management (LOM) control module on the Sun Control Station allows you to perform certain management functions remotely on hosts that are compliant with the Intelligent Platform Management Interface (IPMI) version 1.5. This document explains the features and services available through the Lights Out Management control module.
The LOM module implements functionality available within IPMI v1.5.
The sensors return information on the following components:
For an explanation of the icons in the top-right corner of the user interface (UI), refer to Chapter 1 of the PDF Administrator Manual.
For the LOM control module to function, the Linux kernel source RPM must be installed on the managed host on which you want to run the LOM functions.
The LOM control module includes a device driver that is compiled automatically when the module is installed on the managed host; the kernel source RPM is necessary for this device driver to compile successfully.
You do not need the Linux kernel source RPM if the managed host is running a Sun Linux distribution.
The LOM control module can run over either built-in network interface (eth0 or eth1) on a managed host. However, if both built-in network interfaces on a managed host are active, the managed host defaults to eth0.
To force the managed host to use the eth1 interface, you must modify the following script on that host host.
1. In your preferred editor, open the following file.
/etc/init.d/bmcscript
2. For a Sun Fire V60x or Sun Fire V65x server, edit the IFACE and CHANNEL lines to the values shown here.
# Channel 6 == eth0, top interface on V60x and V65x
# Channel 7 == eth1, bottom interface on V60x and V65x
IFACE=eth1
CHANNEL=7
3. For a Sun LX50 server, edit the IFACE and CHANNEL lines to the values shown here.
# Channel 6 == eth1, top interface on LX50
# Channel 7 == eth0, bottom interface on LX50
IFACE=eth1
CHANNEL=6
4. Save your changes in this file.
/etc/init.d/bmcscript start
When you launch a task (for example, updating the sensor information for a managed host), a Task Progress dialog appears in the user interface (UI). This dialog has a Status field indicating the current status of the task and a progress bar. When the progress bar displays 100%, the task has completed.
If you want to perform another task in the UI while the current task is underway, you can put the Task Progress dialog in the background. Simply click the button labelled Run Task In Background below the progress bar.
To return to the Task Progress dialog, select Administration > Tasks on the left. The Task table appears. If the task is still underway, a status message is displayed in the Duration column. Click on the progress-bar icon in this column to re-display the Task Progress dialog for this task.
Once the task is complete and the progress bar displays 100%, two buttons appear below the Task Progress dialog: Done and View Events.
The Schedule feature (also referred to as the Scheduler) allows you to schedule a task or tasks to be performed at a later time.
If a task can be scheduled by the Sun Control Station, a button labelled Schedule appears in the table or selector window of the final step.
The Scheduler works in the same way for any task:
1. Fill in the necessary fields for the task.
The Schedule Settings For <Task> table appears.
3. Configure the schedule settings.
For some functions, you can set the frequency of the task with a pull-down menu above the table (for example, hourly or daily).
You can also enter an email address of the person who will be notified when the scheduled task begins or finishes, or both.
The scheduled task then appears in the Scheduled Tasks table under Administer > Schedule.
5. In this table, you can view details for, modify or delete a scheduled task.
To view the details of a scheduled task, click the magnifying-glass icon.
To modify a scheduled task, click the pencil icon.
To delete a scheduled task, click the delete icon.
The status of each service or hardware component is indicated by a colored circle and icon--grey with dotted line, green with checkmark, yellow with exclamation mark or red with X mark--beside each item. The colors have the following significance:
 Grey with dotted line--No information is available, or the service or the monitoring feature is not enabled on the host.
 Green with checkmark--The service or component is functioning normally.
 Yellow with exclamation mark--There is moderate use on the host or a component is recovering.
 Red with X--There is heavy use on the host or a failure.
In the detailed tables for each of the sensors, the last column is Comment. Entries in this column provide further information regarding the status of the sensors.
When you click the Lights Out Management menu item on the left, the sub-menu items allow you to perform power-on or power-off operations, or view the sensor and SEL data from the managed host.
Once you import an IPMI-compliant host into the control-station framework, the Sun Control Station configures the IPMI functions for the user and re-writes the Baseboard Management Controller (BMC) password.
An IPMI-compliant host, such as the Sun LX50 server, can still receive IPMI commands from any IPMI sender, (and not just the Sun Control Station). If you do want to access a managed host through a different IPMI sender, you must use the BMC password set by the control station. The password is written in a root-readable file /etc/rc.d/init.d/bmcscript.
Sun recommends against changing the BMC password outside of the control-station framework, as this can leave the IPMI-compliant host in an inconsistent state.
Consider the following scenario: An administrator adds an IPMI-compliant host to the control station. The administrator then decides to change the BMC password on the host manually, outside of the control-station framework. This can be done by changing the password either in the init script or through an application within the service partition. In this case, the control station does not check whether the password was changed.
This does not affect the IPMI commands that update the sensor data and System Event Log (SEL), the power-on command or the identify command, as each command will return an error message that the BMC password stored in the control station is wrong.
However, the reset command and the power-down command each set the run level to 0 (init 0) on the managed host before sending the IPMI command to that host. Once the run level is set to 0, the control station can no longer contact the managed host through IPMI and power it on again. The administrator must physically power on the host again and then re-add it to the control station for it to be managed correctly.
For more information on how the selector window works, see "Selector window" in Chapter 3 of the PDF Administrator Manual.
The Power sub-menu item allows you to perform power-management functions on a managed host(s).
When you click on the Power sub-menu item, the selector appears, displaying the groups and the managed hosts within each group. At the bottom of the selector, the following buttons appear; see FIGURE 1.
This is a known issue on with the LOM module. If you send the Power Off command to a managed host through the LOM module and then, in quick succession, send the Power On command (before the Power Off command is completed), the managed host may be left in an init 0 state: the host is still powered on but the operating system is shut down.
You can correct this problem by sending the Power Off command to the managed host again.
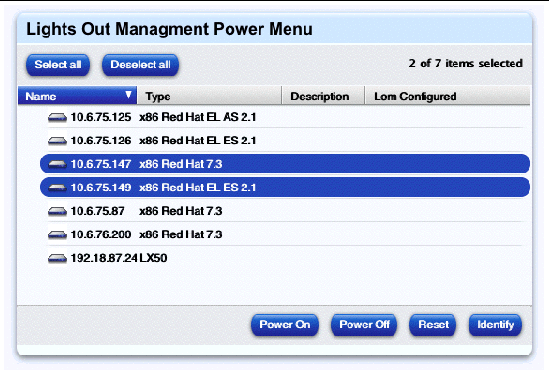
The Power On command allows you to power on a host remotely.
|
Note - If a host is already powered on, this command does not affect the host. |
1. Select Lights Out Management > Power.
The selector appears, displaying the list of managed hosts.
2. Click to highlight a host(s). You can also click Select All at the top to choose all hosts in the list.
3. Click Power On in the bottom-right corner.
The Task Progress dialog appears.
The Power Off command allows you to shut down and power off a host remotely.
|
Note - If a host is already powered off, this command does not affect the host. |
To shut down and power off a host:
1. Select Lights Out Management > Power.
The selector appears, displaying the list of managed hosts.
2. Click to highlight a host(s). You can also click Select All at the top to choose all host in the list.
3. Click Power Off in the bottom-right corner.
The Task Progress dialog appears.
The Reset command causes a hardware reset. If the host is operating normally, the system shuts down elegantly and reboots. If the system is hung up and not responding, the Reset command will then force the hardware to reset.
|
Note - If the host is powered off, this command does not affect the host. |
1. Select Lights Out Management > Power.
The selector appears, displaying the list of managed hosts.
2. Click to highlight a host(s). You can also click Select All at the top to choose all hosts in the list.
3. Click Reset in the bottom-right corner.
The Task Progress dialog appears.
On hosts that have an identifying LED, such as the Sun LX50 server or the Sun Fire V60x and V65x servers, the Identify command causes a blue LED to flash on the front panel and back panel; this is useful if you need to locate the host in an equipment rack.
The LED flashes for four minutes and then shuts off.
1. Select Lights Out Management > Power.
The selector appears, displaying the list of managed hosts.
2. Click to highlight a host(s). You can also click Select All at the top to choose all hosts in the list.
3. Click Identify in the bottom-right corner.
The Task Progress dialog appears.
The Sensors/SEL sub-menu item allows you to view the current data from the sensors or the System Event Log (SEL) on the host, update the data in real time, or schedule an update of the data for a later time.
When you click on the Sensors/Event Log sub-menu item, the selector appears, displaying the groups and the hosts within each group. At the bottom of the selector, the following buttons appear; see FIGURE 2.
When you update the sensor and SEL information, the function retrieves the entire SEL from the host, even though you can view only the 50 most-recent records in the SEL. A full SEL contains over 3000 records. The updated SEL information in not displayed until the entire SEL in retrieved from the managed host(s).
When the SEL on a host is near capacity, a command that retrieves the SEL (such as the import or update functions) can take up to several minutes to return the new data to the control station UI.
The more entries that are contained in the SEL, the longer it takes to retrieve the SEL. For example, if you are updating the information for two hosts whose SELs are near capacity and two whose SELs are near empty, it takes longer to retrieve the SELs that are near capacity.
The amount of time to execute an operation also depends on the number of hosts on which the command is being executed. For example, retrieving the SEL from ten hosts requires more time than retrieving the SEL from three hosts, if each of the SELs is roughly at the same capacity.
You should take these two factors into account if you decide to schedule the updating of sensor and SEL information for a number of managed hosts.
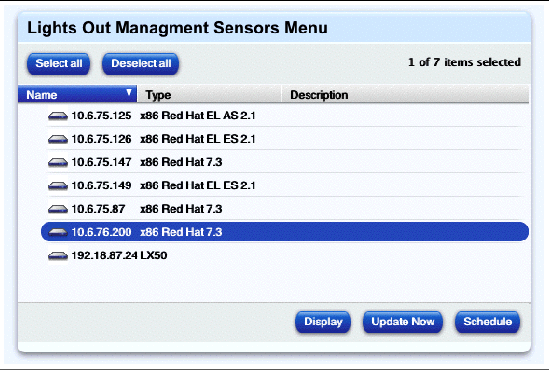
1. If you power off a Sun LX50 server and then update the sensor data and SEL, the BMC returns the last sensor states in its memory before the server was powered off. The sensor values for the fans and voltages do not indicate that the server has been powered off.
To reset the sensor values to 0, you must physically disconnect the Sun LX50 server from the power source. If you then update the sensor data and SEL, the BMC returns sensor values of 0.
2. When a fan sensor goes beyond the alarm threshold, the sensor does not reset its status indicator to "normal" when the problem is fixed. This includes the other fans increasing their speed to compensate for the out-of-threshold fan, the amber LED on the front panel of the server remaining illuminated and the indicator in the Health Monitoring module showing an alert status.
To return a fan sensor to normal status, you must reset or reboot the host.
3. An issue may arise if you want to schedule information updates for a large number of hosts at a short interval, for example 30 minutes. If the SEL is at or near capacity for a few of these hosts, the first scheduled update operation may not complete before the second update operation begins. In this case, the sensor and SEL information may not be updated in the control station UI, because the complete set of updated data may not have been retrieved from the hosts before the next update operate began.
To avoid such a situation, space the schedule the update operation at longer intervals, taking into account the number of hosts and the percentage-full state of the SEL on each host.
4. If a Linux-based host is powered off, the control station is not able to retrieve all relevant SEL and sensor information. This is because some of that information must be retrieved through the imb drivers, which require the host's OS to be running.
The commands that cannot be performed when a host is powered off include:
You can view a summary of the sensor data for a host. From the resulting summary table, you can then view detailed tables of the sensor data, view the SEL and update the current data.
This data be updated even if the host is currently powered off.
|
Note - Summary LOM sensor data from a managed host is also displayed in the Health Monitoring module. See Sensor data in the Health Monitoring module. |
To display a summary of the sensor data for a host:
1. Click Lights Out Management > Sensors/SEL.
The selector appears, displaying the list of managed hosts.
2. Click to highlight a host(s). You can also click Select All at the top to choose all hosts in the list.
3. Click Display in the bottom-right corner.
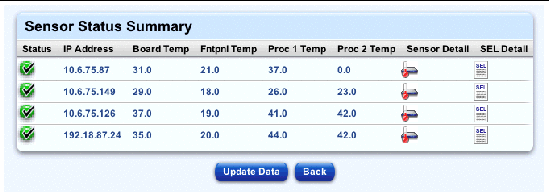
The Sensor Status Summary table appears; see FIGURE 3.
The sensors return information on the following components:
4. In the columns on the right side, you can do one of the following:
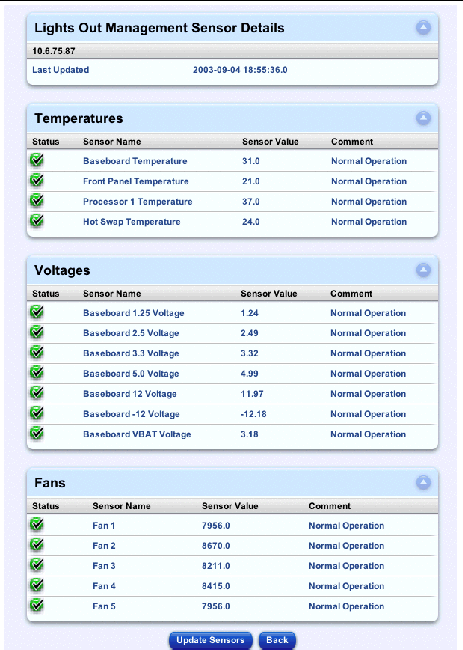
5. If you click on the Sensor Details icon, tables containing more detailed sensor data appear.
The screen displays the Temperatures, Voltages and Fans tables.
Depending on the type of host, different sensors appear in these tables.
Click Back to return to the Sensor Data summary table or click Update Data to update the sensor data (see Updating the host information); see FIGURE 4.
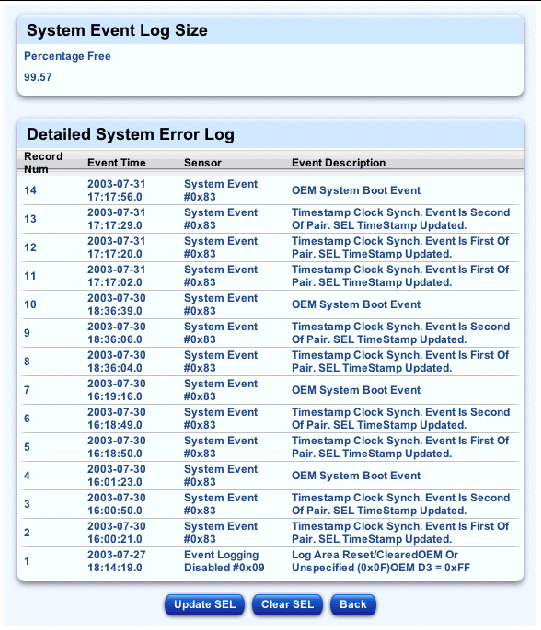
6. If you click on the System Event Log icon, records from the SEL appear; see FIGURE 5. The most recent 50 events appear in the table.
The Detailed System Event Log table displays the following information:
For more information on the event descriptions, refer to the IMPI documentation at
http://www.intel.com/design/servers/ipmi/index.htm.
From this screen, you can clear the SEL (see Clearing the SEL) or update the SEL (see Updating the SEL).
Click Back to return to the Sensor Data summary table.
You can clear the SEL for a managed host.
|
Note - Once cleared, the SEL data is not recoverable. As this data may be needed by Sun Technical Support, take note of any unusual failure modes before clearing the SEL. |
 In the screen displaying the detailed SEL tables, click Clear SEL below the Detailed System Event Log table.
The Task Progress dialog appears.
You can update the information retrieved the SEL for a managed host.
 In the screen displaying the detailed SEL tables, click Update SEL below the Detailed System Event Log table.
The Task Progress dialog appears.
|
Note - The Update Now feature in the Detailed System Event Log table updates the SEL information only. It does not update the sensor data. |
The Update feature allows you to retrieve the most recent sensor data and SEL on a managed host.
You can update the sensor data and SEL from a number of places in the UI:
This feature updates all sensor data and SEL information for the managed host(s) that you have highlighted.
This feature updates all sensor data and SEL information for that particular host.
The Task Progress dialog appears.
|
Note - You can also schedule the updating of the host information for a later time. For more information, see Schedule. |
In the Health Monitoring module, you can view detailed information tables of the state of components and services on a managed host.
When you view these tables for a host that reports LOM sensor data (such as the Sun LX50 server), the summary data appears in the Other System Services table. This data includes:
You can enter an email address in the Health Monitoring module so that someone receives alerts from the Health Monitoring module when there are critical system events (red circle).
For more information, refer to the PDF Health Monitoring Module.
IPMI defines common interfaces to "intelligent" hardware used to monitor a server's physical health characteristics, such as temperature, voltage, fans, power supplies and chassis. In addition to health monitoring, IPMI includes other system-management capabilities such as automatic alerting, automatic system shutdown and restart, remote restart and power control capabilities, and asset tracking.
IPMI-based server management allows a user to determine the health of the server hardware, whether the server is running normally or is in a non-operational state. Servers based on IPMI use "intelligent" or autonomous hardware that remains operational even when the processor is down so that platform management information and control capabilities are always accessible. The robust and authenticated IPMI interfaces enable access to the same management capabilities from serial/modem, LAN, local management software, third-party emergency management add-in cards and other IPMI-enabled servers under all system phases: power down, reboot, OS load and run-time.
For more information on IPMI, refer to
http://www.intel.com/design/servers/ipmi/index.htm.
Copyright © 2003, Sun Microsystems, Inc. All rights reserved.