Configuring the Business Process Instance Display
When BPs are configured for reporting persistence, you can configure the display of the BP information, and suspend, resume, and terminate a BP.
Choosing Business Process Attributes to Display
In the list of BP instances, you can change the following options:
-
Columns to show
-
Columns to hide
-
Column order
-
Maximum rows per page
-
Instance list refresh rate
-
Total number of Business Process instances allowed
The following procedure provides the steps for choosing Business Process attributes to display in the list of Business Process instances.
 To choose BP attributes to display
-
In the Business Process Instance Monitor toolbar, click Choose Preferences.
The Choose Business Process Attributes to Display dialog box appears.
-
To hide columns that are currently visible in the list of BP instances, do the following:
-
In the Chosen Columns list, select the columns you want to hide.
-
Click the double left arrow button to move the selected columns to the Available Columns list.
-
To display columns that currently do no appear in the list of BP instances, do the following:
-
In the Available Columns list, select the columns you want to show.
-
Click the double right arrow button to move the selected columns to the Chosen Columns list.
-
In the Maximum Rows Per Page field, enter the number of rows you want to display on each page of the list of BP instances.
-
In the Instance List Refresh Rate field, enter the number of seconds you want to pass between refreshes of the list of BP instances.
-
In the Number of BP Instances field, enter the maximum number of BP instances you want to monitor.
-
Click Change Preferences.
Changing the Display Name of an Attribute
If you prefer to monitor BP instance attributes using shortened names, you can change the display names of the attributes you want to include in the list of BP instances. The following procedure provides the steps for changing the display names of BP instance attributes.
 To change the display name of an attribute
-
In the Business Process Instance Monitor toolbar, click Change Attribute Display Names.
The Change Attribute Display Name dialog box appears.
-
In an attribute display name field, edit the text of the attribute display name.
-
Continue editing these text fields as necessary.
-
Click Submit.
-
To return the attribute display names to their default settings, click Change Attribute Display Names again, and then click Reset on the dialog box.
Filtering Business Process Instances
You can filter the list of BP instances in order to see only BP instances that meet a specific set of criteria. The Filter Business Process Instance dialog box provides the following filters.
-
BP instance status
-
Start date range
-
Update date range
-
BP attribute
 To filter the list of BP instances
-
In the Business Process Instance Monitor toolbar, click Filter Business Process Instances.
The Filter Business Process Instances dialog box appears.
-
In the Status field, select a BP status.
-
In the Time Stamp field, select a time stamp type.
-
In the From field, click Select Date and/or Time and select the date or time.
-
In the To field, click Select Date and/or Time and select the date or time.
-
In the Business Process Attribute field, select the attribute and filter criteria operator and text.
-
Click Filter.
Viewing the Content of a Business Process Attribute
The Business Process Instance Attributes tool allows you to view the XML content of all the attributes in a BP.
 To view the content of a BP attribute
-
In the Business Process Instance Monitor toolbar, click Business Process Instance Attributes.
The Business Process Instance Attributes dialog box appears with a list of each attribute and its XML content.
-
To see the XML content in a structured XML viewer, click View XML.
Viewing Activity Details
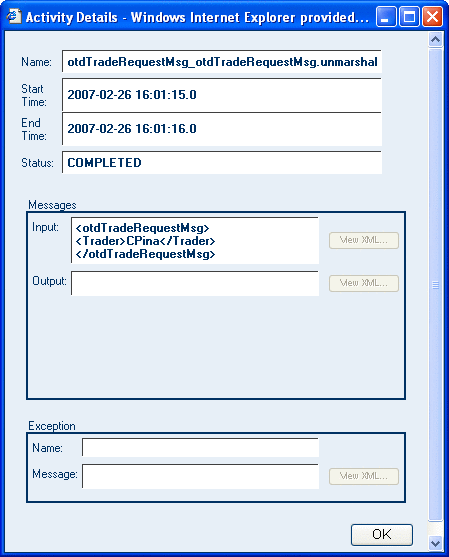
The Activity Details tool allows you to view details of the selected activity, including the following information:
-
Name
-
Start time
-
End time
-
Status
-
Message input and output (XML viewer)
-
Exception content
 To view activity details
-
In the BP, select the activity for which you want to view details.
-
In the Business Process Instance Monitor toolbar, click Activity Details.
The Activity Details dialog box appears.
Figure 1 Activity Details Dialog Box

-
To see the XML content of the input, output, or exception message in a structured XML viewer, click View XML.
- © 2010, Oracle Corporation and/or its affiliates
