Customizing Performance Meters
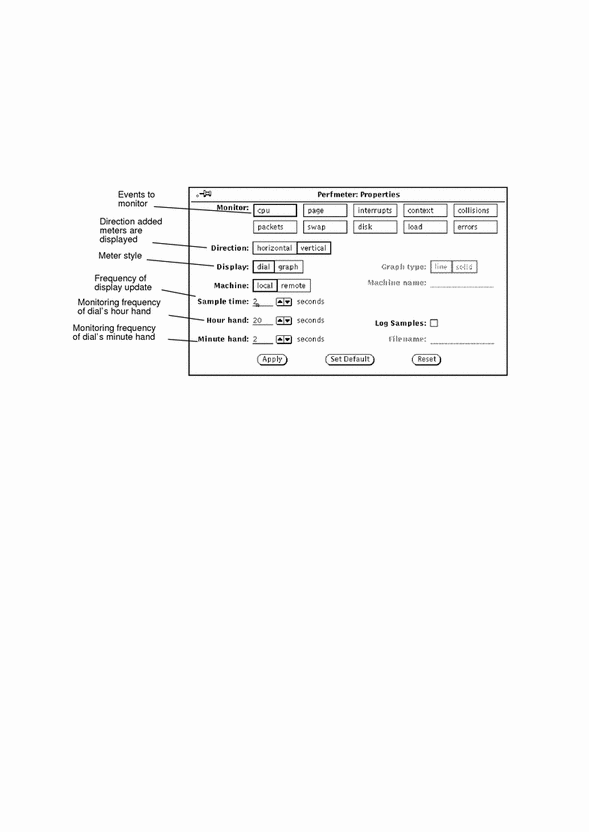
You can customize many aspects of the Performance Meter from the Properties window shown in Figure 9-6. Choose Properties from the Performance Meter pop-up menu to display the Properties window, or move the pointer anywhere into the Performance Meter window and press the Props key on your keyboard.
Figure 9-6 The Performance Meter Properties Window

Performance Meter Monitors
Selecting one or more of the Monitor settings and clicking SELECT on the Apply button changes the display to show performance of the selected item or items. If more than one Monitor setting is selected, the Performance Meter displays all of the selected dials or graphs at the same time. Figure 9-7 shows three aspects of system performance being monitored at the same time.
Figure 9-7 Performance Monitor with Three Horizontal Displays

The Direction setting determines whether multiple monitors are displayed side-by-side (horizontally), or stacked on top of each other (vertically). In Figure 9-7, the Direction setting is horizontal. In Figure 9-8, the Direction setting is vertical.
Figure 9-8 Performance Monitor with Vertical Displays

Note that the performance meter does not try to fit multiple graphs in the window based on the shape of the window. It always uses the Direction setting to determine if the graphs are displayed horizontally or stacked vertically. For example, if you have a vertical display like the one in Figure 9-8, resizing the window to be short and wide (as in Figure 9-7) does not change the Direction display to be horizontal.
Performance Meter Display Options
As discussed earlier, you can monitor system performance with either dial or graph displays. Use the Display setting of the Performance Meter Properties window to choose Dial or Graph displays. Remember to click SELECT on Apply to change the display in this session only, or click SELECT on Set Default to make the selected display your default every time you start the Performance Meter.
If you choose Graph, the Graph Type setting is activated on the Properties window. Choose Line to display a single line graph, and choose Solid to display a solid graph. Figure 9-9 shows a Performance Meter with a line graph on the left, and a solid graph on the right.
Figure 9-9 Line Graph and Solid Graph Displays


Performance Meter Machine
You can monitor performance for your own system or for another system on the network. To monitor a remote system, follow these steps:
-
Click SELECT on the Remote Machine setting of the Performance Meter Properties window.
The Machine name text field is activated.
-
Type the name of the machine you want to monitor in the text field.
-
Click SELECT on the Apply or Set Default button.
The Performance Meter displays the name of the remote system at the bottom of the pane under the name of the value you are monitoring, as shown in Figure 9-10. Click SELECT on Set Default to make the remote system the default monitored system every time you run the Performance Meter.
Figure 9-10 Monitoring a Remote Machine

To change back to your system, click SELECT on Local, then click SELECT on the Apply or Set Default button.
Performance Meter Display and Sample Intervals
You can change the Sample Time (the frequency that the meters are updated) and the units measured by the hour and minute hands on the dial display with the Sample time, Hour hand, and Minute hand settings. The default is for the hour hand to show a sample over a 20-second interval and the minute hand the average over a 2-second interval. If you change the values in these fields, remember to click SELECT on the Apply or Set Default button to record the changes.
If you'd like to save and examine individual samples, check the Log Samples checkbox on the Properties window. This activates the Filename text field. Samples are saved in the file typed in the Filename text field. If no file name is specified, samples are saved in a file in your home directory called perfmeter.logXXX, where XXX is replaced by a unique identifier.
Do not specify the same file name for more than one Performance Meter at the same time. Either specify a different file name for each sample file, or do not specify any file name at all and let the Performance Meter construct unique file names.
Do not leave the Performance Meter running for a long time with Log Samples on. The file with the samples will keep getting larger until your system runs out of disk space on the file's partition.
- © 2010, Oracle Corporation and/or its affiliates
