| Sun Ray Server Software 4.0 Administrator’s Guide for Solaris |
| Sun Ray Server Software 4.0 Administrator’s Guide for Solaris |
| C H A P T E R 8 |
|
Monitoring the Sun Ray System |
This chapter describes how to use the Sun Management Center software to monitor the Sun Ray System. Installation instructions for the Sun Management Center are located in Installing the SunMC Software of the Sun Ray System Software 4.0 Installation and Configuration Guide.
The Sun Management Center software monitors managed objects in the Sun Ray system. A managed object is any object that can be monitored. Sun Ray nodes contain many managed objects. The Create Topology Object dialog box enables you to create a Sun Ray node. If the Sun Ray packages are installed when you create a Sun Ray node, the following managed objects are created by default:
Each managed object is monitored separately and has independent alarm settings.
For example, in a failover configuration, the entire group as well as any part of the group can be monitored--each server and its load, each interconnect, and each DTU. Sun Management Center software also monitors Sun Ray Server Software daemons that:
After you set an alarm, the Sun Management Center software notifies you when your specified parameter value has been reached. For example, you might want to track the number of DTUs on a server so that you can monitor possible overload scenarios. Other alarms can be set to notify you when a server, interconnect, or DTU goes down or when a daemon is not running.
The three Sun Management Center components (TABLE 8-1) can be installed on three separate machines.
Sun Ray system monitoring consists of a set of packages, which are installed as part of Sun Ray Server Software. If you run the Sun Management Center on a non-Sun Ray server, you must add some packages that contain localized messages and icons to the Sun Management Center monitoring server.
This feature interfaces with the Sun Management Center software using SNMP. For information on additional monitoring programs that interact with Sun Management Center software, see Using Other Monitoring Programs.
There are other useful Sun Management Center modules available to monitor processes and help tune your Sun Ray system. For example, the Health Monitor module monitors resources on the Sun Ray server so you know when to add memory, swap space, or additional CPUs. The Sun Management Center Process Monitoring module helps identify runaway processes and limit multimedia applications.
After installing the Sun Management Center software, you need to set up your monitoring environment. A default administrative domain is automatically created for you based on the Sun Management Center server component. You need to set a home administrative domain. This domain is displayed whenever the console is started. Next, create the hierarchy of the system you want to monitor. This can be done manually by adding nodes to the administrative domain or by using the Discovery Manager.
1. After installing the Sun Management Center software, start the console on the server that has the console component installed:
The login screen is displayed.
2. Enter your user name and password.
Specify the Sun Management Center server.
The Sun Management Center window is displayed. If this is your first time using the SunMC console, the Set Home Domain window is also displayed.
4. In the Set Home Domain window, highlight the appropriate domain and click Go To.
The panels in the Sun Management Center window are populated.
5. Click Close to dismiss the Set Home Domain window.
1. Expand the Sun Management Center Domains list.
2. Select the domain you plan to add an object to.
The selected domain is displayed.
3. Select Edit -> Create an Object.
The Create Topology Object pop-up window is displayed.
4. On the Node page, enter a Node Label and Description. Then enter the Hostname (server name), IP Address, and Port for the Sun Ray server.
The port entered here must be the same port you configured (entered) during the installation of the Sun Management Center.
Alarms are used to notify you when errors occur or your performance needs to be tuned. Alarms are triggered (tripped) if:
These alarms are set by default, but you can change them. Base a tuning alarm on the number of active sessions on each server in a failover group to determine if one of the servers is overloaded. You set the thresholds that trigger this type of alarm.
1. After creating an object, bring up the Details window of the object.
FIGURE 8-1 Sun Management Center Details Window

2. Double-click, for example, Failover Group in the left panel.
3. Right-click the value portion (Status) of the table row.
FIGURE 8-2 Example Using the Failover Group Panel

The Attribute Editor window for that table entry is displayed.
5. Select the Alarms tab (See FIGURE 8-3.)
The possible alarm values are:
6. Supply an appropriate number for the type of alarm that you choose to monitor.
In this example, the Alert Threshold alarm is set at greater than 1 to notify you when that server in the failover group is down.
7. Click the Apply button to save the value of the alarm and continue setting other values in the Attribute Editor
8. Click the OK button, which saves the value of the alarm and closes the window.
As soon as you set an alarm it takes effect.
9. Select the Actions tab and enter an action to perform.
Here you can also specify an action such as sending email or running a script for each alarm.
10. Select the Refresh tab to set the number of seconds between pollings.
The default value is 300 seconds (5 minutes).
11. Select the History tab to view information about the log file that records monitored values.

If an alarm is tripped, a critical alarm displays as red, an alert alarm displays as yellow, and a caution displays as blue (see FIGURE 8-4).
1. Start the Sun Management Center software:
A window for the Default domain is displayed.
2. Log in to the Sun management Center server.
3. Double-click the server in either panel.
The server Details window is displayed.
4. Expand the hierarchy in the left or right panel until it displays the level you want.
FIGURE 8-4 Details Window With Alarms

This console Details window shows the hierarchical details of your system. You can immediately see if any alarms have been tripped. An alarm’s area and type appear in the left panel as a colored circle with a bar. The Alert alarm also shows up on the title bar by the server node name and at the Operating System, Sun Ray, and Failover Group levels. Double-clicking the area where an alarm icon is present updates the right panel with the detailed information. If you position the mouse pointer over one of the colored circles in either panel, a pop-up window is displayed detailing the alarm information.
If you click the Alarms tab in the Details window, a window is displayed that lists a summary of all the current alarms. When you stop the Sun Ray services (daemons), the alarms display as shown in FIGURE 8-5.
FIGURE 8-5 Alarm Summary Window

The total number of alarms set for the current server object is displayed at the top of the alarm summary window. Critical alarms (red), alert alarms (yellow), and caution alarms (blue) that are tripped are listed below. Details and comments are displayed in the Message column.
Some cells in the table respond to a mouse-over event by displaying a pop-up window called a Tool Tip window. This window shows the current status and when it last changed, plus the type of alarm, its value, and when it occurred or when the last alarm was cleared. The Tool Tip time can also be the last time the agent was restarted. For example, on the Sun Ray System panel, a Tool Tip for Up Time (1/100ths sec.) would be:
Clear. Up Time (1/100th sec.) OK Status changed Mar. 6, 15:23:55.
indicating that the server was restarted and the alarm cleared on March 6 at 15:23:55. Similar information is provided for Active Sessions, Desktops, Users, and Total Sessions.
There are five managed objects that you can monitor:
The Sun Ray System panel displays an overview of your Sun Ray system. From this window you can set specific alarms to monitor the server and its load.
 Double-click the Sun Ray System icon in the left panel.
The Operating System/Sun Ray/Sun Ray System panel is populated.
FIGURE 8-6 Sun Ray System Panel

Click the refresh button (circular arrow in the upper right corner).
The entire system panel is refreshed.
The Up Time, session, DTU (desktop), and user information is refreshed periodically based on the number of seconds you set in the Attribute Editor. However, the console is updated only every five minutes unless an alarm occurs. The number of seconds set in the Attribute Editor only changes how soon an alarm is triggered.
| Tip - Do not set the seconds to less than 60. The load interferes with the Sun Ray server performance. |
In this panel, you set alarms to monitor the status of the server; how many sessions, users, or DTUs are active; and how many total sessions exist.
1. Click the Value cell of the Property you want to set an alarm for with the right mouse button.
4. Enter a value for each threshold you want to monitor.
The Sun Ray Services panel displays the status of the Sun Ray daemons. If, for example, utauthd is not running, all user sessions are disconnected.
On the Sun Ray Services panel, default alarm values are set for the status of each daemon and the number of instances. Some of the daemons have two instances, corresponding to their two functions: one to listen and one to interact. You can reset them if you want to.
FIGURE 8-7 Sun Ray Services (daemons) Panel

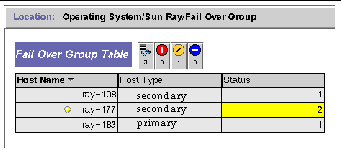
The Failover Group panel displays the topography of your failover group. The panel lists the primary and secondary servers and their status.
FIGURE 8-8 Failover Group Panel
The Interconnect panel lists all the network interfaces usable by the Sun Ray server.
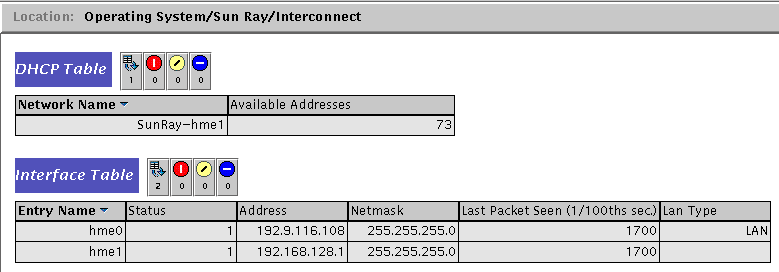
The DHCP Table lists the interfaces that are used for the Sun Ray interconnect. Available Addresses lists the number of addresses available for new end users. The alarms that are set here let the system administrator know when the Sun Ray server is running out of addresses to give to users.
The Interface Table lists all the interfaces on the Sun Ray server. The Address is the IP address for the interface. You entered this address as the Net Mask when you first configured your system. The Status values are:
1. Click the Available Addresses cell in the DHCP Table using the right mouse button.
4. Enter the number of addresses left when an alarm should be tripped.
The Desktops panel is where you can select individual DTUs to monitor. DTUs can be added and deleted from the Monitored Desktops list. In a failover group, you can monitor any desktop from any server. The default polling time is 300 seconds (5 minutes). The Status values are:

TABLE 8-3 describes the information in each column:
1. Click Name using the right mouse button.
3. In the Add Row window, enter the MAC address of the DTU you want to monitor in the Name field.
1. Using the right mouse button, click the cell containing the MAC address.
3. Confirm the deletion by clicking Yes on the pop-up window.
Sample results of polling the Desktops are provided below.
System administrators using HP OpenViewVPO, Tivoli TMS, or CA Unicenter can also monitor Sun Ray servers. An interoperability interface exists between each of these packages and the Sun Management Center software. These interfaces translate Sun Management Center alarms appropriately so that you are notified when problems arise. These interfaces also enable you to view the server status. Hewlett- Packard provides the interface needed between HP OpenViewVPO and Sun Management Center. Sun provides the interface needed between Sun Management Center and Tivoli TMS or CA Unicenter.
FIGURE 8-11 Example of Interoperability

In FIGURE 8-11, systems B and E must be Solaris SPARC systems; system C can be either a Solaris SPARC or a Solaris x86 system.
The Sun Ray module is uninstalled automatically when the utinstall script uninstalls Sun Ray Server Software. If you are uninstalling the Sun management Center software manually, please remove the Sun Ray module first.
To unregister the module on the Sun Ray server, type:
If the SunMC agent is running, utsunmc stops and restarts the Sun Management Center agent software.
To remove the Sun Ray module on the SunMC server, type:
| Sun Ray Server Software 4.0 Administrator’s Guide for Solaris | 820-0411 |
Copyright © 2007, Sun Microsystems, Inc. All Rights Reserved.
 To Set Up the Monitoring Environment