Monitoring Services
The broker includes components for monitoring and diagnosing application and broker performance. These include the following:
-
Components that generate data, a metrics generator and broker code that logs events.
-
A logger component that writes out information to a number of output channels.
-
A message producer that sends JMS messages containing metric information to topic destinations for consumption by JMS monitoring clients.
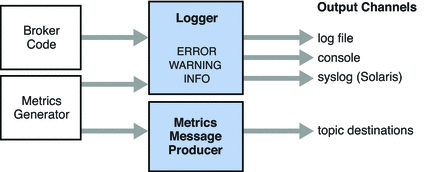
The general scheme is illustrated in Figure 3–4.
Figure 3–4 Monitoring Service Support

Metrics Generator
The metrics generator provides information about broker activity, such as message flow in and out of the broker, the number of messages in broker memory and the memory they consume, the number of open connections, and the number of threads being used.
You can set broker properties to turn the generation of metric data on and off, and to specify how frequently metrics reports are generated.
Logger
The Message Queue logger takes information generated by broker code and the metrics generator and writes that information to standard output (the console), to a log file, and, on SolarisTM platforms, to the syslog daemon process in case of errors.
You can set broker properties to specify the type of information gathered by the logger as well as the type written to each of the output channels. In the case of a log file, you can also specify the point at which the log file is closed and output is rolled over to a new file. Once the log file reaches a specified size or age, it is saved and a new log file created.
For details about how to configure the logger and how to use it to obtain performance information, see Configuring and Using Broker Logging in Sun Java System Message Queue 4.1 Administration Guide.
Metrics Message Producer
The metrics message producer shown in Figure 3–4 receives information from the metrics generator at regular intervals and writes the information into messages, which it then sends to one of a number of metric topic destinations, depending on the type of metric information contained in the message.
Message Queue clients subscribed to these metric topic destinations can consume the messages and process the metric data contained in the messages. This allows developers to create custom monitoring tools to support messaging applications. For details of the metric quantities reported in each type of metrics message, see Chapter 18, Metrics Reference, in Sun Java System Message Queue 4.1 Administration Guide. For information about how to configure the production of metrics messages, see Chapter 4, Using the Metrics Monitoring API, in Sun Java System Message Queue 4.1 Developer’s Guide for Java Clients and Writing an Application to Monitor Brokers in Sun Java System Message Queue 4.1 Administration Guide.
JES Monitoring Framework Support
Message Queue supports the Sun Java Enterprise System (JES) Monitoring Framework, which allows Java Enterprise System components to be monitored using a common graphical interface. This interface is implemented by a web-based console called the Sun Java System Monitoring Console. If you are running Message Queue along with other JES components, you might find it more convenient to use a single interface to manage all these components.
The JES monitoring framework defines a common data model (CMM) to be used by all JES component products. This model enables a centralized and uniform view of all JES components. Message Queue exposes the following objects to the JES monitoring framework:
-
the installed product
-
the broker instance name
-
the broker port mapper
-
each connection service
-
each physical destination
-
the persistent store
-
the user repository
Each one of these objects is mapped to a CMM object whose attributes can be monitored using the JES monitoring console. At runtime, administrators can use the console to view performance statistics, create rules to monitor automatically, and acknowledge alarms. For detailed information about the mapping of Message Queue objects to CMM objects, see the Sun Java Enterprise System Monitoring Guide.
To enable JES monitoring, you must do the following
-
Install and configure all the components in your deployment (Message Queue and other components) according to instructions given in the Sun Java Enterprise System Installation Guide.
-
Enable and configure the Monitoring Framework for all of your monitored components, as described in the Sun Java Enterprise System Monitoring Guide.
-
Install the Monitoring Console on a separate host, start the master agent, and then start the web server, as described in the Sun Java Enterprise System Monitoring Guide.
Using the JES Monitoring Framework will not impact broker performance because all the work of gathering metrics is done by the monitoring framework, which pulls data from the broker's existing monitoring data infrastructure.
- © 2010, Oracle Corporation and/or its affiliates
