Proxy Cache Monitoring
The Proxy Cache Monitoring page presents statistics related to the proxy cache service.
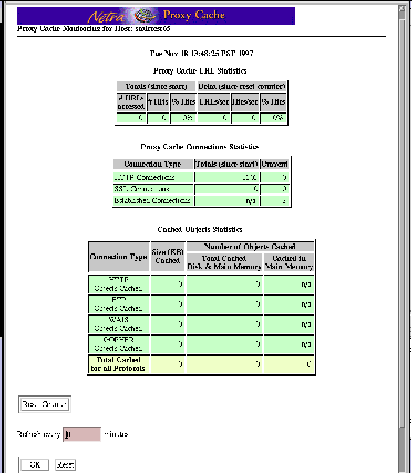
When you click the Proxy Cache Monitoring link in the Proxy Cache Administration page, a page such as that shown in Figure 13-2 is displayed.
Figure 13-2 Proxy Cache Monitoring Page

When you load the Proxy Cache Monitoring page, a snapshot of current proxy cache statistics is displayed. If you want periodic updates, specify a number of minutes in the "Refresh" field at the bottom of the page. Click Reset to return the refresh value to 0.
The tables in the Proxy Cache Monitoring for Host page are described as follows:
Proxy Cache URL Statistics
Provides statistics on the rate of URL requests and the extent to which requests are serviced from the local cache.
Proxy Cache Connection Statistics
Provides statistics on HTTP and SSL connections.
Cached Object Statistics
Provides statistics on the number of objects cached, for each type of object.
The headings in the just-mentioned tables are described as follows:
In the Proxy Cache URL Statistics table:
Under Totals (since start):
# URLs accessed
The number of requests for a URL fielded by the Netra Proxy Cache Server.
# Hits
The number of URL requests for which the Netra Proxy Cache Server was able to return an object from its own cache.
% Hits
URLs accessed divided by the number of hits. This is number tells you the extent to which the Netra Proxy Cache Server is able to respond to URL requests from the local cache.
Under Delta (since reset counter):
URLs/sec
The rate at which URL requests are being fielded by the Netra Proxy Cache Server, since the reset counter was last set to zero.
Hits/sec
The rate at which the Netra Proxy Cache Server was able to find requested objects in a local cache, since the reset counter was last set to zero.
% Hits
URLs accessed divided by the number of hits, since the reset counter was last set to zero.
In the Proxy Cache Connections Statistics table:
Connection Type
Has rows for HTTP and SSL connections and for established connections.
Totals (since start)
The total number of connections for each connection type, HTTP and SSL, since the last reboot of the host.
Current
The number of current connections for each connection type, HTTP and SSL, and the number of current established connections.
In the Cached Object Statistics table:
Connection Type
HTTP, FTP, WAIS, or Gopher.
Size (KB) Cached
The size of all objects cached for a given object type.
Under Number of Objects Cached:
Total Cached Disk & Main Memory
In effect, total number of objects cached on host, for a given object type.
Cached in Main Memory
Number of objects cached in main memory.
- © 2010, Oracle Corporation and/or its affiliates
