Viewing Domain Information
Both dr(1M) and Hostview enable you to display information about the suspend-unsafe devices as well as information about the board selected during DR operations. For dr(1M), this information is accessible by using the drshow(1M)command. From Hostview, this information is available by clicking the cpu, memory, device, obp, and unsafe buttons in the attach or detach windows.
Note -
You should view and use the domain information before you attempt to drain the memory on the board.
The informational content is the same for both dr(1M) and Hostview. Note that the cpu, memory, and device displays are only enabled when the board is attached to the operating environment. When the cpu, memory, and device displays are available, they always contain accurate information. The obp display shows the information known to OBP, but it is not as detailed as the other three displays. This section shows how to use the displays.
To View Domain Information with Hostview
-
Click on any of the System Info buttons during the DR operation.
Figure 2-6 System Information Buttons

When you click any of these buttons, a window is displayed, and it remains open until you click the dismiss button within that window.
If you click the All button, all of the currently enabled windows are displayed.
To Specify How Windows Are Updated
-
Click the Properties button in the Dynamic Reconfiguration window.
Figure 2-7 DR Properties Window

-
To cause displays to be updated, set Auto Update Domain Information Displays to On (the default).
-
Set the Update Interval to a value (in seconds) to determine how often updates occur.
If you set Auto Update Domain Information Displays to Off, the displays are not updated; each display is a snapshot taken at the time the button was pressed.
-
Click the Save button to save the settings between Hostview invocations.
Note -When the update interval is set to a low value, such as 10 seconds, and several information windows are displayed, responsiveness of the DR windows may be degraded. This is especially true when device detail windows are displayed. Each time an information window is updated, an RPC is issued to the dr_daemon(1M) running on the domain. The dr_daemon is an iterative RPC server, so each RPC request is run sequentially.
To View DR CPU Configuration Information
-
Click the cpu button.
Figure 2-8 DR CPU Configuration Window
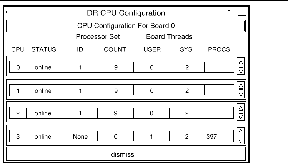
The DR CPU Configuration window is displayed.
The DR CPU Configuration window shows specific information about each processor on the selected board.
Table 2-2 DR CPU Configuration Information|
Heading |
Description |
|---|---|
|
CPU ID |
Displays the ID number of the selected board. |
|
STATUS |
Displays the status of the selected board (that is, whether the board is online or offline. |
|
Processor Set |
ID - Displays the ID number of the processor set to which the processor belongs. If the processor belongs to the default set, the word none appears in the box. COUNT - Displays the number of CPUs in the processor set. |
|
Bound Threads |
Displays the number of user and system bound threads and the process IDs of the bound threads. Some operating system device drivers may bind threads to processors to provide better servicing of a device. Threads may be bound to a processor by use of the pbind(1M) command. |
|
PROCS |
Displays the process IDs of the user processes that are bound to a CPU. |
To View DR Memory Configuration Information
-
Click the memory button.
The DR Memory Configuration window is displayed.
Figure 2-9 DR Memory Configuration Window
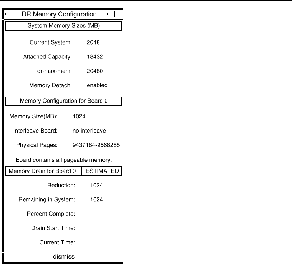
The DR Memory Configuration window is divided into three panels:
Table 2-3 DR Memory Configuration Information|
System Memory Sizes (Domain Memory Information) |
|
|
Total size of memory in the domain from all boards |
|
|
Amount of memory that can be added by using the DR attach operation |
|
|
Current value of the OBP variable dr-max-mem (for more information, refer to "dr-max-mem Variable" in the Sun Enterprise 10000 DR Configuration Guide) |
|
|
|
|
|
Memory Configuration for Board 0 (Board-Level Information) |
|
|
Memory Size (MB) |
Amount of memory on the selected board |
|
Interleave Board |
Board that the selected board is interleaved with |
|
Physical Pages |
Highest and lowest physical pages that are occupied by the memory on this board (Small memory areas in the middle of this range may not be used by this board. Note that DR is not able to detach boards that have interleaved memory.) |
|
|
|
|
Status/State (the display depends on the status/state of the operation) |
|
|
Unavailable |
A suitable target memory area is not currently available. |
|
Estimated |
The estimated values are displayed prior to starting the drain operation. The values displayed reflect the memory configuration that would result if the drain operation were started at this point. Note that the estimated values may differ from the in-progress values depending on the domain memory usage at the time drain was started. |
|
In Progress |
The drain operation is in progress. |
|
Complete |
The drain operation is finished. |
|
|
|
|
Memory Drain Information |
|
|
Amount of memory to be removed from domain usage when the board is detached |
|
|
Domain memory size after the board is detached |
|
|
How far the drain operation has progressed. Note that the time required to drain each memory page is not constant. Some memory pages take longer to drain than others. |
|
|
Drain Start Time |
The time the drain operation was started. |
|
Current Time |
The current time, which can be compared to the drain start time to see how long the drain operation has been in progress. |
To View DR Device Configuration Information
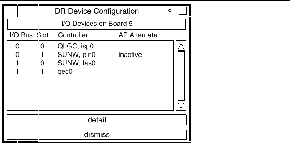
The controllers or devices in each slot are listed. The controller and device names are a concatenation of their device name and their operating environment instance number (for example, sd31).
Note -
The DR Device Configuration window may not show all of the devices that are physically present on the board. For example, controllers whose drivers are unattached do not appear in the list. The device display that is available by using the obp button lists the cards on the board that were successfully probed and identified.
To View DR Device Detailed Information
-
Highlight one or more controller(s).
-
Choose Detail.
The following window is displayed for each selected controller.
Figure 2-11 DR Detail Device Window
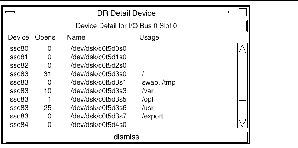
The current usage information for each device is shown. The window includes an open count (if available) and the common name (for example, a disk partition, a metadevice, or an interface name) by which the device is known. Additional usage information is also provided, including the partition mount points, network interface configuration, swap space usage, and metadevice usage.
Note -Some device usage, such as disk partitions used for Sun Solstice DiskSuite databases, Alternate Pathing databases, and Sun Enterprise Volume Manager usage, may not be reported.
If a controller or network interface is part of the AP database, the window indicates that it is active or that it is an AP alternate. For active AP alternates, the usage of the AP metadevice is displayed.
To View DR OBP Configuration Information
Note -
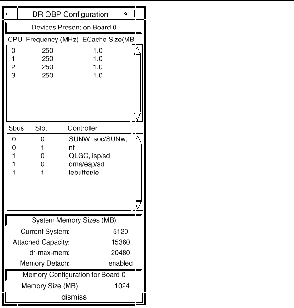
The information in the DR OBP Configuration window is derived from the OBP device tree, and is less detailed than the information that is available from the other windows described in this section. For example, in the init attach state, only the I/O adapters are known--not the devices attached to those controllers nor the memory interleave configuration. This window is usually used when a board is in the init attach state.
-
Click the obp button.
The DR OBP Configuration window is displayed.
Figure 2-12 DR OBP Configuration Window
To View the DR-Unsafe Devices
-
Click the unsafe button.
The DR Unsafe Devices window is displayed.
Figure 2-13 DR Unsafe Devices Window
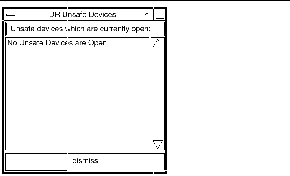
The DR Unsafe Devices window shows the suspend-unsafe devices that are open across the entire domain, not just those that are resident on the selected system board. This information is useful for determining the cause of operating environment quiescence errors due to unsafe devices being open.
- © 2010, Oracle Corporation and/or its affiliates

