| C H A P T E R 5 |
|
The Performance Analyzer Graphical User Interface |
The Performance Analyzer analyzes the program performance data that is collected by the Sampling Collector. This chapter provides a brief description of the Performance Analyzer GUI, its capabilities, and how to use it. The online help system of the Performance Analyzer provides information on new features, the GUI displays, how to use the GUI, interpreting performance data, finding performance problems, troubleshooting, a quick reference, keyboard shortcuts and mnemonics, and a tutorial.
This chapter covers the following topics.
For an introduction to the Performance Analyzer in tutorial format, see .
For a more detailed description of how the Performance Analyzer analyzes data and relates it to program structure, see Chapter 7.
|
Note - The Performance Analyzer GUI and the IDE are part of the Forte |
The Performance Analyzer can be started from the command line or from the integrated development environment (IDE).
To start the Performance Analyzer from the IDE, do one of the following:
 Choose Debug
  Performance Toolkit
  Run Analyzer from the menu bar.
This option automatically loads the most recent experiment that was collected.
 Double-click an experiment in the Filesystems tab of the Explorer.
To start the Performance Analyzer from the command line, use the analyzer(1) command. The syntax of the analyzer command is shown here.
% analyzer [-h] [-j jvm-path] [-J jvm-options] [-u] [-V] [-v] [experiment-list] |
Here, experiment-list is a list of experiment names or experiment group names. See for information on experiment names. If you omit the experiment name, the Open Experiment dialog box is displayed when the Performance Analyzer starts. If you give more than one experiment name, the data for all experiments are added in the Performance Analyzer.
The options for the analyzer command are described in TABLE 5-1.
To exit the Performance Analyzer, choose File  Exit.
Exit.
The Performance Analyzer window contains a menu bar, a tool bar, and a split pane for data display. Each pane of the split pane contains several tab panes that are used for the displays of the Performance Analyzer. The Performance Analyzer window is shown in FIGURE 5-1.
The menu bar contains a File menu, a View menu, a Timeline menu and a Help menu. In the center of the menu bar, the selected function or load object is displayed in a text box. This function or load object can be selected from any of the tabs that display information for functions. From the File menu you can open new Performance Analyzer windows that use the same experiment data. From each window, whether new or the original, you can close the window or close all windows.
The toolbar contains buttons that open the Set Data Presentation dialog box, the Filter Data dialog box, and the Show/Hide Functions dialog box. These dialog boxes can also be opened from the View menu. The toolbar also contains a Find tool. The button icons are shown below, in the order given.
The following subsections describe what is displayed in each of the tabs.
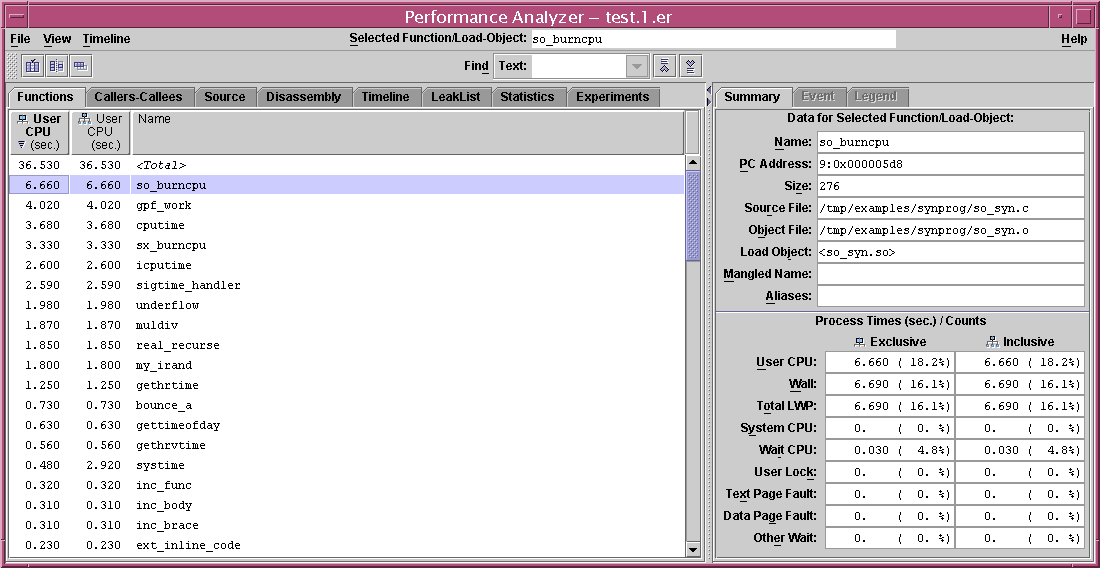
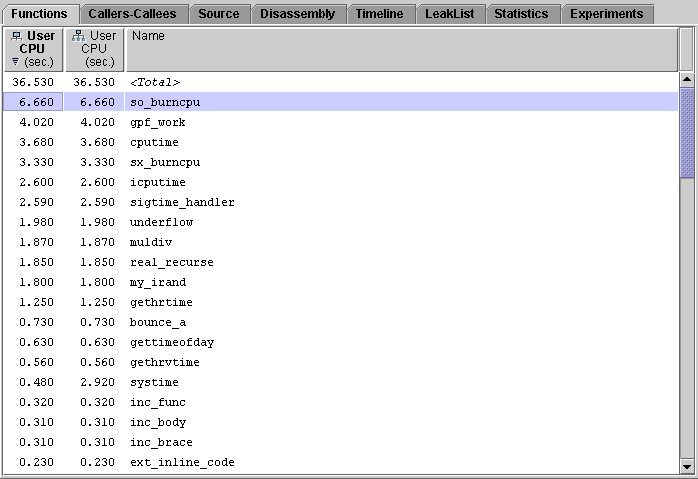
The Functions tab shows a list of functions and load objects and their metrics. Only the functions that have non-zero metrics are listed. The term functions includes Fortran subroutines, C++ methods and Java methods. Java methods that were compiled with the Java HotSpot
 virtual machine are listed in the Functions tab, but Java interpreted methods are not listed.
The Functions tab can display inclusive metrics and exclusive metrics. The metrics initially shown are based on the data collected and on the default settings. The function list is sorted by the data in one of the columns. This allows you to easily identify which functions have high metric values. The sort column header text is displayed in bold face and a triangle appears in the lower left corner of the column header. Changing the sort metric in the Functions tab changes the sort metric in the Callers-Callees tab unless the sort metric in the Callers-Callees tab is an attributed metric.
 [ D ]
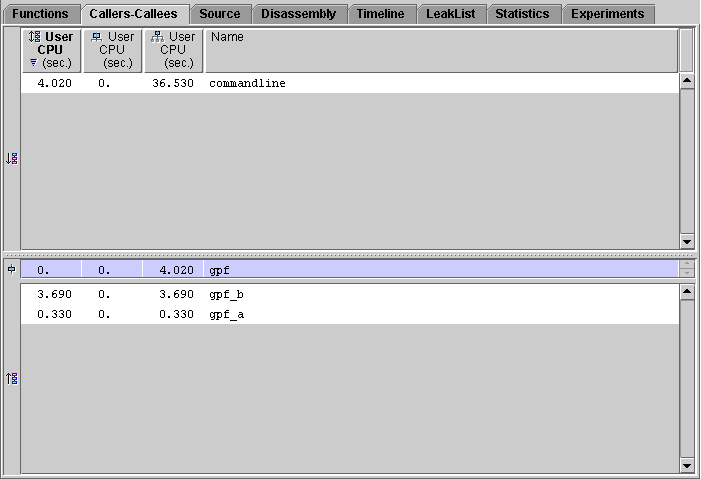
[ D ]The Callers-Callees tab shows the selected function in a pane in the center, with callers of that function in a pane above it, and callees of that function in a pane below it. Functions that appear in the Functions tab can appear in the Callers-Callees tab.
In addition to showing exclusive and inclusive metric values for each function, the tab also shows attributed metrics. If either an inclusive or an exclusive metric is shown, the corresponding attributed metric is also shown. The default metrics shown are derived from the metrics shown in the Function List display.
The percentages given for attributed metrics are the percentages that the attributed metrics contribute to the selected function's inclusive metric. For exclusive and inclusive metrics, the percentages are percentages of the total program metrics.
You can navigate through the structure of your program, searching for high metric values, by selecting a function from the callers or the callees pane. Whenever a new function is selected in any tab, the Callers-Callees tab is updated to center it on the selected function.
The callers list and the callees list are sorted by the data in one of the columns. This allows you to easily identify which functions have high metric values. The sort column header text is displayed in bold face. Changing the sort metric in the Callers-Callees tab changes the sort metric in the Functions tab.
 [ D ]
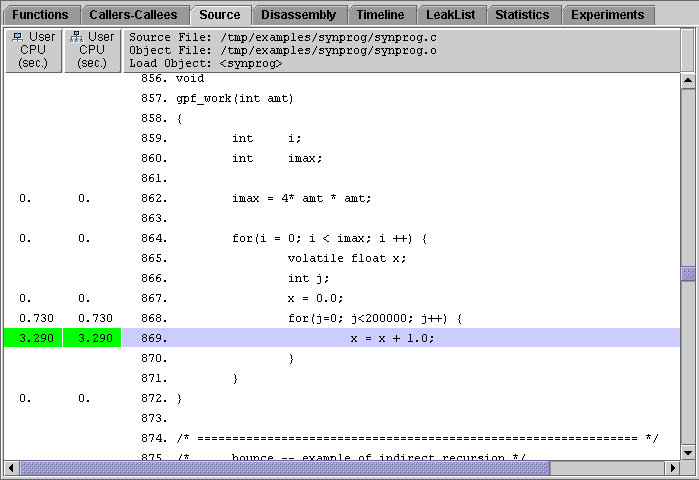
[ D ]The Source tab shows the source file that contains the selected function. Each line in the source file for which instructions have been generated is annotated with performance metrics. If compiler commentary is available, it appears above the source line to which it refers.
Lines with high metric values have the metrics highlighted. A high metric value is one that exceeds a threshold percentage of the maximum value of that metric on any line in the file. The entry point for the function you selected is also highlighted.
The choice of performance metrics, compiler commentary and highlighting can be changed in the Set Data Presentation dialog box.
You can view annotated source code for a C or C++ function that was dynamically compiled if you provide information on the function using the collector API, but you only see non-zero metrics for the selected function, even if there are more functions in the source file. You cannot see annotated source code for any Java methods, whether compiled by the Java HotSpot virtual machine or not.
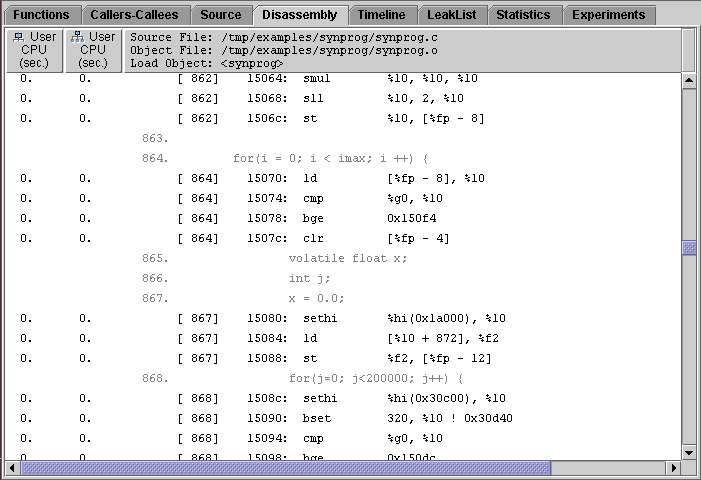
The Disassembly tab shows a disassembly listing for the object file that contains the selected function, annotated with performance metrics for each instruction. The instructions can also be displayed in hexadecimal.
If the source code is available it is inserted into the listing. Each source line is placed above the first instruction that it generates. Source lines can appear in blocks when compiler optimizations of the code rearrange the order of the instructions. If compiler commentary is available it is inserted with the source code. The source code can also be annotated with performance metrics.
Lines with high metric values have the metric highlighted. A high metric value is one that exceeds a threshold percentage of the maximum value of that metric on any line in the file.
The choice of performance metrics, compiler commentary, highlighting threshold, source annotation and hexadecimal display can be changed in the Set Data Presentation dialog box.
If the selected function was dynamically compiled, you only see instructions for that function. If you provided information on the function using the Collector API (see ), you only see non-zero source metrics for the specified function, even if there are more functions in the source file. You can see instructions for Java compiled methods without using the Collector API.
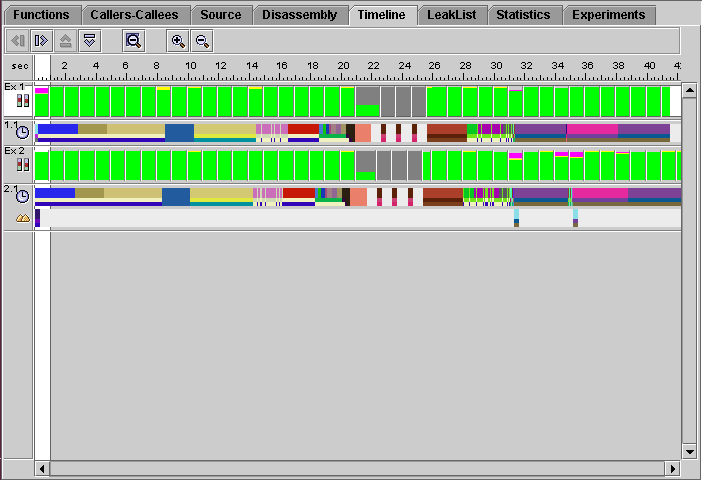
The Timeline tab shows a chart of events as a function of time. The event and sample data for each experiment and each LWP is displayed separately, rather than being aggregated. The Timeline display allows you to examine individual events recorded by the Sampling Collector.
Data is displayed in horizontal bars. The display for each experiment consists of a number of bars. By default, the top bar shows sample information, and is followed by a set of bars for each LWP, one bar for each data type (clock-based profiling, hardware counter profiling, synchronization tracing, heap tracing), showing the events recorded. The bar label for each data type contains an icon that identifies the data type and a number in the format n.m that identifies the experiment (n) and the LWP (m). LWPs that are created in multithreaded programs to execute system threads are not displayed in the Timeline tab, but their numbering is included in the LWP index. See Parallel Execution and Compiler-Generated Body Functions for more information.
The sample bar shows a color-coded representation of the process times, which are aggregated in the same way as the timing metrics. Each sample is represented by a rectangle, colored according to the proportion of time spent in each microstate. Clicking a sample displays the data for that sample in the Event tab. When you click a sample, the Legend and Summary tabs are dimmed.
 [ D ]
[ D ]
The event markers in the other bars consist of a color-coded representation of part of the call stack starting from the leaf function, which is shown at the top of the marker. Clicking a colored rectangle in an event marker selects the corresponding function from the call stack and displays the data for that event and that function in the Event tab. The selected function is highlighted in both the Event tab and the Legend tab and its name is displayed in the menu bar.
Selecting the Timeline tab enables the Event tab, which shows details of a selected event. The Event tab is displayed by default in the right pane when the Timeline tab is selected. Selecting an event marker in the Timeline tab enables and displays the Legend tab, which is in the right pane, and which shows color-coding information for functions.
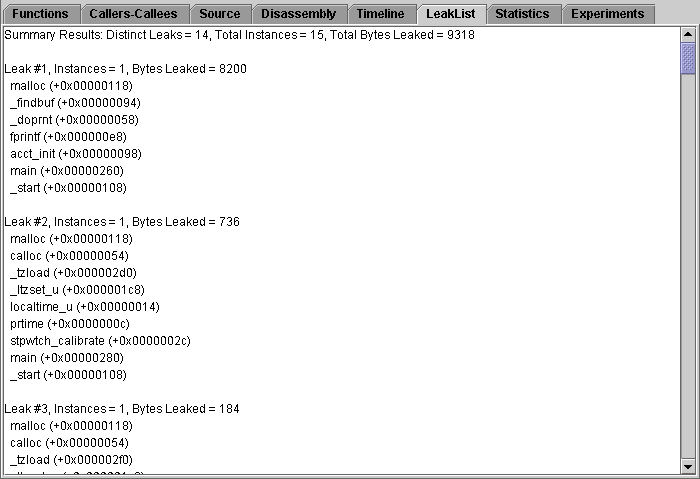
The LeakList tab shows a list of all the leaks and allocations that occurred in the program. Each leak entry includes the number of bytes leaked and the call stack for the allocation. Each allocation entry includes the number of bytes allocated and the call stack for the allocation.
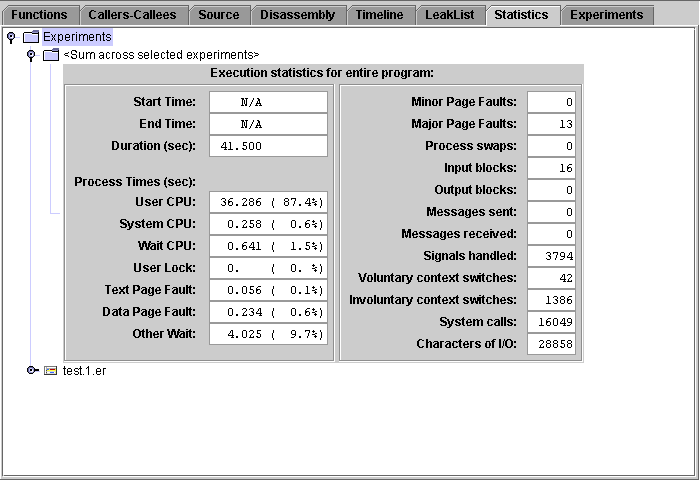
The Statistics tab shows totals for various system statistics summed over the selected experiments and samples, followed by the statistics for the selected samples of each experiment. The process times are summed over the microaccounting states in the same way that metrics are summed. See for more information.
The statistics displayed in the Statistics tab should in general match the timing metrics displayed for the <Total> function in the Functions tab. The values displayed in the Statistics tab are more accurate than the microstate accounting values for <Total>. But in addition, the values displayed in the Statistics tab include other contributions that account for the difference between the timing metric values for <Total> and the timing values in the Statistics tab. These contributions come from the following sources:
For information on the definitions and meanings of the execution statistics that are presented, see the getrusage(3C) and proc(4) man pages.
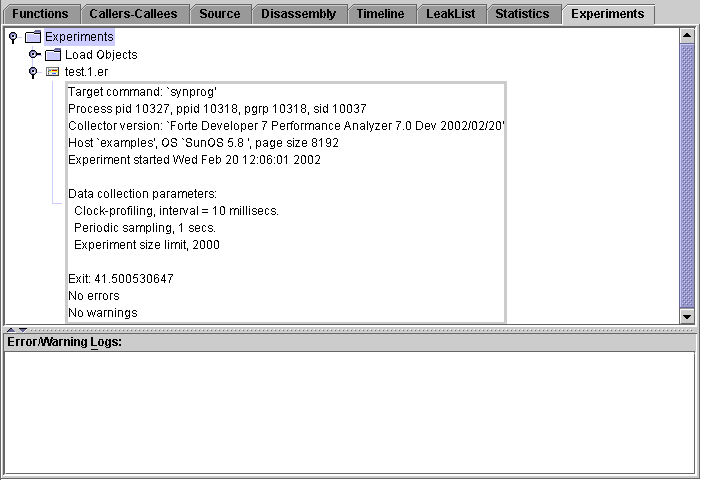
The Experiments tab is divided into two panes.
The top pane contains a tree that shows information on the experiments collected and on the load objects accessed by the collection target. The information includes any error messages or warning messages generated during the processing of the experiment or the load objects.
The bottom pane lists error and warning messages from the Performance Analyzer session.
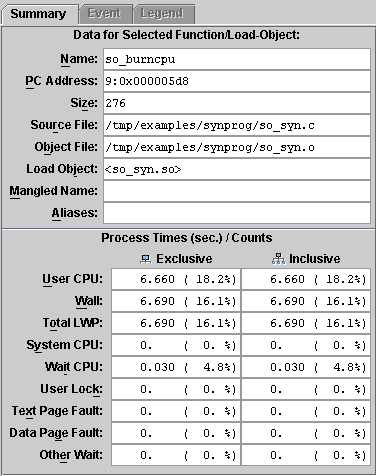
The top section of the Summary tab shows information on the selected function or load object. This information includes the name, address and size of the function or load object, and for functions, the name of the source file, object file and load object. The bottom section of the Summary tab shows all the recorded metrics for the selected function or load object, both exclusive and inclusive, and as values and percentages. The information in the Summary tab is not affected by metric selection.
The Summary tab is updated whenever a new function or load object is selected.
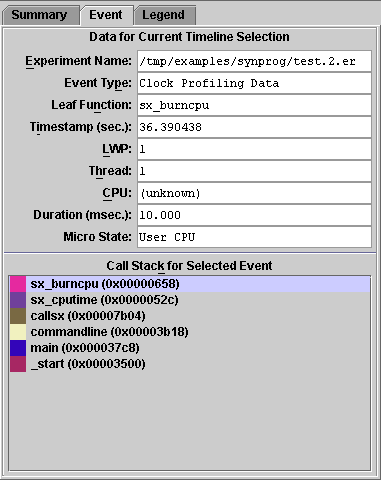
The Event tab shows the available data for the selected event, including the event type, leaf function, LWP ID, thread ID and CPU ID. Below the data panel the call stack is displayed with the color coding that is used in the event markers for each function in the stack. Clicking a function in the call stack makes it the selected function.
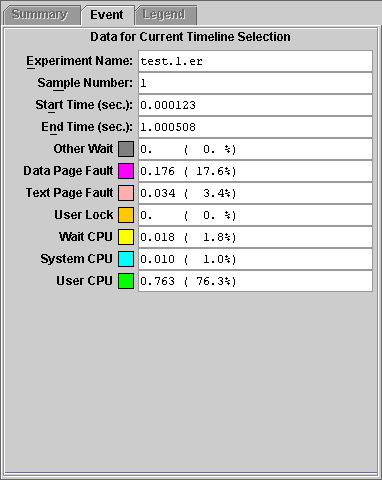
When a sample is selected, the Event tab shows the sample number, the start and end time of the sample, and a list of timing metrics. For each timing metric the amount of time spent and the color coding is shown. The timing information in a sample is more accurate than the timing information recorded in clock profiling.
This tab is only available when the Timeline tab is selected in the left pane.
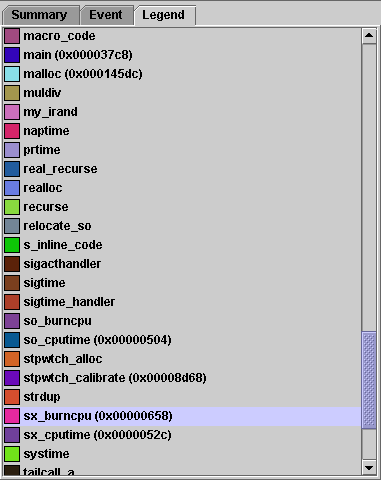
The Legend tab shows the mapping of colors to functions for the display of events in the Timeline tab. The Legend tab is only enabled when an event is selected in the Timeline tab. It is dimmed when a sample is selected in the Timeline tab. The color coding can be changed using the color chooser in the Timeline menu.
This section describes some of the capabilities of the Performance Analyzer and how its displays can be configured.
The Performance Analyzer computes a single set of performance metrics for the data that is loaded. The data can come from a single experiment, from a predefined experiment group or from several experiments.
To compare two selections of metrics from the same set, you can open a new Analyzer window by choosing File  Open New Window from the menu bar. To dismiss this window, choose File
  Close from the menu bar in the new window.
To compute and display more than one set of metrics--if you want to compare two experiments, for example--you must start an instance of the Performance Analyzer for each set.
The Performance Analyzer allows you to compute metrics for a single experiment, from a predefined experiment group or from several experiments. This section tells you how to load, add and drop experiments from the Performance Analyzer.
Opening an Experiment. Opening an experiment clears all experiment data from the Performance Analyzer and reads in a new set of data. (It has no effect on the experiments as stored on disk.)
Adding an Experiment. Adding an experiment to the Performance Analyzer reads a set of data into a new storage location in the Performance Analyzer and recomputes all the metrics. The data for each experiment is stored separately, but the metrics displayed are the combined metrics for all experiments. This capability is useful when you have to record data for the same program in separate runs--for example, if you want timing data and hardware counter data for the same program.
To examine the data collected from an MPI run, open one experiment in the Performance Analyzer, then add the others, so you can see the data for all the MPI processes in aggregate. If you have defined an experiment group, loading the experiment group has the same effect.
Dropping an Experiment. Dropping an experiment clears the data for that experiment from the Performance Analyzer, and recomputes the metrics. (It has no effect on the experiment files.)
If you have loaded an experiment group, you can only drop individual experiments, not the whole group.
Once you have experiment data loaded into the Performance Analyzer, there are various ways you can select what is displayed.
Selecting metrics. You can select the metrics that are displayed and the sort metric using the Metrics and Sort tabs of the Set Data Presentation dialog box. The choice of metrics applies to all tabs. The Callers-Callees tab adds attributed metrics for any metric that is chosen for display. The Set Data Presentation dialog box can be opened using the following toolbar button:
All metrics are available as either a time in seconds or a count, and as a percentage of the total program metric. Hardware counter metrics for which the count is in cycles are available as a time, a count, and a percentage.
Configuring the Source and Disassembly tabs. You can select the threshold for highlighting high metric values, select the classes of compiler commentary and choose whether to display metrics on annotated source code and whether to display the hexadecimal code for the instructions in the annotated disassembly listing from the Source/Disassembly tab of the Set Data Presentation dialog box.
Filtering by Experiment, Sample, Thread and LWP. You can control the information in the Performance Analyzer displays by specifying only certain experiments, samples, threads, and LWPs for which to display metrics. You make the selection using the Filter Data dialog box. Selection by thread and by sample does not apply to the Timeline display. The Filter Data dialog box can be opened using the following toolbar button:
Showing and Hiding Functions. For each load object, you can choose whether to show metrics for each function separately or to show metrics for the load object as a whole, using the Show/Hide Functions dialog box. The Show/Hide Functions dialog box can be opened using the following toolbar button:
The settings for all the data displays are initially determined by a defaults file, which you can edit to set your own defaults.
The default metrics are read from a defaults file. In the absence of any user defaults files, the system defaults file is read. A defaults file can be stored in a user's home directory, where it will be read each time the Performance Analyzer is started, or in any other directory, where it will be read when the Performance Analyzer is started from that directory. The user defaults files, which must be named .er.rc, can contain selected er_print commands. See Defaults Commands for more details. The selection of metrics to be displayed, the order of the metrics and the sort metric can be specified in the defaults file. The following table summarizes the system default settings for metrics.
For each function or load-object metric displayed, the system defaults select a value in seconds or in counts, depending on the metric. The lines of the display are sorted by the first metric in the default list.
For C++ programs, you can display the long or the short form of a function name. The default is long. This choice can also be set up in the defaults file.
You can save any settings you make in the Set Data Presentation dialog box in a defaults file.
See Defaults Commands for more information about defaults files and the commands that you can use in them.
Find tool. The Performance Analyzer includes a Find tool in the toolbar that you can use to locate text in the Name column of the Functions tab and the Callers-Callees tab, and in the code column of the Source tab and the Disassembly tab. You can also use the Find tool to locate a high metric value in the Source tab and the Disassembly tab. High metric values are highlighted if they exceed a given threshold of the maximum value in a source file. See Selecting the Data to Be Displayed for information on selecting the highlighting threshold.
Using the performance data from an experiment, the Performance Analyzer can generate a mapfile that you can use with the static linker (ld) to create an executable with a smaller working-set size, more effective instruction cache behavior, or both. The mapfile provides the linker with an order in which it loads the functions.
To create the mapfile, you must compile your program with the -g option or the -xF option. Both of these options ensure that the required symbol table information is inserted into the object files.
The order of the functions in the mapfile is determined by the metric sort order. If you want to use a particular metric to order the functions, you must collect the corresponding performance data. Choose the metric carefully: the default metric is not always the best choice, and if you record heap tracing data, the default metric is likely to be a very poor choice.
To use the mapfile to reorder your program, you must ensure that your program is compiled using the -xF option, which causes the compiler to generate functions that can be relocated independently, and link your program with the -M option.
Copyright © 2002, Sun Microsystems, Inc. All rights reserved.