 |
Execution Time
There are three central actions related to development of particular objects within the Forte IDE; deploy, execute, and debug.
For the iPlanet Web Server, the deploy action can be used upon WebModules. Deployment can be done first or at execution time. When done first, a context is established with the IDE by which an associated executable component, such as a servlet, JSP, or web module can then be exercised.
Upon execution, the following events occur:
The corresponding web page is the concatenation of the following:

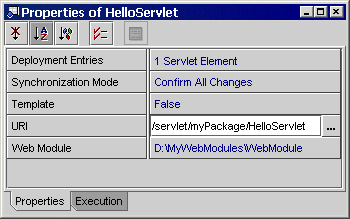
In this example, we would have: http://machinename:portnumber/WebModule/servlet/myPackage/HelloServlet
Debugging
You can use the Forte debugger tool to locate and correct bugs in your program. This tool can be used on servlets; JSP debugging is not supported with iPlanet Web Server 6.0.
| NOTE: Debugging is not supported on Solaris due to a limitation with J2EE 1.2.2. |
When you execute a program with the debugger tool, you can start execution at any servlet. The program stops executing at set breakpoints in the servlet and you can interactively inspect and debug sections of code. To run the debugger tool, designate the entry point into your program by selecting a servlet from the Explorer Filesystems tab, then from the Debug menu select Start.
This action will:
You can add watches, analyse the threads, etc in the Debugger Window (Menu View--->Debugger Window)
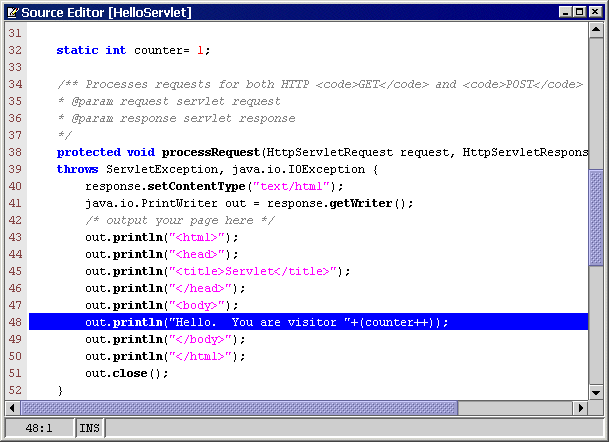
For this example, we will set a debug breakpoint. This debug example uses the HelloServlet servlet that we created in Creating Servlets in this tutorial.

The line appears highlighted in red indicating the location is set with a breakpoint.
Once the debugger is running, the line with the breakpoint is highlighted in blue.
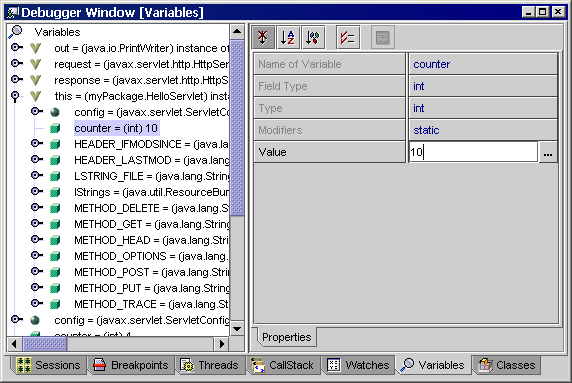
 Continue to finish executing your servlet.
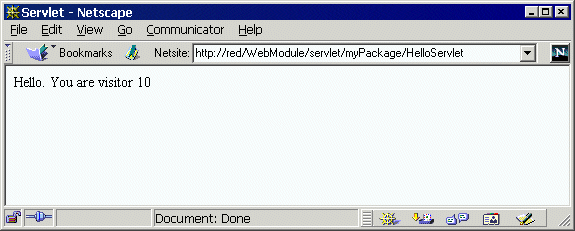
The resulting servlet is displayed in the web browser. Notice that the counter variable now appears as 10.
The Finish Debugging window appears.
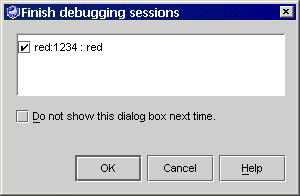
Congratulations, you have successfully debugged your servlet on a web server and completed the iPlanet Web Server Integration Module Tutorial.
| See also | |
|---|---|
| Creating Servlets Setting the Debugging Port |
|
| © 2002 Sun Microsystems, Inc. | terms of use privacy policy feedback |