As your enterprise's NAS deployer, you have the responsibility of understanding your system and all its elements, including the applications you develop. Your system consists of a variety of elements, including the operating system, the network, web servers, back-end data sources, NAS servers, and your applications. The weakest link in this group will always be the bottleneck, so you need to pay attention to all of them when trying to improve capacity. You start by assessing the system's overall capacity and then identify where performance is being compromised.
This section explains how to assess overall system capacity by describing in detail the concepts of maximum number of concurrent users, peak load and peak capacity, steady state, response time, and requests per minute.
Defining Maximum Number of Concurrent Users
To better understand capacity, determine the maximum number of concurrent users that your system can handle before performance starts to decline. A user constitutes one running web-browser process that periodically sends requests from a client machine via a web server to NAS. A user is "concurrent" for as long as he or she is on the system as a running web-browser process submitting requests, receiving results of requests from the server, and viewing the results of the requests.
In the following diagram, think of the horizontal line (points x to y) as system activity. A single user is a concurrent user from point A until point E. From points A to B the user's request is being processed by the system.
From points B to C the user is in think time mode, viewing the results of the request and deciding what action to take next. Realistically, a user does not submit requests continuously. A user submits a request, the server receives the request, processes it and then returns a result, at which point the user spends some time analyzing the result before submitting a new request. This time spent reviewing the result of a request is called "think time." The user is not performing any actions against the server, and thus a request is not being generated during think time. However, when you calculate the number of concurrent users, you include think time in the equation.
From points C to D, the system is again processing the request, with D being the point at which the result is returned to the user. From points D to E, the user is again in think time mode. At point E, the user exits the system, after which he or she is no longer a concurrent user.
 Determining typical think time length is important because you can use it to calculate more accurately the number of requests per minute and the number of concurrent users your system can support. Essentially, when a user is on the system but not submitting a request, a gap opens for another user to submit a request without altering system load. This also means that you can support more concurrent users.
Eventually, in the course of system activity, as the number of concurrent users submitting requests increases, requests processed per minute begin to decline. The following diagram illustrates this situation:
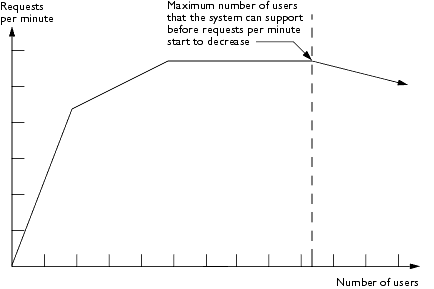 You want to identify the point at which adding more concurrent users reduces the number of requests that can be processed per minute, as this indicates when performance starts to degrade.
Defining Peak Load and Peak Capacity
Peak load refers to the maximum number of concurrent users and requests per minute that you expect the system to support, based on the pattern of activity that typically exists on your system. You may want your system to support a certain number of requests with a certain response time per request. This doesn't mean that your system can in fact handle this load: it might be able to handle the number of users, but only by processing their requests at a slower rate.
If you decide you want your system to handle the maximum number of concurrent users that typically access the system and submit requests, you may have to add server resources to achieve the desired response time. You may, instead, decide to use another design point, steady state load, which is explained on page 61. Whether you choose peak load or steady state load as your system capacity design point depends on several factors, including acceptable response time, all of which are described later in this chapter.
Peak capacity refers to the maximum number of concurrent users that the system can realistically sustain before requests per minute start to decline and response time starts to increase. Peak capacity may be more or less than peak load, and knowing the difference is critical to planning your system. You may find out at first that your system cannot handle the peak load. However, if you use peak load as a design point, you can do things to adjust aspects of your system and bring peak capacity to a level that is acceptable for your enterprise.
In any system, as the number of concurrent users rises, so does the number of requests per minute (or per second). Then, at a certain point, although more users are concurrently on the system submitting requests, the number of requests per minute starts to level off and remain constant, as the following diagram illustrates:
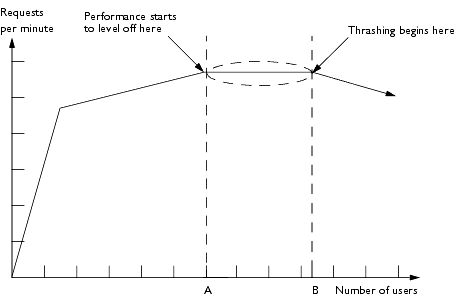 Point A represents the maximum number of concurrent users the system can handle before requests per minute start to level off. Point B represents peak capacity—the maximum number of users the system can support before performance starts to degrade. (Note that peak load is not represented in the diagram because it is not a function of the NAS performance curve, but rather a value defined by your system requirements.) Eventually, requests per minute start to decline, even though the number of concurrent users continues to rise. As the diagram above illustrates, this results in multiple users on the system but fewer requests being processed, a situation referred to as "thrashing." Thrashing occurs when the system is spending more time and resources managing queues and loads than actually processing requests.
Defining Steady State
Steady state refers to the point at which the system reaches and maintains steady capacity, or a steady number of requests per minute, while the number of concurrent users continues to increase. In steady-state mode, your system is not processing at peak capacity; it is maintaining a steady capacity and continues to maintain this capacity, even as the number of concurrent users on the system rises.
In the ideal system, capacity levels off with a relatively low number of users, meaning that the system can handle a large number of requests submitted by a small number of users. The system's efficiency is further demonstrated by this large volume of requests per minute remaining at a steady state despite a continued increase in the number of concurrent users.
Here is how the ideal system looks graphically.
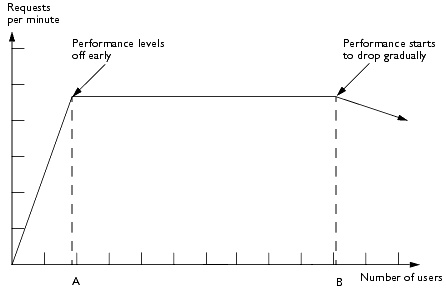 There is an initial steep slope upward in the number of requests per minute on the y-axis, to point A number of users on the x-axis. The distance and angle from point A to point B represents steady state: a steady increase in the number of concurrent users, without any change in the number of requests per minute. At point B, which represents peak capacity, 100 percent of system resources are being used, and any additional concurrent users causes requests per minute to decline. Ideally, when thrashing finally does occur at point B, the point at which system resources begin to be less efficient due to the number of users, the decline in requests per minute is gradual, as opposed to steep. Again, this graceful degradation in requests per minute indicates an efficient system: requests per minute decline slowly despite the continued increase in the number of concurrent users. Note that you should not design for any points past point B, as this represents an area of performance beyond capacity limits in which the system may react in an unpredictable manner.
Another way of analyzing steady state is in terms of response time, as you can see in the next graph.
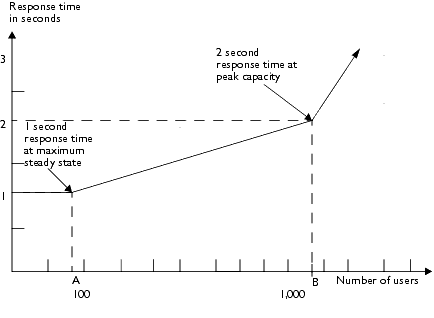 During steady state, despite the added load of concurrent users, response time remains constant. For example, assume that the diagram represents a system in which steady state typically ranges from 0 to 100 concurrent users. Response time remains steady, despite the added load of users on the system. From point A to point B (1000 users), response time increases gradually. But after point B, which represents peak capacity, response time rises more dramatically as peak load is reached.
Designing for Peak Load or Steady State
When deciding your capacity goals, look at two factors: peak load and steady state. If your design point is peak load, then you must deploy a system that can sustain the expected maximum load of users and requests without a degradation in response time. This means that your system can handle the extreme cases of expected system load.
If your design point is steady state, then you don't have to deploy a system with all the resources required to handle the sever's expected peak load, or even the peak capacity; however, a system designed to support up to steady state load will have slower response time when peak load occurs.
Importance of Response Time
Remember peak capacity may not be able to meet the demands of the desired peak load. However, even at peak capacity, the response time may be greater than the acceptable response time limit that you get at steady state. If 3 seconds is your limit or threshold, but the system at peak capacity processes requests at a response time greater than 3 seconds, then you must determine which areas of your system you'll adjust so as to reduce response time to the desired 3 second limit.
Frequency and Duration of Peak Load
Another issue that may affect whether or not you want to design for peak load or for steady state is how often your system is expected to handle the peak load. If peak load occurs several times a day or even per week, you may decide that this is enough time to warrant expanding the system's capacity to handle this load. If the system operates at steady state 90 percent of the time, and at peak only 10 percent of the time, then you may decide that you prefer deploying a system designed around steady state load. This means that 10 percent of the time your system's response time will be slower than the other 90 percent of the time. You decide if the frequency or duration of time that the system operates at peak justifies the need to add resources to your system, should this be required to handle peak load.
Determining Average Response Time
As explained in Chapter 2, "Planning Your Environment," response time refers to the amount of time it takes for request results to be returned to the user. This figure is affected by a number of factors, including network bandwidth, number of users, number and type of requests submitted, and average think time. In this section, response time refers to mean, or average, response time. Each type of request has its own minimal response time, but when evaluating system performance, analyze based on the average response time of all requests.
The faster the response time, the more requests per minute are being processed. However, as the number of users on your system increases, response time starts to increase as well, even though the number of requests per minute declines due to thrashing, as the following diagram illustrates:
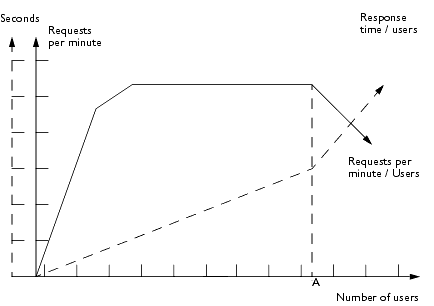 A system performance graph like the one above indicates that at peak capacity, requests per minute are inversely proportional to response time: the sharper the decline in requests per minute, the steeper the increase in response time (represented by the dotted line arrow).
You should always deploy with peak capacity in mind: determine the maximum number of concurrent users your system can support with an acceptable response time. In the above graph, point A represents peak capacity, the point at which requests per minute start to decline. Prior to this, response time calculations are not necessarily accurate because they aren't using peak numbers in the formula. After this point, because of the inversely proportional relationship between requests per minute and response time, you can more accurately calculate response time using the two criteria already discussed in this section: maximum number of users and requests per minute.
To determine response time at peak capacity, use the following formula:
Response time = (concurrent users / requests per minute) - think time
To obtain an accurate response time result, you must always include think time in the equation.
For example, if the following conditions exist:
Then, the calculation is as follows:
2 seconds response time = (5,000 users / 1,000 requests per second) - 3 seconds think time
After you have calculated your system's response time, particularly at peak capacity, decide what is an acceptable response time for your enterprise. Response time, along with throughput, is one of the factors critical to NAS performance and improving it should be one of your goals. If there is a response time beyond which you do not want to wait, and performance is such that you get response times over that level, then work towards improving your response time or redefine your response time threshold.
Determining Requests Per Minute
If you know the number of concurrent users at any given time and the response time of their requests and the average user think time at that time, you can determine server capacity, or requests per minute.
Typically, you start by knowing how many concurrent users are on your system. For example, after running some web site performance software, suppose you have calculated that the average number of concurrent users submitting requests on your online banking web site is 3,000. This is dependent on the number of users who have signed up to be members of your online bank, their banking transaction behavior, the times of the day or week they choose to submit requests, and so on. Therefore, knowing this information means you can use the requests per minute formula described in this section to calculate how many requests per minute your system can handle for this user base.
Then, because requests per minute and response time become inversely proportional at peak capacity, decide if fewer requests per minute are acceptable as a trade-off for better response time, or alternately, if a slower response time is acceptable as a trade-off for more requests per minute. Essentially, you start playing around with the requests per minute and response time thresholds that you will accept as a starting point for fine-tuning system performance. Then you decide which areas of your system you want to adjust.
The requests per second formula is as follows:
requests per second = concurrent users / (response time + think time)
For example, if the following conditions exists:
The calculation is as follows:
700 requests per second = 2,800 / (1+3)
700 requests per second translates to 42,000 requests per minute.
|