2 Using the Administration Console
This chapter contains:
About the Administration Console
The Administration Console is a Web browser-based application for configuring, managing, and monitoring the system. You display it by logging into a Database Firewall or Database Firewall Management Server from a Web browser.
The Administration Console provides access to the following variations of Oracle Database Firewall:
-
A Database Firewall Management Server: Manages one or more Database Firewalls.
-
A managed Database Firewall: A Database Firewall that has been configured to be managed by a Management Server.
-
A standalone Database Firewall: This is a Database Firewall that operates independently, that is, it is not managed by a Database Firewall. In most cases, you will configure it to be a managed Database Firewall.
For a full list of the tasks that you can perform with each of these variations, see Oracle Database Firewall Administration Guide.
As a user responsible for policy management, you will use the Administration Console to quickly find high level information about the database you must protect, generate and manage reports, and audit SQL database stored procedures and user roles. The Administration Console is also used by network or system administrators responsible for IT systems deployment, maintenance, and monitoring.
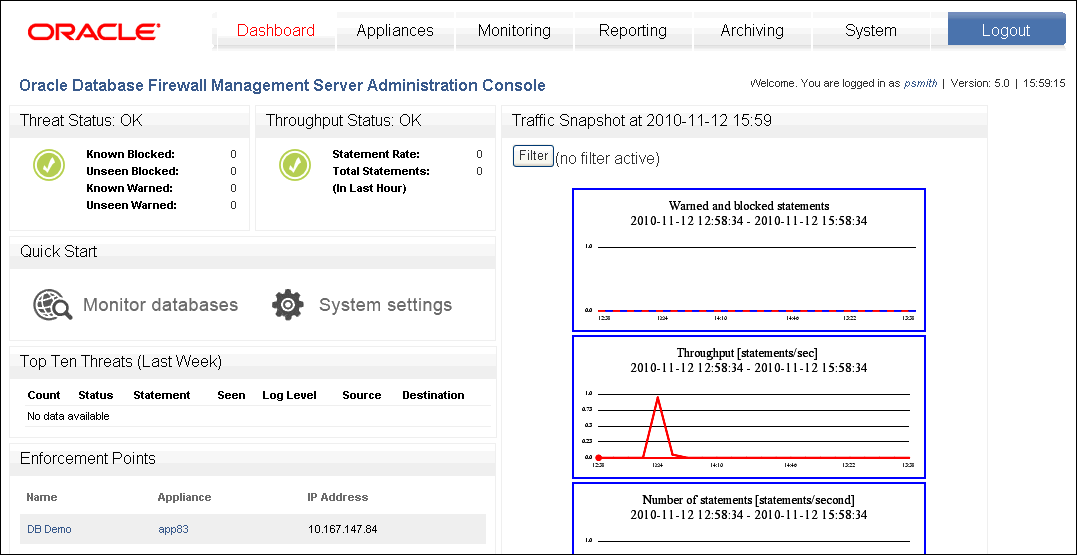
Figure 2-1 shows the Dashboard tab of the Management Server Administration Console.
Figure 2-1 The Management Server Administration Console: Dashboard Tab

Description of "Figure 2-1 The Management Server Administration Console: Dashboard Tab"
Accessing the Administration Console
This section contains:
Who Can Log in to the Administration Console
All users of the Administration Console must enter a valid login ID and password before access is granted. The following user roles are available:
-
System Administrator: This user controls the entire Database Firewall system. The default user
admin, created when you install Database Firewall, has this role. -
Log Administrator: This user is responsible for archiving the traffic logs.
-
View-only User: This user can run reports but cannot make changes to policies or other settings.
A user who has been granted the System Administrator role can use the Administration Console to create and manage user accounts with these roles. (Note that these user accounts are not stored in the database.)
Because the Administration Console is a browser-based application, you can use it from any computer that has a supported Web browser, although access can be restricted by IP address.
For better security and separation of duty, you should assign these roles to trusted users and only use the admin user account as a back-up account. See Oracle Database Administrator's Guide for more information about configuring users.
Logging in to the Administration Console
To log in to the Administration console:
-
Open a Web browser from any computer that has network access to Oracle Database Firewall.
-
Enter the following URL:
https://ip_address/user/loginProvide the IP address for the server on which Oracle Database Firewall is installed. For example:
https://192.0.2.206/user/login
If you change the user interface port number (by using the System Settings page of the Administration Console), then you must also include this port number in the URL. Use the following syntax:
https://ip_address:port/user/login
For example:
https://192.0.2.206:444/user/login
Add this address to your Favorites to make it easy to access.
See Oracle Database Firewall Administration Guide for information about changing the Administration Console port number.
-
If you are prompted to choose a digital certificate, click OK.
-
If you see a message claiming that there is a problem with the Web site security certificate, then click the Continue to this website link.
-
In the Login page, enter the user name and password for an account that has System Administrator privileges
-
Click Login.
Using the Dashboard
When you are connected to a Database Firewall Management Server, the Administration Console includes the Dashboard tab. (See Figure 2-1.) The Dashboard provides a high-level view of important information about the databases being protected, such as the threat status, throughput, and top ten threats. Charts display key indicators for viewing by IT and security managers responsible for day-to-day monitoring of the system.
The Dashboard also provides Quick Start options that allow you to set up the system configuration settings with ease.
Parts of the Dashboard
The Dashboard contains the following sections:
-
Threat Status: Provides statistics about the number of statements that have been blocked or caused a warning. Separate counts are provided for known and anomaly statements; unseen statements are those that match none of the clusters in the baseline policy.
-
Throughput Status: Gives the number of statements per second and the total number of statements in the last hour.
-
Quick Start: Provides wizards that help you to configure your system quickly and easily.
-
Top Ten Threats: Lists the most significant threats over the indicated period of time.
-
Enforcement Points: Gives details of the enforcement points configured in the Administration Console.
-
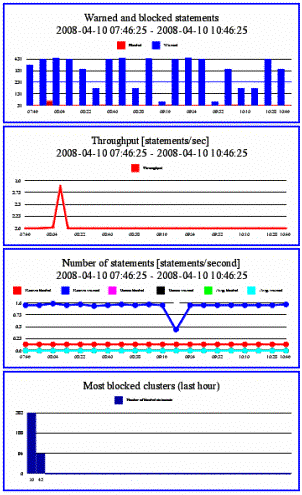
Traffic Snapshot: Provides statistics about the performance of Oracle Database Firewall and the actions it has taken. Security managers who are responsible for day-to-day monitoring of the system may want to view this information at frequent intervals. The following is an example.

Description of the illustration dashboard_sections.gif
These examples are described in order as follows:
-
Shows the number of SQL statements that were blocked or caused a warning over the last three hours. Clicking the chart zooms in.
-
Shows the number of SQL statements processed per second over the last three hours. Clicking the chart zooms in.
-
Shows by statement class, the number of SQL statements processed per second over the last three hours. Clicking the chart zooms in.
-
Shows the SQL cluster IDs that were most blocked in the last hour. Clicking the chart displays additional information.
Note:
When you zoom in, Oracle Database Firewall displays controls that enable you to zoom in further and navigate along the horizontal axis.A Filter button is provided, which you can use to filter the displayed information. If required, you can apply more than one filter. The operators are self-explanatory, except for the following:
>= (greater than or equal to) <= (less than or equal to) <> (not equal to)