3 Using Oracle Database Firewall Analyzer
This section contains:
Overview of the Oracle Database Firewall Analyzer
This section contains:
About the Analyzer
Oracle Database Firewall Analyzer enables you to design policies quickly and efficiently. Successful deployment of a Database Firewall system depends on an effective policy. Policy rules can depend on any combination of the SQL statement type, time of day, name of the database user, IP address of the database client, operating system user name, client program name, or any exceptions you specify.
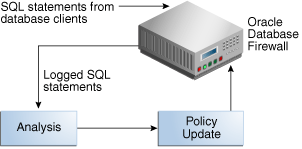
Developing a policy is an iterative process that keeps refining and improving the policy with new data.
Note:
The Oracle Database Firewall Analyzer has extensive Online Help available by pressing the F1 key.The Concept of Clustering SQL Statements in the Analyzer
Clustering is an important tool that the Analyzer uses to categorize the SQL statements it reads into sets of semantically similar statements called clusters.
The Analyzer further groups clusters into a cluster group if they have the same SQL grammar pattern. Figure 3-1 shows a cluster group of nine clusters that match the pattern select <column> from <table>.
Figure 3-1 Clustering into Semantically Similar Statements
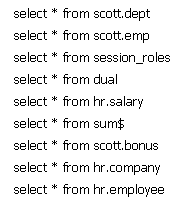
Description of "Figure 3-1 Clustering into Semantically Similar Statements"
When you develop a policy, you specify the actions that the Oracle Database Firewall should take for each cluster, rather than for each individual SQL statement.
The Process of Developing a Policy
Developing a policy consists of these main steps:
-
Create a model in the Analyzer to use for designing your policy. The model is created by training the Analyzer using log data from Database Firewall or by uploading a file of SQL statements. See "Creating a Model".
-
Analyze the data in the model. See "Viewing and Analyzing Data in the Model".
-
Design your policy by setting policy actions and rules. See "Designing the Policy".
-
Create a policy file in the Analyzer, upload this file into the Database Firewall, and select this policy in a configured Enforcement Point. See "Creating a Policy File and Uploading it into the Database Firewall".
-
Refine the policy with new data in the Analyzer. See "Improving and Refining the Policy with new Data"
Creating a Model
This section contains:
About Creating a Model
A model is a file that stores data needed to create a policy. You can supply data for a model by "training" the Analyzer in two ways:
-
Using traffic log data from the Database Firewall
-
Uploading a SQL statements file
You can create any number of models. Typically, you create different models for different databases or for different analyses of the same database.
Creating a new model results in two files, filename.smdl and filename.smdl_data. If you want to open a model in a different Analyzer installation, then you must copy both files to the computer that has the Analyzer software.
Supplying Data to Train the Analyzer
You can supply logged data or SQL statement files to the Analyzer in one of these ways:
-
Directly from the traffic log of the Management Server or a standalone Database Firewall: This is the recommended method of supplying log data.
Use the Management Server or standalone Database Firewall Administration Console to enable log unique policies while the system monitors normal day-to-day database traffic. See "Enabling Log Unique Policies to Provide Logging Data".
Log unique policies enable you to log statements for offline analysis that include each distinct source of SQL traffic. Be aware that if you apply this policy, even though it stores fewer statements than if you had chosen to log all statements, it can still use a significant amount of storage for the logged data.
Log unique policies log SQL traffic specifically for developing a new policy. The logged data enables the Analyzer to understand how client applications use the database and enables rapid development of a policy that reflects actual use of the database and its client applications.
-
From a Database Firewall train file: This is a text file generally written by a developer. It contains a list of SQL statements, one line for each statement. See the Online Help for the required syntax.
-
(Microsoft SQL Server Only) From a Server trace file: A binary log file created on Microsoft SQL Server. It contains a list of SQL statements.
The database that you are monitoring must be running, but you do not need to configure any additional settings for it, such as enabling auditing.
Enabling Log Unique Policies to Provide Logging Data
To enable log unique policies:
-
Log in to the standalone Database Firewall or Management Server Administration Console.
See "Logging in to the Administration Console" for more information.
-
In the Login page, enter the user name and password for the user who has been granted the System Administrator role. Then click Login.
-
Select the Monitoring tab.
-
From the Enforcement Points menu, select List.
This menu item should be selected by default.
-
In the Enforcement Points page, find the enforcement point for the database whose data you want to analyze and then select the Settings button.
-
In the Monitoring Settings page, scroll down to the Policy area.
-
In the Policy area, select the unique.dna option.
-
Click the Save button.
The new setting takes effect immediately.
Creating a New Model in the Analyzer
-
On your desktop, double-click the Oracle Database Firewall Analyzer icon.
If you have not previously selected Don't show this screen on startup, the Welcome to Oracle Database Firewall Analyzer page appears.
-
Do one of the following:
-
From the Welcome page, select Create a New Model from Training.
-
From the File menu, select New.
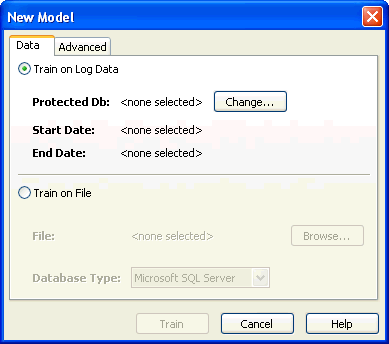
The New Model dialog box appears.
-
-
-
Train on Log Data - to provide training data from the Data Base Firewall traffic log. See "Creating a New Model from Training on Log Data".
-
Train on File - to upload a training file containing SQL statements. See "Creating a New Model from Training on a SQL Statement File".
-
Creating a New Model from Training on Log Data
To create a new model from training on logged data:
-
Follow the steps in "Creating a New Model in the Analyzer" and select Train on Log Data in Step 3.
-
Click Change.
-
In the Traffic Log Server dialog box, enter the IP address (and port number, if necessary), username, and password of the Oracle Database Firewall or Management Server system administrator, and then click OK.
-
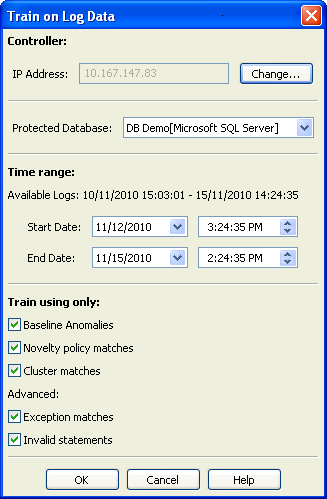
In the Train on Log Data dialog box, select the following:
-
In the Protected Database menu, select a named database to retrieve its data.
If your databases are all of the same type (for example, Oracle), you also have the option to select All Databases to retrieve data logged for all your databases. Choose All Databases only if you are intending to use the same policy for all of them.
Protected databases must be those set up by your System Administrator.
-
Specify the date range of the log data to read.
By the default, the end date is today's date.
-
Select the types of logged statements to import or all check boxes to import all statements. Press F1 to see Online Help for descriptions of various options, if needed.
-
-
Click OK in the Train on Log Data dialog box.
The New Model dialog appears.
-
Ensure that Train on Log Data is selected, and then click Train.
The model appears in the main Analyzer window.
-
Select Save or Save As in the File menu to save the model to the hard disk of your computer.
The Analyzer creates two files using the name you provide, with the extensions
.smdland.smdl_data.
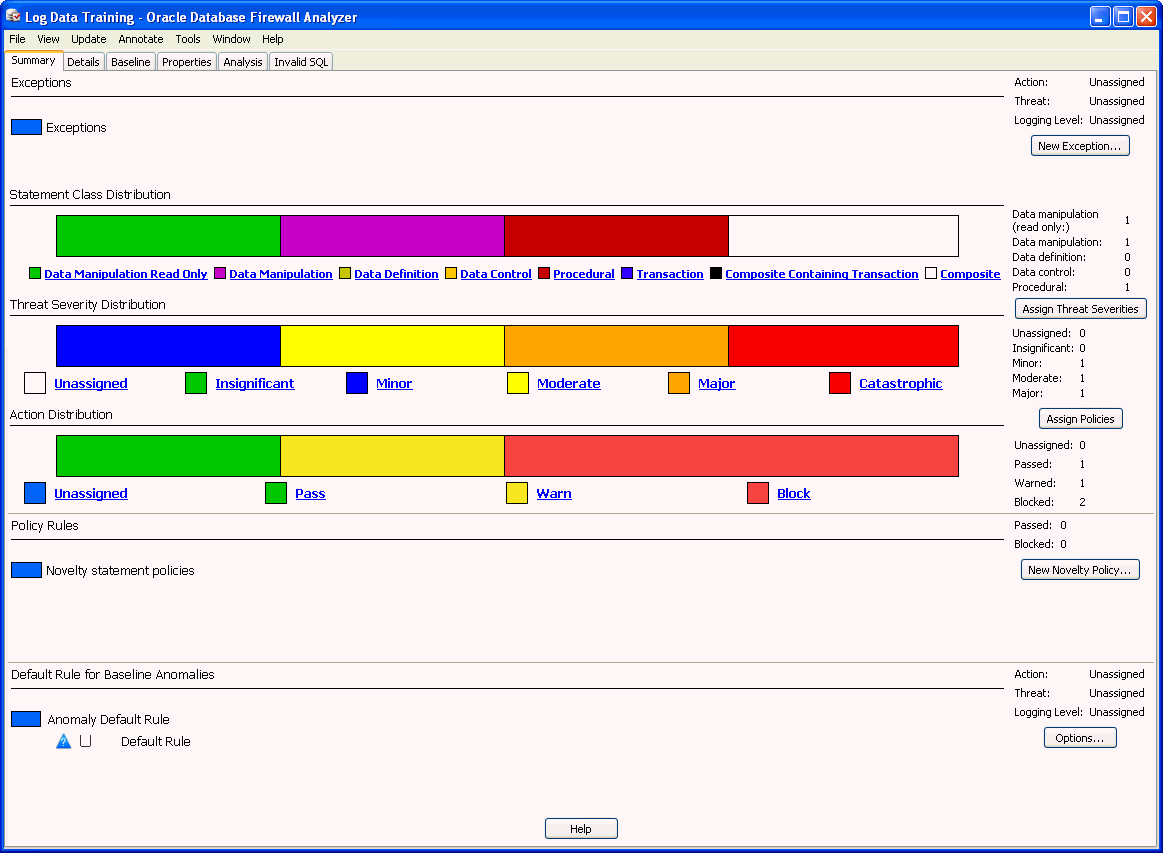
In a moment, the main window of the Analyzer appears, similar to Figure 3-2 .
Note:
If you do not see links under the Statement Class Distribution, Threat Severity Distribution, and Action Distribution areas, then resize the application window.Creating a New Model from Training on a SQL Statement File
To create a new model from training on a SQL statement file:
-
Follow the steps in "Creating a New Model in the Analyzer", and select Train on File in Step 3.
-
Click Browse and select the file you want to use.
-
Select the correct Database Type from the list.
-
Ensure that Train on File is selected, and then click Train.
The main Analyzer window appears, with the name of the
.trainor.trcfile at the top to indicate that the model is based on this file. -
Select Save or Save As in the File menu to save the model to the hard disk of your computer.
The Analyzer creates two files using the name of the base file, with the extensions
.smdland.smdl_data.
In a moment, the main window of the Analyzer appears, similar to Figure 3-2 .
Note:
If you do not see links under the Statement Class Distribution, Threat Severity Distribution, and Action Distribution areas, then resize the application window.Opening an Existing Model
-
Start the Analyzer.
-
In the Welcome to Oracle Database Firewall Analyzer window, select Open a previously saved Model.
-
In the Open dialog box, navigate to the directory where you saved the previous model file.
The model has the file extension
.smdl. (You cannot open the.smdl_datafile; it is only used to store the data of the model.) -
Select the model and then click Open.
The model appears in the Analyzer, with the Summary page displayed.
If you do not see links under the Statement Class Distribution, Threat Severity Distribution, and Action Distribution areas, then resize the application window.
Viewing and Analyzing Data in the Model
This section contains:
About Analyzing Data
After you have created a model by providing training data to the Analyzer, you can use it to analyze the SQL statements in that data.
This section describes various ways of viewing the data in the Analyzer by using different tabs and viewing options.
You can analyze the data before or after assigning policy rules (See "Designing the Policy"). Before assigning policy rules, the Analyzer will give you information on the training data you have provided, allowing you to filter it by statement type, database table, and column. After you assign policy rules, you will have more filtering options based on those policy rules.
The Analyzer Main Window
The Summary tab is the main interface of the Analyzer. The remaining tabs provide additional settings that you can modify, and analysis and information that you can view. These tabs are listed below and are discussed in this chapter.
Note:
If you do not see links under the bar charts, resize your application.Figure 3-2 shows the main window of the Analyzer.
Elements of the Analyzer Summary Tab
The Summary tab shows a graphical representation of the policy rules that are being applied to the statement types (clusters) being currently analyzed, as well as exceptions and other rules that may apply. This tab enables you to generate a policy automatically, set novelty policies, and filter the information that appears in the Details tab.
The Summary tab is divided into these areas:
-
Exceptions - Lists exceptions you have created. The rules that you have assigned to clusters in the model will not apply to these exceptions. You can specify one rule to be applied to all the exceptions listed here.
-
Graphical Distribution of Statements - Bar charts display the distribution of clusters in terms of different statement classes, threat severities, and action levels currently set in the policy.
When you click a link under a bar chart, the Details tab displays a subset of clusters based on that link. For example if you click Pass under Action Distribution, the Details tab displays the statement clusters that are set to Pass in this policy.
-
Novelty Policies - Lists special policies you have created for specific statement classes and/or specific tables in your protected database.
-
Default Rule - Shows the default rule for any statement anomalies that are not covered by the rules set for clusters seen in the model, Exceptions, or Novelty Policies.
Other Analyzer Tabs
In addition to the Summary tab, the Analyzer main window contains the following tabs.
Note:
The tabs and the menus are described in detail in the Online Help.-
Details: Provides a different way to view the SQL data by organizing clusters into cluster groups. It enables you to customize the policy manually.
-
Baseline: An alternative to using the Details tab. It displays clusters in a tabular format and shows the attributes of each policy. This tab also provides multiple ways of filtering clusters and enables you to customize the policy manually.
-
Properties: Contains general information about the model, such as the original data sources for the model, statistics, change control information, and notes.
-
Analysis: Enables you to analyze the SQL statements the Analyzer has scanned.
-
Invalid SQL: Displays any SQL statements that the Analyzer did not recognize, such as statements that do not conform to the SQL syntax.
Viewing Clusters by Cluster Groups
A cluster group is a set of clusters grouped by the Analyzer according to statement meaning, for example, select <column> from <table>. Statements that match this pattern, but that may have different values for the column and table, will be in this cluster group.
Viewing Clusters in the Analysis tab
To view clusters by cluster groups in the Analysis tab:
-
In the Analyzer, click the Analysis tab.
-
From the View menu, select Group by Shape.
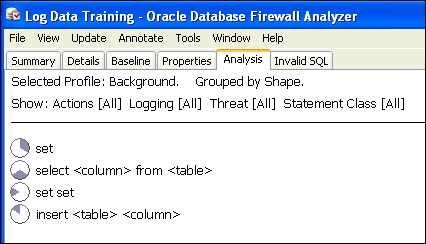
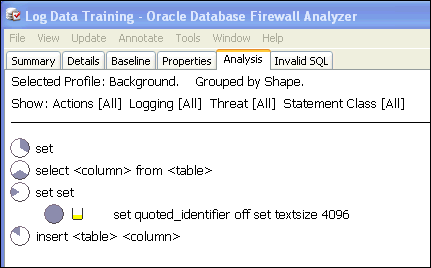
A hierarchical view of the SQL data appears. At the top level, the Analyzer organizes all the clusters it has defined into a number of cluster groups. Figure 3-3 shows four different cluster groups.
Double-clicking a cluster group reveals the clusters it contains. Figure 3-4 shows an example of the contents of a cluster group.
Double-clicking this cluster reveals all statements in the cluster. Figure 3-5 shows a statement within a cluster group. Cluster groups can contain multiple statements.
Figure 3-5 Statements within a Cluster Group in the Analysis Tab
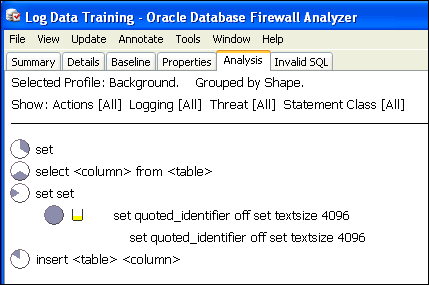
Description of "Figure 3-5 Statements within a Cluster Group in the Analysis Tab"
Cluster Indicators in the Analysis Tab
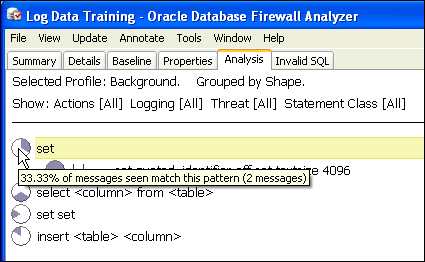
The Cluster indicator on the left side of a cluster (a pie-shaped icon) shows the percentage of statements in the cluster group that are in the cluster. Positioning the mouse pointer on the indicator gives the percentage to two decimal places, as shown in Figure 3-6. The tooltip also shows that there are two statements (messages) in the cluster.
Figure 3-6 Finding the Percentage of Statements in a Cluster in the Analysis Tab
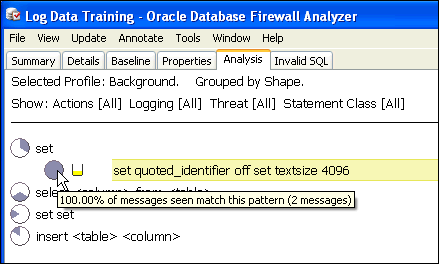
Description of "Figure 3-6 Finding the Percentage of Statements in a Cluster in the Analysis Tab"
The clusters in a cluster group are ordered by percentage.
The Cluster Group indicator on the left side of a cluster group shows the percentage of statements in the model that are in the cluster group. Figure 3-7 shows that the cluster group accounts for 33.33 percent of all statements in the model.
Figure 3-7 Indicator Showing the Percentage of Statements in the Analysis Tab
Description of "Figure 3-7 Indicator Showing the Percentage of Statements in the Analysis Tab"
The cluster groups are ordered by percentage.
Threat Severity Indicator in the Analysis Tab
The Threat Severity indicator for the cluster highlighted below shows the threat severity. The indicator is a vessel-shaped icon that varies from empty to full. Figure 3-8 shows an empty vessel indicator, with a message that no threat severity has been assigned yet.
This example also shows sensitive data, which is masked with #### symbols:
update scott.dept set dname = '####'
See "Sensitive Data Masking" for further information.
Viewing Cluster Groups in the Details Tab
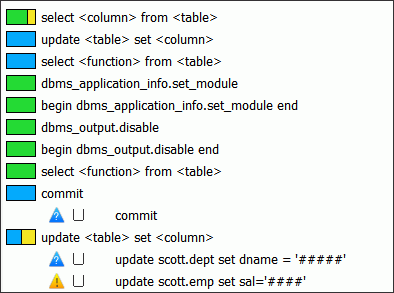
The Details tab provides the same Group by Shape, Table, or Column views that are available for the Analysis tab. Figure 3-9 shows sample data displayed when Group by Shape is selected in the Details tab.
Figure 3-9 Example Data Grouped by Shape in the Details Tab
Description of "Figure 3-9 Example Data Grouped by Shape in the Details Tab"
The data is organized in a similar way as in the Analysis tab. At the top level are the cluster groups. Each cluster group has an indicator, which shows the proportion of its clusters that have each action level. For example, at the end of the list in Figure 3-9, the update <table> set <column> icon indicates that 50 percent of the clusters in the cluster group have an "Unassigned" action level (blue), and 50 percent have a "Warn" action level (yellow).
Oracle Database Firewall has masked sensitive data in these two clusters. See "Sensitive Data Masking".
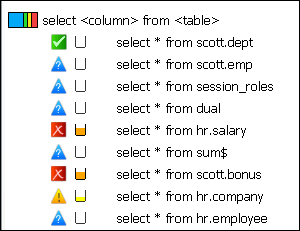
Double-click a cluster group to see the clusters it contains. The indicators next to a cluster show the currently selected action and threat severity.
The statement shown at the cluster level is an example of a statement in the cluster. Figure 3-10 shows an example of contents of a cluster group.
Figure 3-10 Contents of a Cluster Group in the Details Tab
Description of "Figure 3-10 Contents of a Cluster Group in the Details Tab"
Viewing Data by Database Tables
The Analyzer can organize the data by selected database tables.
To view data by database tables:
-
In the Analyzer, click the Analysis tab.
-
From the View menu, select Group by Table.
The Select Tables dialog appears automatically the first time you select Group by Table. Select the tables that you want to display, and then click OK.
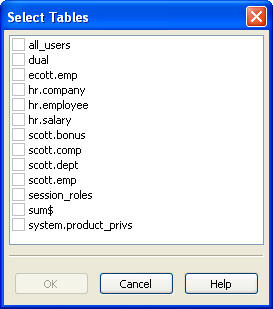
Description of the illustration image060.jpg
-
To select different tables, from the View menu, select Change Tables, select tables, and then click OK.
Figure 3-11 shows that two tables have been selected: hr.employee and hr.salary.
The SQL statements are grouped according to table. The statement select decode('#','#','#','#') from dual is for statements that do not refer to either of these selected tables.
Viewing Data by Database Columns
The Group by Column view is similar to Group by Table, described under "Viewing Data by Database Tables", but the Analyzer organizes the data by selected columns.
To view data by database column:
-
In the Analyzer, click the Analysis tab.
-
From the View menu, select Group by Column.
-
Select the columns you want to use to filter data, and then click OK.
-
To select different columns, from the View menu, select Change Columns, select columns, and then click OK.
Filtering Data in the Details and Analysis Tabs
To show specific types of clusters in the Details or Analysis tabs:
-
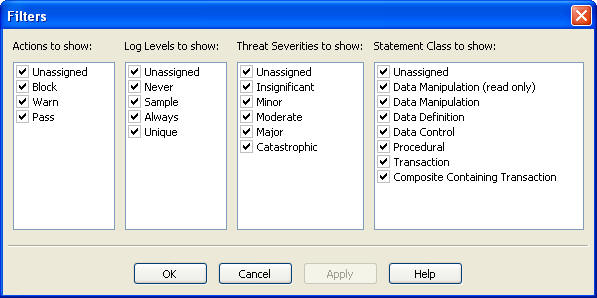
In the Analyzer Details or Analysis tab, from the Tools menu, select Filters.
The Filters dialog is displayed:
Description of the illustration image077.jpg
-
Select which clusters to show by selecting the Actions, Log Levels, Threat Severities, and/or Statement Classes for the clusters.
For example, if you select the action Warn, and the logging levels Sample and Always, only those clusters that have a Warn action and either a Sample or Always logging level are displayed.
Viewing and Filtering Data in the Baseline Tab
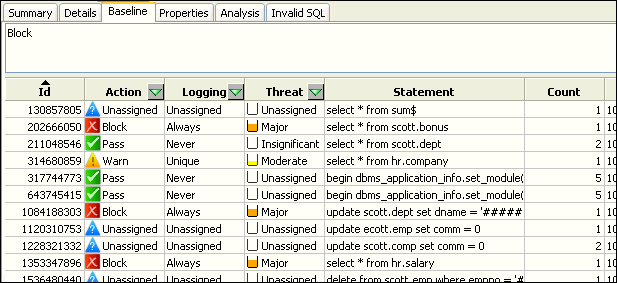
The Analyzer Baseline tab provides a tabular view of the data. Figure 3-12 shows a portion of this tab.
Figure 3-12 Tabular View of the Generated Clusters
Description of "Figure 3-12 Tabular View of the Generated Clusters"
The Baseline tab displays one row per cluster and has multiple columns that can be filtered. You can filter data by:
-
Action
-
Logging level
-
Threat level
-
IP address
-
Tables
-
Columns
-
Users
-
Statement type
-
Client program
-
OS users
To use the Baseline tab filters:
-
In the Analyzer, click the Baseline tab.
-
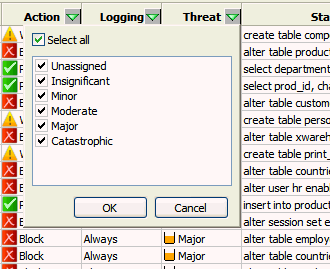
Click the filter icon (a down-arrow) at the top of any column that has a filter.
A filter dialog box similar to this appears:
Description of the illustration filter_by_threat.gif
Viewing Data by Profile
A Profile allows you to define a set of characteristics to use in filtering statements. See "Using Profiles to Display and Set Policy Rules for Specific Data". If you have created Profiles, you can view data by profile.
-
In the Analyzer, click the Details, Baseline, or Analysis tab.
-
From the View menu, select Profile, or Change Profile if you have previously selected one.
-
In the Select Profile dialog, select the Profile you want to view, and then click OK.
-
To return to viewing all data, from the View menu, select Background.
Viewing the Properties of a Model
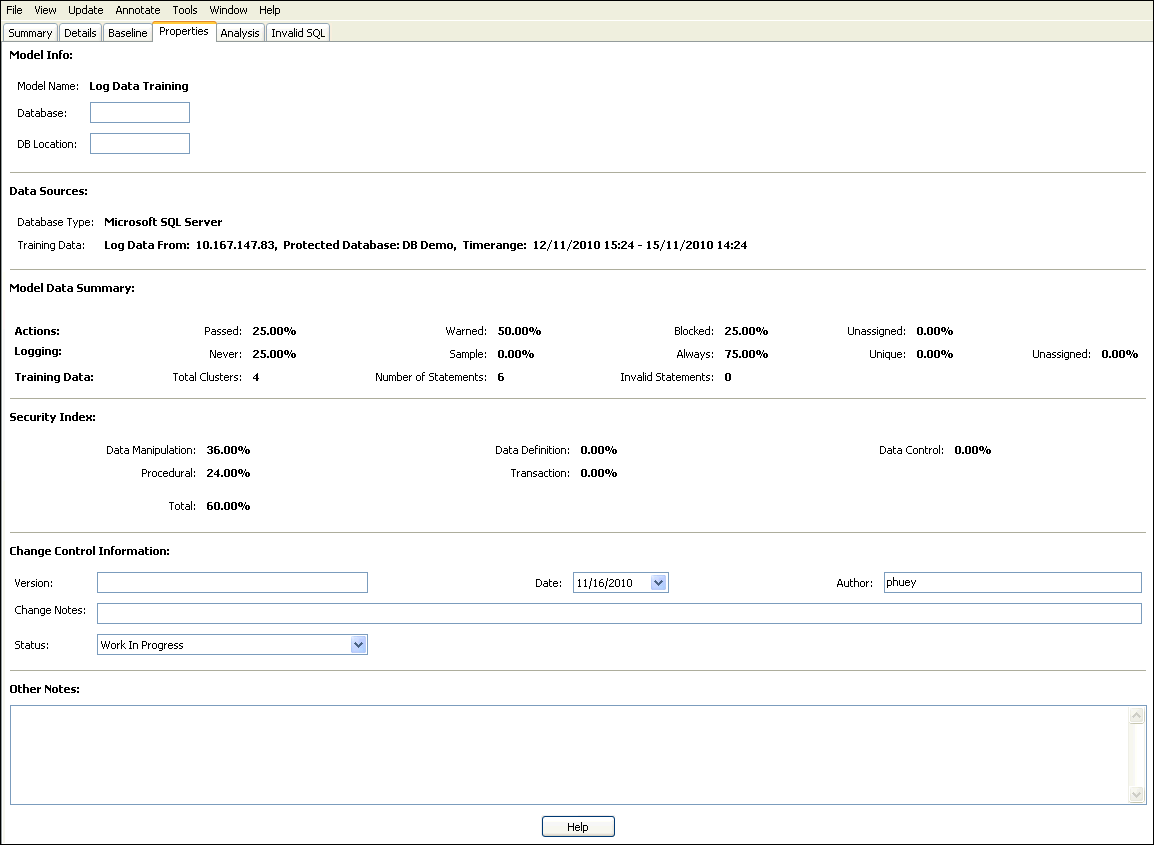
The Properties tab contains general information about the selected model, such as the original source of the data for the model, statistics, change control information, and notes. If you enter data in any of the fields, such as Database or DB Location, the Analyzer saves this information when you save the model. Figure 3-13 shows general information about a selected model.
Figure 3-13 Finding General Information About a Selected Model
Description of "Figure 3-13 Finding General Information About a Selected Model"
Designing the Policy
This section contains:
-
Manually Setting the Action, Logging Level, and Threat Severity
-
Using Profiles to Display and Set Policy Rules for Specific Data
About Designing the Policy
To successfully deploy an Oracle Database Firewall system you must develop an effective policy. Using the Analyzer you can design and refine a policy efficiently in minimum time.
Note:
In blocking mode, by default the Database Firewall blocks all IPv6 traffic regardless of the policies in place.Designing a policy includes:
-
Specifying these settings for each cluster in the model:
-
Action level: Whether or not Oracle Database Firewall permits, blocks, or produces a warning when it encounters a statement that matches the cluster.
-
Logging level: Whether Oracle Database Firewall never logs, logs all statements, or logs statements that have a unique combination of cluster, source IP address, database username, operating system username, and client program name. (See the Online Help for further information.) You can use logging as an independent record of database activity, which may, for example, be used for future audit or forensic purposes
Consider the amount of logging carefully, because increasing the data logged directly impacts required disk space. The frequency for the sample logging is every tenth statement for the cluster.
Oracle recommends that you use log unique policies or the initial policy because it guarantees one of each type. It efficiently samples traffic without logging all statements.
-
Threat Severity: The anticipated threat from statements in a cluster. There are six threat severity settings, ranging from Unassigned (vessel empty) to Catastrophic (vessel filled bright red). When Oracle Database Firewall logs a statement, the threat severity of the statement is also logged. You can use third-party reports and syslogs to display SQL statements based on the logged threat severity.
You can let the Analyzer automatically assign these settings when you provide the training data for a model, then adjust the settings as needed. See "Creating a Policy Automatically".
-
-
Creating Exceptions to the policy settings
-
Adding Novelty Policies (or rules) that are triggered when specific statement types are encountered and/or selected tables are called
-
Creating Profiles to filter data and set policy rules based on specific criteria (such as client IP address)
Creating a Policy Automatically
You create an initial policy automatically from the Summary tab.
Figure 3-14 shows a partial view of the Summary tab window.
The Summary tab provides the primary interaction with the policy. From the Summary tab, you can generate a policy automatically and view distribution charts of statement classes, threat severities, and action levels currently in the policy. Using the links that follow the charts, you can filter the contents of the Details tab while manually customizing the policy (for example, to display only policies with an Unassigned action level). An unassigned statement is a SQL statement that you have not yet categorized (for example, assigned it a threat level).
-
Select the Summary tab.
-
On the right side of the Summary page, select the following buttons:
-
Assign Threat Severities: This setting automatically assigns a threat severity to each cluster that has an "Unassigned" threat severity. The threat severity assigned is based on the perceived risks.
-
Assign Policies: This setting automatically assigns logging and action levels to each cluster based on its threat severity. (See the Online Help.)
Users who have view-only privileges can create a policy but they cannot apply it to a Database Firewall. Only Database Firewall system administrators can upload and apply new policy to a Database Firewall.
-
-
Optionally, set the following functionality:
-
Exceptions
-
New Novelty Policy
-
Options
See "Creating Exceptions, Novelty Policies, and a Default Rule".
-
After you create an initial policy, you can customize the policy using the Details or Baseline tab.
Manually Setting the Action, Logging Level, and Threat Severity
You can set or change the action, logging level, and threat severity of a cluster from the right-click menu in the Details or Baseline tab. The following shows an example of the right-click menu in the Details tab.
To set or change the Action, Logging, or Threat Severity for a cluster:
-
In the Details or Baseline tab, right-click a cluster.
Note: You can select several clusters in the Baseline tab by selecting the first cluster, and then pressing the Ctrl key to select more clusters.
-
In the Set Action, Set Logging, or Set Threat sub-menus, select the desired setting.
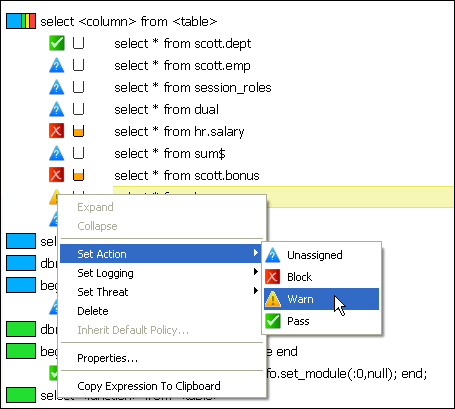
Figure 3-15 shows the right-click sub-menu for setting the action.
Figure 3-15 Changing the Action in the Details Tab
Description of "Figure 3-15 Changing the Action in the Details Tab"
See Also:
"Oracle Database Firewall Operational Modes" for a complete description of Database Policy Enforcement (DPE)Managing Traffic Encrypted with Oracle Database Advanced Security Option
Oracle Database provides the Advanced Security Option (ASO). For Oracle databases configured to use ASO, this option automatically encrypts network traffic. Oracle Database Firewall indicates the presence of ASO-encrypted network traffic in the reports and enables you to block this traffic through a policy.
If the Database Firewall encounters ASO-encrypted traffic, it enters the following string into the log file:
extracted_from_protocol encrypted
After you create or refresh a model from an ASO-enabled database that has been generating ASO traffic (see "Creating a New Model from Training on Log Data"), a cluster with the text extracted from protocol encrypted appears in the list of other clusters generated in the model. From here, you can create policies on this cluster, such as setting a threat level or blocking it.
See Also:
Oracle Database Advanced Security Administrator's Guide for detailed information about ASOCreating Exceptions, Novelty Policies, and a Default Rule
This section contains:
About Exceptions, Novelty Policies, and the Default Rule
You create Exceptions and Novelty Policies to set rules for specific conditions and types of statements that occur in your database traffic.
You customize the Default Rule to handle any statement that is an anomaly, and therefore, not covered by any of your policy settings, Exceptions, or Novelty Policies.
Creating Exceptions
An exception determines the action, logging level, and threat severity to use when certain session data is encountered. For example, an exception could specify rules for statements that occur during specific times of the day, or originate (or do not originate) from selected client IP addresses or user names.
Exceptions override all other policy rules. For example, you may want to override standard policy rules if SQL statements originate from an administrator, or if they originate from anywhere other than a specific IP address.
In order to create an Exception, you must already have defined the sets of factors to be used in defining it. See "Defining Sets of Factors to Use in Profiles and Exceptions".
To create an Exception:
-
In the Analyzer Summary tab, click New Exception.
-
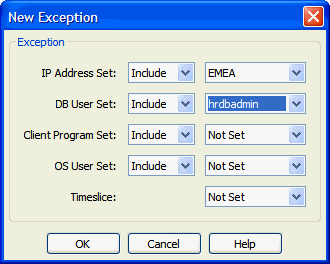
In the New Exception dialog, select to include or exclude sets in your Exception. All of the criteria for sets in this exception must be met for the rules to take effect.
Description of the illustration exception_dialog.gif
In the above example, you are specifying that this Exception applies to statements originating from the EMEA IP Address Set AND from the hrdbadmin DB User Set. If you were to Exclude hrdbadmin in DB User Set, the exception would apply to statements originating from EMEA IP address AND not originating from the hradmin DB User Set.
-
Click OK.
The Exception appears in Summary tab at the top. In the example below, there are two exceptions:
-
The first applies to statements originating from the NA IP Address set and that are not originating from the Ops Client Program Set.
-
The second applies to statements originating from the EMEA IP Address Set and that are from users in the hrdbadmin DB User Set.

Description of the illustration exceptions_listed.gif
-
-
In the Summary tab, right-click the Exceptions (above your list of Exceptions).
-
Set the Action, Logging, and Threat levels that apply if ANY of your Exceptions apply.
The icons next to all your Exceptions change depending on your settings.
Creating Novelty Policies
Novelty policies specify the action, logging level, and threat severity to use for specific types of statements and/or statements that operate on selected tables. Novelty policies can be used to loosen or tighten your normal policy rules if certain statements are encountered.
For example, if the normal policy action for a certain statement type is Warn, you may want to set up a novelty policy that applies a Pass action if this statement type operates on tables containing public information. Alternatively, you may want to set up a novelty policy that blocks all statements that operate on tables containing sensitive information.
-
In the Analyzer Summary tab, click New Novelty Policy.
-
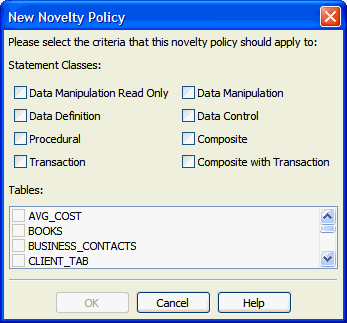
In the New Novelty Policy dialog, select one or more classes of statements and/or one or more database tables that will trigger this policy.
Description of the illustration new_novelty_policy.gif
-
Click OK.
-
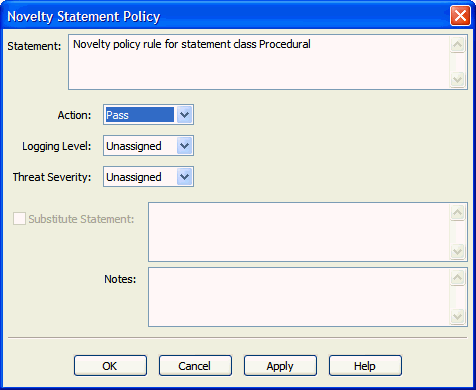
In the Summary tab, under Novelty statement policies, right-click the new Novelty Policy, and select Properties.
The Novelty Statement Policy dialog appears:
Description of the illustration novelty_policy_properties.gif
-
Set the following to define the rules for this policy:
-
Action, Logging Level, and Threat Severity
-
Optionally select Substitute Statement and enter a statement that will be substituted if the specified type of statement in this Novelty Policy is encountered. Make sure when providing a substitute statement that the statement can be handled by your client applications.
-
-
Click OK.
Your new Novelty Policy is listed in the Summary tab, with icons matching your settings.

Description of the illustration novelty_policy_listed.gif
If a statement matches more than one Novelty Policy, the worst-case policy is used. For example, a policy that blocks takes priority over a policy that warns.
Customizing the Default Rule
For statement anomalies (that is, statements that do not fall into any of your other policy rules), the Analyzer lets you specify the default settings for logging, threshold action rest time, syntax, and case sensitivity.
To Customize the Default Rule:
-
In the Analyzer Summary tab, in the Default Rule for Baseline Anomalies section, right-click the Default Rule, and select Properties.
The Default Rules for Baseline Anomalies dialog appears.
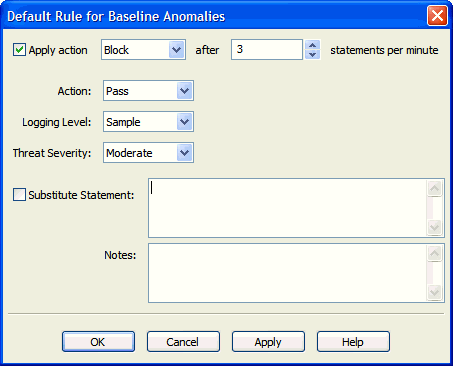
Description of the illustration default_rule_properties.gif
-
Set the following:
-
Action, Logging Level, Threat Severity
-
(Optional) To apply a different action after a certain number of anomalous statements per minute are encountered, select the Apply action check box at the top, and set the counter to the number of statements per minute.
-
Optionally, check Substitute Statement and enter a substitute statement when this default rule is triggered. Be careful to write a statement that can be handled by your client applications.
-
-
Click OK.
Blocking SQL and Creating Substitute Statements
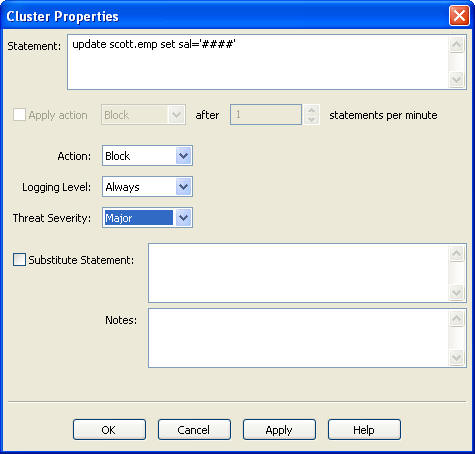
You can find and change the properties of a cluster listed in the Baseline tab by right-clicking the cluster, and selecting Properties from the menu.
Figure 3-16 Cluster Properties Dialog Box
Description of "Figure 3-16 Cluster Properties Dialog Box"
This dialog box provides the following additional features:
-
Blocking SQL statements or producing warnings: You can choose to block the SQL statement or produce a warning if a statement that matches the selected cluster occurs more frequently than a specified number of times in one minute. Remember that you should always enable logging for blocked statements.
-
Creating substitute SQL statements: In Database Policy Enforcement (DPE) mode only, you can define a Substitute Statement for any cluster that has a blocked action. A substitute statement may be necessary to ensure that the database client is presented with an appropriate error message or response.
The following is an example of a good substitute statement that you can use for an Oracle database, one that is harmless and does not return any values or affect performance.
SELECT 100 FROM DUAL
Creating Login and Logout Policies for Database Users
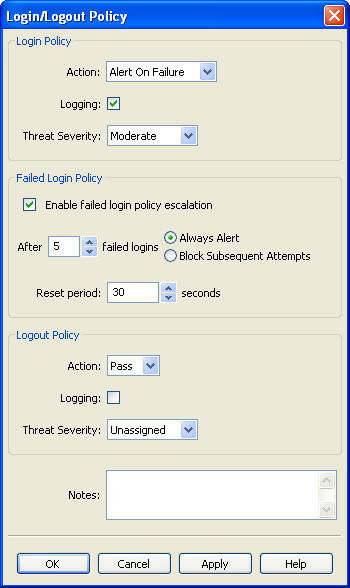
You can use Login/Logout Policy from the Tools menu to specify the login and logout policies for database users. Login and Logout policies send alerts when the policy has been violated. This is useful in the case of automated attacks on the database.
Figure 3-17 shows the Login/Logout Policy dialog box.
Figure 3-17 Login and Logout Policies for Database Users
Description of "Figure 3-17 Login and Logout Policies for Database Users"
The Login/Logout Policy dialog box contains three sections:
-
Login Policy: Specify the action level and threat severity to use for successful or unsuccessful database user logins, and whether or not to log logins.
-
Failed Login Policy: Specify the failed login policy, for example, to block a client or generate an alert after a specified number of consecutive unsuccessful logins (an "alert" being a "warn" action level). If triggered, login blocking continues for the specified Reset period; after this period, the database client can attempt to log in again.
-
Logout Policy: Specify the action level and threat severity to use for database user logouts, and whether or not to log logouts.
Using Profiles to Display and Set Policy Rules for Specific Data
A profile is a type of filter that can display data in various ways and to set up policy rules for specific database users, IP addresses, operating system users, client programs, and times of day.
You can, for example, decide to create a profile that allows you to set up different policy rules for a certain set of database users who access the database during the night. When a user in the set accesses the database during the specified time, the profile policy rules are used and override the standard "background" rules.
A profile is any combination of the following sets of factors that are used as filters (see "Defining Sets of Factors to Use in Profiles and Exceptions").
-
IP addresses
-
Database user login names
-
Client Program names (for example, SQL*Plus)
-
Operating System user names
-
Timeslice (for example, 9 a.m. to 5 p.m., Monday through Friday)
Creating a Profile
In order to create a profile, there must be sets of factors defined to use for filtering purposes. See "Defining Sets of Factors to Use in Profiles and Exceptions".
To create a Profile:
-
From the Tools menu, select Profiles.
-
In the Profiles dialog box, select Add.
-
In the Profile dialog box, enter the following settings:
-
Name: Enter a name for the profile.
-
IP Address Set: From the list, from the available IP address sets, or leave it at Not Set.
-
DB User Set: From the list, select from the available database user sets, or leave it at Not Set.
-
Client Program Set: From the list, select from the available client program sets, or leave it at Not Set.
-
OS User Set: From the list, select from the available operating system user sets, or leave it at Not Set.
-
Timeslice: From the list, select from the available timeslices, or leave it at Not Set.
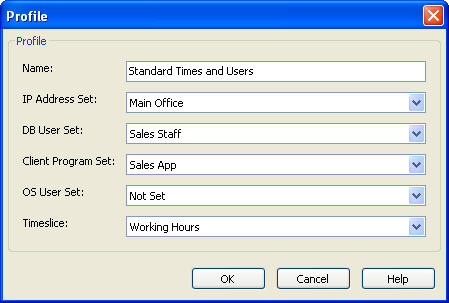
Description of the illustration image087.jpg
-
-
Click OK.
Using Profiles in the Analysis and Details Tabs
When the Analysis tab is displayed, the first time you select Profile from the View menu, you are prompted to select a profile. Subsequently, you can change the profile by using View, Change Profile.
The Analysis tab then displays only those clusters with SQL statements that have originated from the sources and times that match the selected profile. If, for example, the profile includes only a database user set, the Analysis tab displays only those clusters with SQL statements that have originated from the database users in the DB user set. If the profile includes both a database user set and a timeslice, then the Analysis tab only displays clusters with statements from that user set, and from that timeslice.
When viewing a profile, you can set up policy rules for that profile. These override the background rules. Note that with a profile selected, you still can change the background action level of a cluster by right-clicking.
In the Details tab, selecting a profile does not change the clusters displayed. You will still see all clusters, however, if you have selected a profile, you can set up policy rules for both that profile and all other statements (background rules).
A SQL statement can match more than one profile. In this case, Oracle Database Firewall uses the most severe action, logging level, and threat severity of all matching profiles.
Defining Sets of Factors to Use in Profiles and Exceptions
Sets are used in defining the filters used in Profiles and Exceptions. Profiles and Exceptions are defined using the following sets:
-
IP address set: A specified list of IP addresses of database clients
-
DB user set: A specified list of database user login names
-
Client Program set: A specified list of client programs, for example SQL*Plus.
-
OS User set: A specified list of operating system user names
-
Timeslice: A specified set of hours in a week. For example, a timeslice may be 9 a.m. to 5 p.m., Monday through Friday. Time is based on the Database Firewall that you are using to monitor the database.
-
From the Tools menu, select from the following options:
-
IP Address Sets
-
DB User Sets
-
Client Program Sets
-
OS User Sets
-
Timeslices
-
-
In the dialog that appears (for example, DB User Sets), click Add to create a new set.
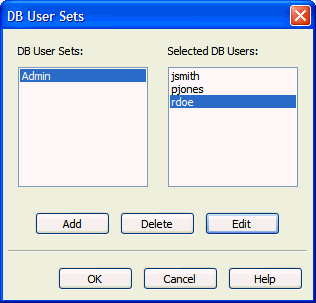
Description of the illustration dbuser_set_dialog.gif
-
In the next dialog box, enter the set name in the Name field, for example,
hrdbadmin.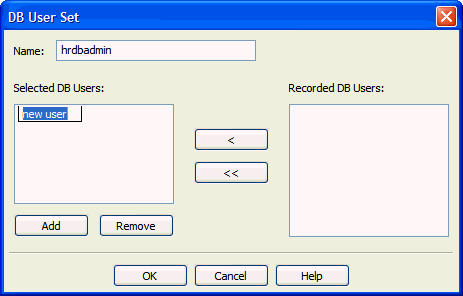
Description of the illustration dbuser_set_dialog2.gif
-
Do one or both of the following:
-
From the Recorded list on the right, select the items you want, and then click the left angle bracket to move them to the Selected list.
-
To to specify a new member of the set, click Add and type the name of the new item in the field in the Selected list.
You can use two wild cards for members of a set (but not for IP addresses): a question mark (?), which matches a single character, and an asterisk (*), which matches any number of characters.
Repeat this step as necessary to add items to this set.
-
-
Click OK, and then click OK again.
-
Repeat these steps for as many sets as necessary. You can then use these sets in defining Profiles or Exceptions.
Creating a Policy File and Uploading it into the Database Firewall
After you have designed a policy, you must save the policy to a file and then deploy this file to a Database Firewall.
This section contains:
Creating a Policy File in the Analyzer
To create a policy file in the Analyzer:
-
In the Create Policy dialog box, navigate to the location of your Database Firewall model files (assuming that you want to keep the models and policies together).
-
Enter a file name and then click Save.
The name of the current training model is offered by default, with the file extension
.dna. Oracle Database Firewall saves the policy.dnafile in thesmdldirectory by default.
Uploading and Enabling a Policy in the Database Firewall or Management Server
To upload and enable a policy in the Database Firewall or Management Server:
-
Log into the Standalone Database Firewall or Management Server Administration Console and select the Monitoring tab.
-
In the Policies menu, select Upload.
The Upload Policy page appears.
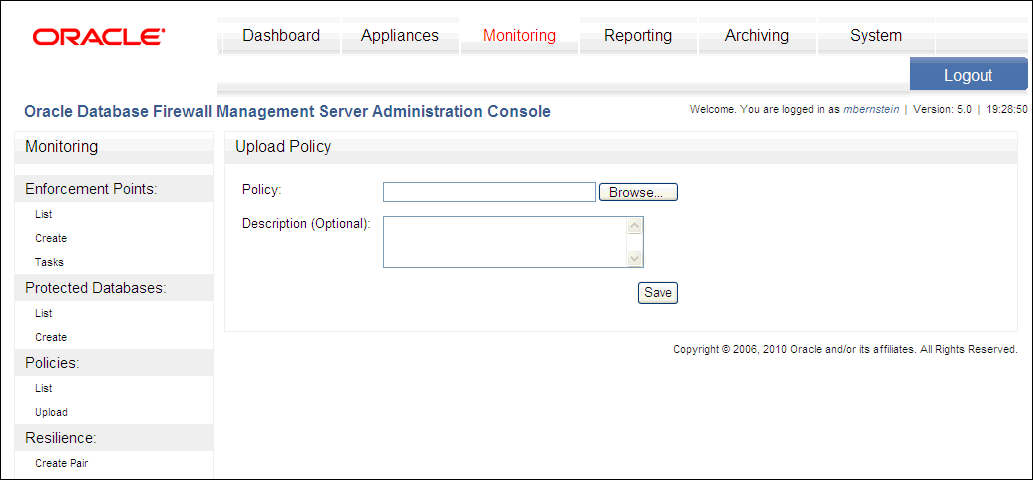
Description of the illustration upload_policy.gif
-
In the Upload Policy page, do the following:
-
Click the Browse button to find the correct policy file (extension
.dna). -
Optionally, in the Description field, enter a description for the policy.
-
Click the Save button.
The Policies page notifies you that the policy has been uploaded, and displays a list of the currently uploaded policies. From here, you can edit or delete the policy if you want.
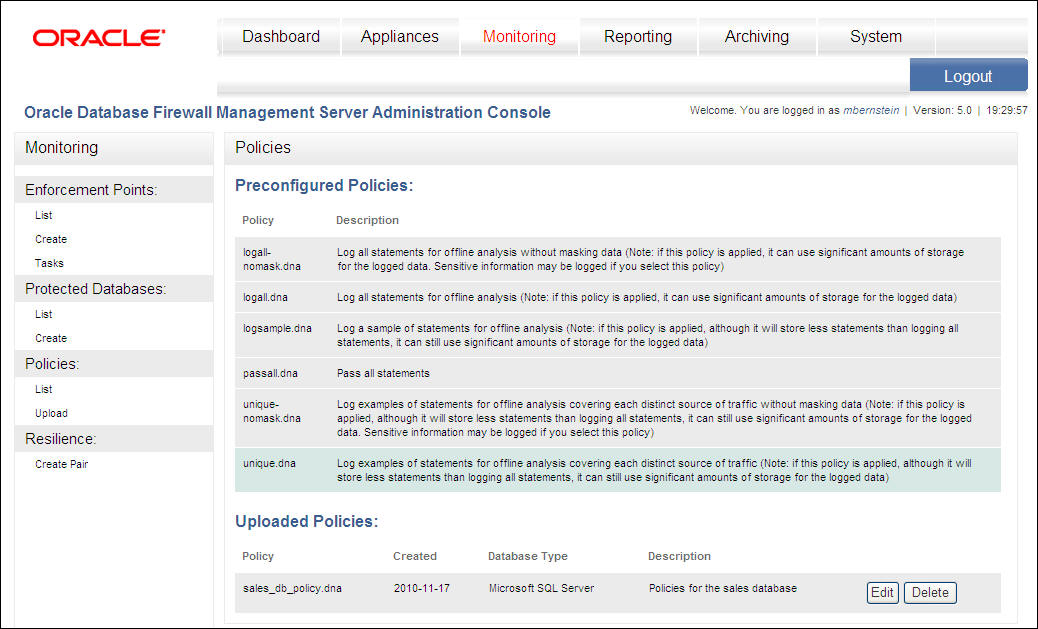
Description of the illustration baselines.jpg
-
-
To enable the policy:
-
From the Monitoring tab, under the Enforcement Points menu, select the List button.
-
Select the Settings button for the enforcement point that you want to use for the policy.
-
In the Monitoring Settings page, scroll to the Policy area.
The policy that you uploaded is listed with the default policies.
-
Select the policy that you uploaded.
-
Click the Save button.
-
If you are using the Database Firewall Management Server, it automatically distributes the policy to the appropriate Oracle Database Firewalls.
To list preconfigured and uploaded policies:
-
In the Database Firewall or Management Server Administration Console, select the Monitoring tab.
-
In the Policies menu, select List.
The page displays preconfigured policies at the top and any policies that have been uploaded.
Preconfigured policies are those that are supplied by default. You cannot delete preconfigured policies.
Policies that are listed with a blue background are currently used by an enforcement point.
-
(Optional) From this page:
To delete an uploaded policy, click Delete.
To edit a policy's description, click Edit.
Improving and Refining the Policy with new Data
This section contains:
-
Refreshing the Analyzer with Updated Data from the Monitored Database
-
Assigning Policy Rules to the New Data and Updating Your Policy
Refining the Policy Interactively
You can refine the policy with new data at any time. Figure 3-18 illustrates how the development of the policy is an iterative process.
Figure 3-18 Iterative Development Cycle of the Policy
Description of "Figure 3-18 Iterative Development Cycle of the Policy"
The iterative policy development cycle is as follows:
-
Log unique policies are enabled in order to collect SQL traffic for the policy. See "Enabling Log Unique Policies to Provide Logging Data".
-
The Database Firewall logs SQL statements according to the initial policy used, for example, the Log Unique policies or the policy you have developed.
-
The Analyzer allocates the new statements to the appropriate clusters, and when necessary, creates new clusters. If new clusters have been created, action and logging levels for these should be assigned, either automatically or manually.
New session factors (such as client IP addresses, database or OS user names, or client application names) should also be allocated to appropriate sets, and Profile definitions updated accordingly. See "Defining Sets of Factors to Use in Profiles and Exceptions".
-
After you have made modifications, you can deploy the policy.
Refreshing the Analyzer with Updated Data from the Monitored Database
Development of the policy is an iterative process. Use unique log policies after you have deployed the initial policy. This enables Oracle Database Firewall to log new SQL statements, which you then can import into the Analyzer for analysis against the statements used to build the current policy.
Unique log policies also enable you to detect policy anomalies. This way, you can identify possible security vulnerabilities and to improve the policy further. You can repeat this process as many times as required.
To refresh the Analyzer with updated data from the monitored database:
-
From the Update menu, select Update with Log Data.
-
In the Traffic Log Server dialog box, enter the IP address of the Database Firewall and the credentials of a valid Database Firewall system administrator.
The default IP address and credentials are offered.
-
In the Update with Log Data dialog box, specify the appropriate settings and then click OK.
See Step 4 under "Creating a New Model from Training on Log Data" for more information about these settings.
Alternatively, in Step 1, you can also select:
-
Update with File to test the model against data from a train or trace file
-
Test Single Statement to test the model against a single SQL statement
Analyzing the Updated Data
After you have refreshed the Analyzer with updated data from the monitored database, the Analyzer reads each SQL statement in the updated data and assigns it to a cluster for you to analyze in the Details, Baseline, and Analysis tabs.
Some statements in the new data may generate additional clusters. These can be easily identified in the Details and Baseline tabs, because they have the default "Unassigned" action icon, which is triangle that contains a question mark.
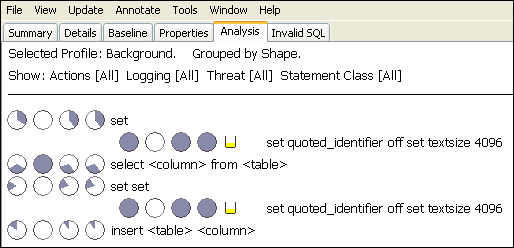
Figure 3-19 shows an example of the results displayed when using Group by Shapes in the Analysis tab.
Figure 3-19 Example Data Showing Additional Clusters Created
Description of "Figure 3-19 Example Data Showing Additional Clusters Created"
In this example, additional sets of pie-shaped indicators appear. The first indicator on each line (on the left) describes the statements in the original data used to create the model. The second indicator describes the statements in the first set of test data. A new set of indicators appears each time you test the model. See "Cluster Indicators in the Analysis Tab".
Figure 3-20 shows an example of additional clusters that have been created from new data in the Details tab.
Figure 3-20 Additional Clusters Created from New Data in the Details Tab

Description of "Figure 3-20 Additional Clusters Created from New Data in the Details Tab"
Assigning Policy Rules to the New Data and Updating Your Policy
After refreshing the Analyzer with updated data, you can assign rules to the new clusters in your model.
To assign policy rules to the new data and update the policy:
-
Do one of the following:
-
To assign policy settings to the new data automatically, in the Summary tab, click Assign Threat Severities and Assign Policies. You can change the settings assigned later.
-
To assign policy settings manually, find the new clusters in the Baseline or Details tab and assign settings for Action, Logging Level, and Threat Severity. See "Manually Setting the Action, Logging Level, and Threat Severity".
-
-
From the File menu, select Create Policy.
In the Create Policy dialog box, you can either create a new policy with a different name, or select your current policy and replace it with your updates.
When you have created the policy file, you must upload it to the Management Server using the Administration Console. See "Creating a Policy File and Uploading it into the Database Firewall".
Additional Features
This section contains:
Sensitive Data Masking
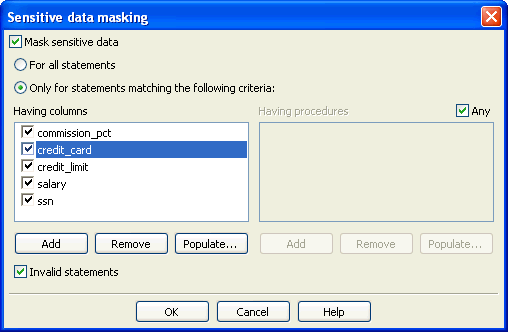
Sensitive data masking prevents sensitive data, such as credit card numbers, from appearing in log files.
Selecting Sensitive data masking in the Tools menu enables you to set up rules for automatically masking sensitive data in log files.
Figure 3-21 shows the Sensitive data masking dialog box.
Figure 3-21 Setting Up Rules for Automatic Masking of Sensitive Data
Description of "Figure 3-21 Setting Up Rules for Automatic Masking of Sensitive Data"
If a logged statement matches the masking policy set up in this dialog, the policy automatically replaces all user data in that statement (such as, string constants, integer constants, hexadecimal constants, and float constants) with alternative characters. The characters used depend on the data type.
Exporting the Data in a Model as HTML
To create an HTML summary of the data in a model, from the File menu, select Export as HTML. You may want to use this feature for reporting purposes.
Creating a Model from a Policy File
You may wish to experiment with a new model based on an existing policy file.
To create a model from a policy .dna file:
-
From the File menu, select Load Policy.
-
Select the
.dnapolicy file. -
From the File menu, select Save.
The file is saved as a
.smdlmodel file.
