| Skip Navigation Links | |
| Exit Print View | |

|
Oracle Java CAPS Java EE Service Engine User's Guide Java CAPS Documentation |
| Skip Navigation Links | |
| Exit Print View | |

|
Oracle Java CAPS Java EE Service Engine User's Guide Java CAPS Documentation |
Using the Java EE Service Engine in a Project
About the Java EE Service Engine
Java EE Service Engine Features
Java EE Service Engine Limitations
Java EE Service Engine Use Case Scenarios
Java EE Service Engine as Service Provider and Service Consumer
Java EE Service Engine as a Service Provider
Java EE Service Engine as a Service Consumer
Java EE Service Engine Example Scenario
Configuring and Starting the Java EE Service Engine
To Start the Java EE Service Engine from the NetBeans IDE
To Start the Java EE Service Engine from the Admin Console
To Start the Java EE Service Engine Using Command Line Interface
Installing Java EE Service Engine Using Command Line Interface
You can administer the Java EE Service Engine instances using the GlassFish Admin Console tools. These tools enable you to monitor and change the Java EE Service Engine's variable values, and suspend, resume, or terminate instances.
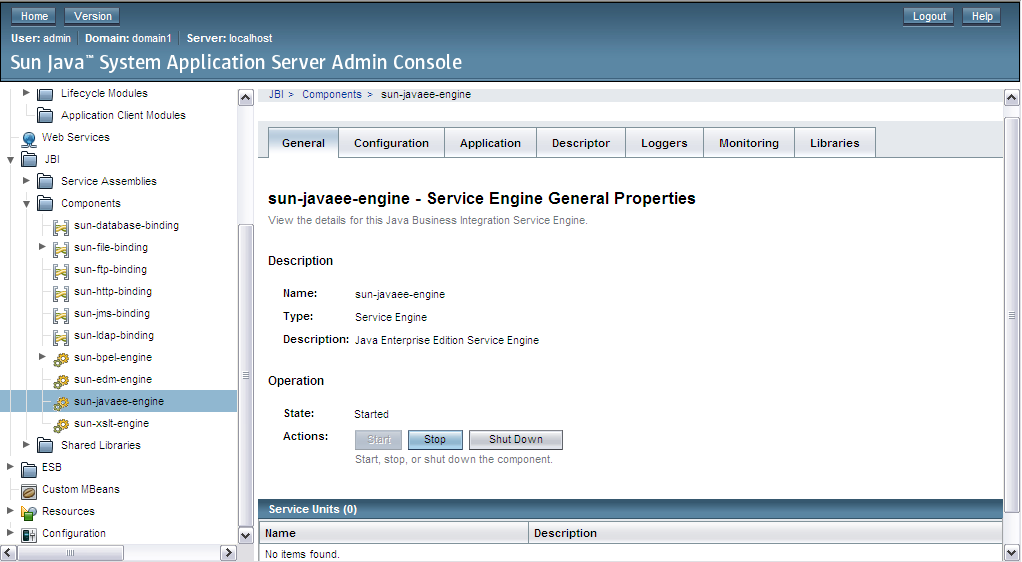
The Java EE Service Engine properties page opens. Here you can view the details of the Java EE Service Engine, Service Units, and perform Start, stop and shut down operations.

The NetBeans IDE provides the ability to define logging for process activities.
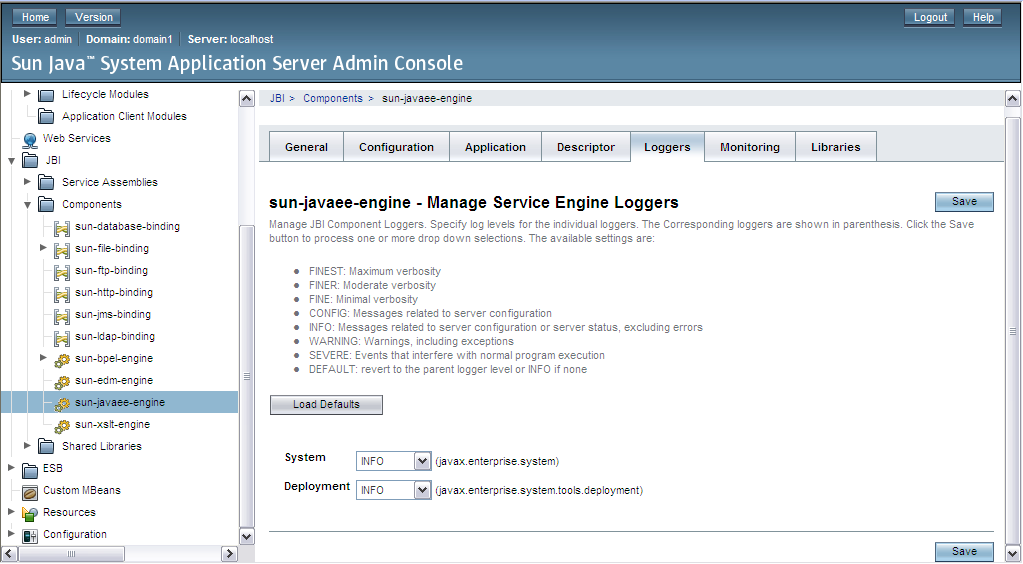
Logging is used to write specified expression values or partner links endpoint reference information to the server log. The log level for the Java EE Service Engine is specified through the GlassFish Admin Console.
For more information seeTo View the General Properties.
If logging is defined for a process activity, and the log level specified for it corresponds to the log level set for the Java EE Service Engine, after you perform a test run of the process, the selected variable value will be written to the server log file.
The following levels of logging are available:
FINEST
FINER
FINE
CONFIG
INFO
WARNING
SEVERE
OFF

The GlassFish server log opens in the Output window. The activity message value is included in the log. You can use Search to find the log information. Note that some overhead information is hidden.
The information provided in the log includes the following points, divided with the vertical bar:
Date and time of the entry
Log level
Manager type
Thread