1 Overview of Oracle CEP Visualizer
This section contains information on the following topics:
-
Section 1.2, "Understanding the Oracle CEP Visualizer User Interface"
-
Section 1.3, "Understanding Oracle CEP Visualizer Administration Tasks"
1.1 Overview of Using Oracle CEP Visualizer
Oracle CEP Visualizer is a Web 2.0 application that consumes data from Oracle Complex Event Processing Server (or Oracle CEP for short), displays it in a useful and intuitive way to system administrators and operators, and, for specified tasks, accepts data that is then passed back to Oracle CEP so as to change its configuration.
Oracle CEP Visualizer is itself an Oracle CEP application that is automatically deployed each time you start a server. You invoke Oracle CEP Visualizer in a browser to use it.
In particular, you can use the tool to perform the following tasks:
-
View the structure of an Oracle CEP domain
-
Manage security
-
Configure Oracle CEP server instances
-
Install, uninstall, suspend, resume, and update applications
-
View, update, create, and delete Oracle CQL and EPL rules
-
View the EPN associated with an application
-
Tune application parameters and monitor application status
-
Record and playback of events flowing through the EPN.
-
Create diagnostic profile to monitor application stage latency and throughput.
-
Monitor and perform diagnosis on your CQL Processor with Query Plan.
-
Manage and create server wide resources such as HTTP publish-subscribe channels and data sources.
-
Dynamically turn server and application logging on and off.
-
Manage Oracle Coherence cluster and server instances.
This section describes:
1.2 Understanding the Oracle CEP Visualizer User Interface
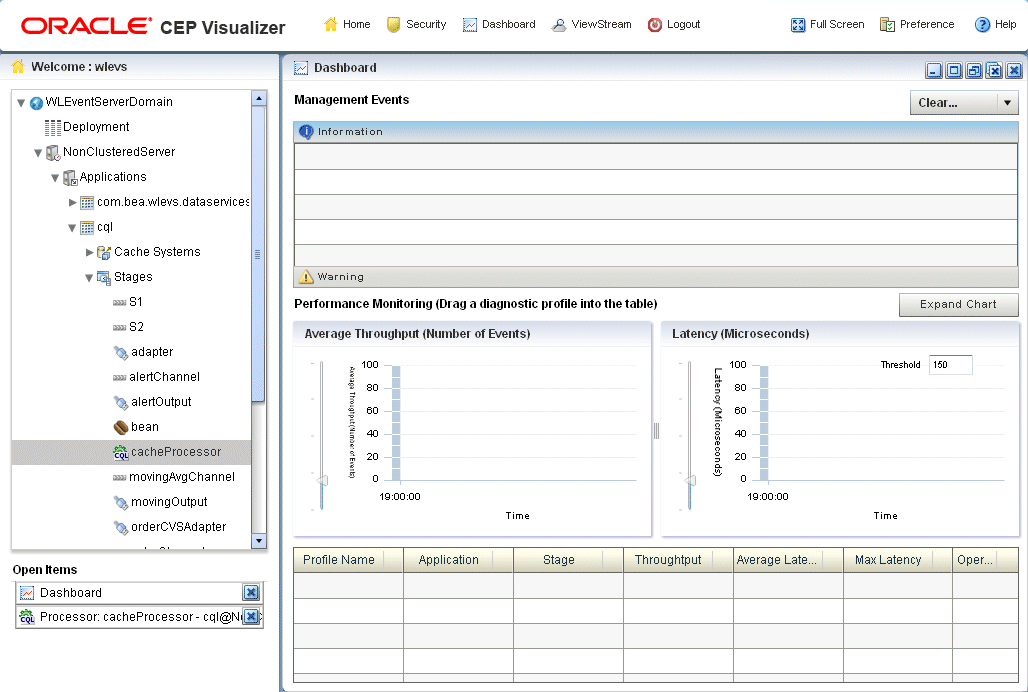
As Figure 1-1 shows, the Oracle CEP Visualizer has the following main panes:
Figure 1-1 Sample Oracle CEP Visualizer Window
Description of "Figure 1-1 Sample Oracle CEP Visualizer Window"
Figure 1-1 shows a domain that contains a single server instance called NonClusteredServer. The server contains four deployed applications: com.bea.wlevs.dataservices, cql, fx, and signalgeneration; the signalgeneration application is currently opened. The right pane contains the configuration of the rules of the processor1 stage; in particular, processor1 has been configured with rules vTrend, trend, percent, and S. The application called com.bea.wlevs.dataservices is associated with Oracle CEP Visualizer itself and is always deployed in an Oracle CEP server instance. Section 1.3.1.1, "The com.bea.wlevs.dataservices Application" for details.
1.2.1 Top Pane
This pane includes the most used buttons:
-
Home button that takes you to the main Oracle CEP Visualizer page.
-
Security button that takes you to the security page in which you can add or configure users and groups and map users to application roles and task roles; see Chapter 20, "Overview of Security Tasks" for details.
-
Dashboard button takes you to the performance management screen that you use to monitor the throughput and latency of a running application and its stages; see Section 1.2.4, "Overview of the Oracle CEP Visualizer Dashboard" for more information.
-
ViewStream button takes you to a screen from which you can monitor the messages streaming through the configured HTTP publish-subscribe channels; see Section 1.2.5, "Overview of the Stream Visualizer (ViewStream) Panel" for more information.
-
Full Screen button fills your entire computer screen with the Oracle CEP Visualizer tool; press the Esc key to return to a normal screen.
-
Preferences button takes you to a page where you can set user preferences, such as the language and maximum number of open panes, and accessibility settings such as restricting the maximum number of open panes to 1 and disabling Full Screen mode.
-
Help button takes you to the task-oriented online-help hosted by the Oracle CEP server.
1.2.2 Left Pane
This pane displays a domain tree for the domain that includes all the objects contained in the domain, such as the Oracle CEP server instances, the deployed applications and services within each server instance, and domain-level security configuration.
The domain name is determined by the Oracle CEP server config.xml file domain element. For example, the domain tree is named mydomain if your config.xml file is like this:
<domain>
    <name>mydomain</name>
</domain>
The Open Items box in the lower half of the left pane lists the items that are currently open, making it easy to return to or close the windows after you have navigated away from them. Any open panels that require refresh are marked with a red X in the Open Items list. For more information, see Section 1.2.7, "Oracle CEP Visualizer Panels that Require Refresh".
1.2.3 Right Pane
This pane is a multi-document container. When you open multiple documents, the documents are overlaid one on top of the other.
This pane displays information about objects that you have clicked on in the left pane. The format of the information depends on the object; for example, if you click on a deployed application in the domain tree in the left pane, the right pane shows general information about the application (General tab) as well as various visual representations of the event processing network of the application (Event Processing Network tab). If you click on a particular stage of the network, such as a stream or processor, the right pane shows general information about it as well as stage-specific information, such as the rules for a processor. For more information, see Section 1.2.6, "Overview of the Event Processing Network".
Any open panels that require refresh are marked with a red X in the title of the panel. For more information, see Section 1.2.7, "Oracle CEP Visualizer Panels that Require Refresh".
Table 1-1 describes the buttons in the top right corner of the right pane that you can use to manage panels. Note that these buttons are not visible if you set the Max Open Panels preference to 1 (see Section 2.2, "Managing User Preferences").
1.2.4 Overview of the Oracle CEP Visualizer Dashboard
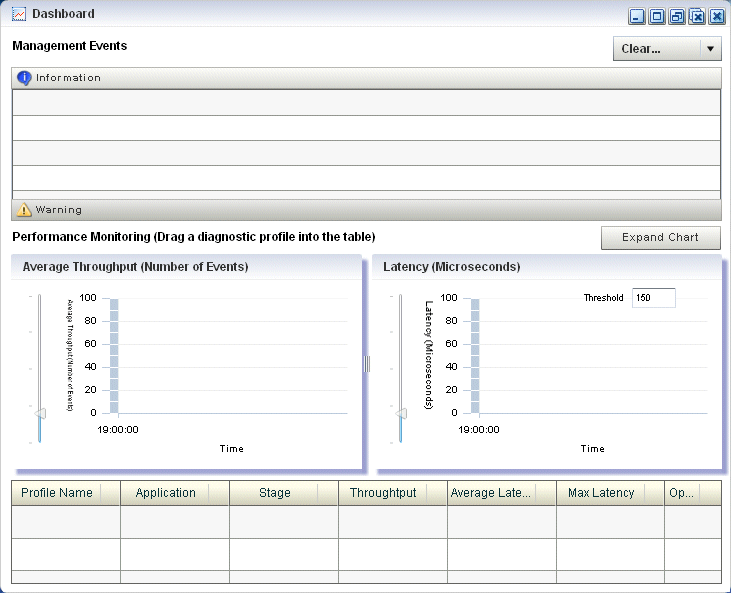
Figure 1-2 shows the Oracle CEP Visualizer dashboard: a performance management screen that you use to monitor the throughput and latency of a running application and its stages or a path between two stages. You get to the dashboard by clicking the Dashboard button in the top pane.
Figure 1-2 Oracle CEP Visualizer Dashboard
Description of "Figure 1-2 Oracle CEP Visualizer Dashboard"
The dashboard has two main sections:
-
Management Events: the section at the top of the dashboard displays information and warning messages about the incoming monitoring events. Click the Warning bar to view the list of warning messages; click the Information bar to view the list of information messages. The Oracle CEP Visualizer monitoring feature defines a set of default EPL rules that specify when these alerts show up in the Management Events table; you can change the EPL rules to customize this behavior; see Section 7.4, "Changing the dataservices Application Event Filter Rule Using EPL".
-
Performance Monitoring: the latency and throughput graphs display the amount of time it takes an event to pass through the specified stage or path in the EPN or the number of events passing through, respectively. The stage or path is defined in the diagnostic profile. The table at the bottom lists the available diagnostic profiles; when you click on a particular profile, the corresponding latency and throughput information is displayed in the graphs. See Section 4.6, "Monitoring the Throughput and Latency of a Stage or Path in the EPN" for details.
For detailed instructions on how to use this monitoring feature, see Section 4.6, "Monitoring the Throughput and Latency of a Stage or Path in the EPN".
1.2.5 Overview of the Stream Visualizer (ViewStream) Panel
The main purpose of the ViewStream panel is to allow users to watch events being published to a given HTTP publish-subscribe channel without any additional work. This is useful for debugging your application or just monitoring events flowing through the EPN.
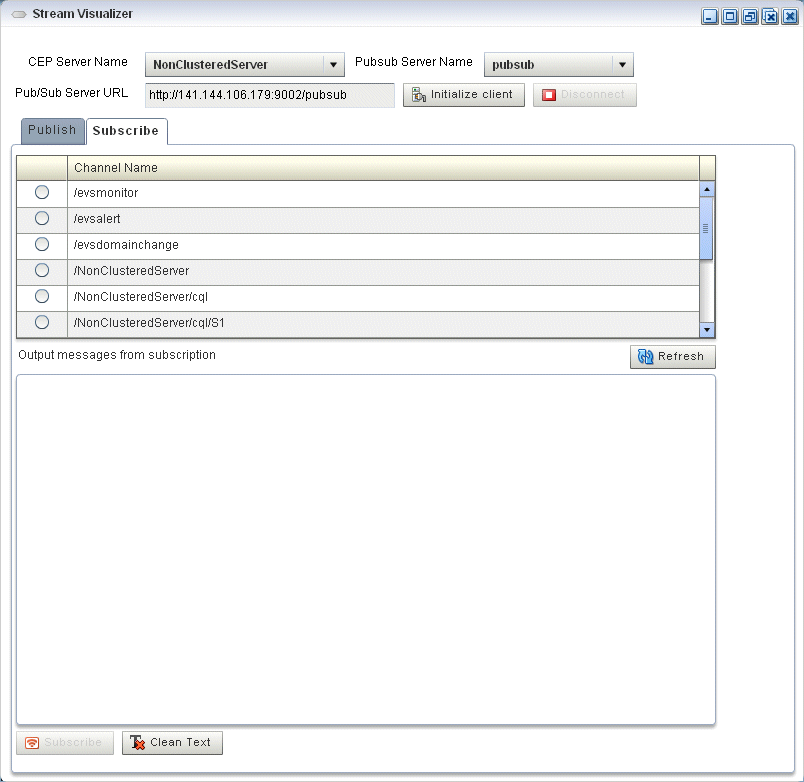
Click the ViewStream button in the top panel of Oracle CEP Visualizer, to display the Stream Visualizer panel as Figure 1-3 shows.
Figure 1-3 Oracle CEP Visualizer Stream Visualizer (ViewStream)
Description of "Figure 1-3 Oracle CEP Visualizer Stream Visualizer (ViewStream)"
The Pub/Sub Server URL text box displays the HTTP pub-sub server URL included with Oracle CEP. Click the Initialize Client button to start the process. You can either subscribe or publish a message to a channel using the options mentioned in this panel.
You can subscribe to a user or internal channel and view the events on it or you can publish to a user or internal channel.
For more information, see:
1.2.6 Overview of the Event Processing Network
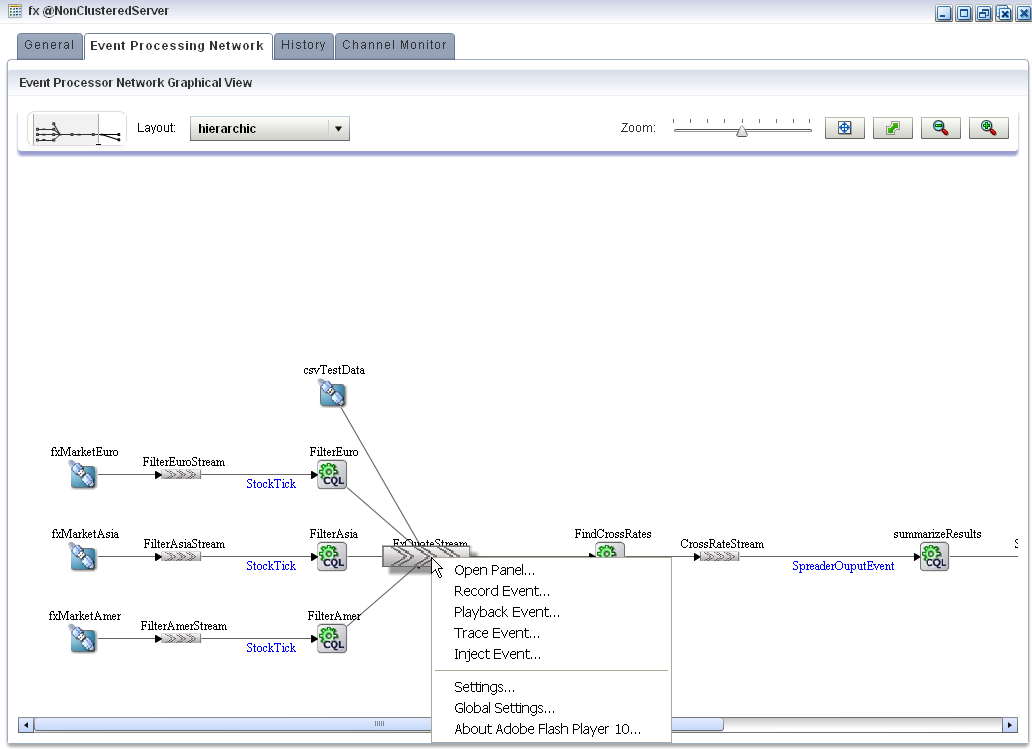
The main purpose of the Event Processing Network (EPN) panel is to give users an overall view of the stages in an Oracle CEP application and the various event types they produce and consume.
In the left pane, navigate to and expand the Applications node, select an application, and in the right pane, click the Event Processing Network tab to view the EPN as Figure 1-4 shows.
Figure 1-4 Event Processing Network Panel
Description of "Figure 1-4 Event Processing Network Panel"
1.2.6.1 Event Processing Network Context Menu
You can right-click any stage in the Event Processing Network and select one of the options from the Event Processing Network context menu that Table 1-2 describes.
Table 1-2 Event Processing Network Context Menu
| Option | Description |
|---|---|
|
|
Opens the General tab for the selected stage. See Section 4.2, "Viewing and Editing the Configuration of a Stage". |
|
|
Opens the Record tab for the selected stage. |
|
|
Opens the Playback tab for the selected stage. |
|
|
Opens the Trace Event tab for the selected stage. See Section 4.4.1, "How to Trace Events on a Dynamic Channel". |
|
|
Opens the Inject Event tab for the selected stage. See: |
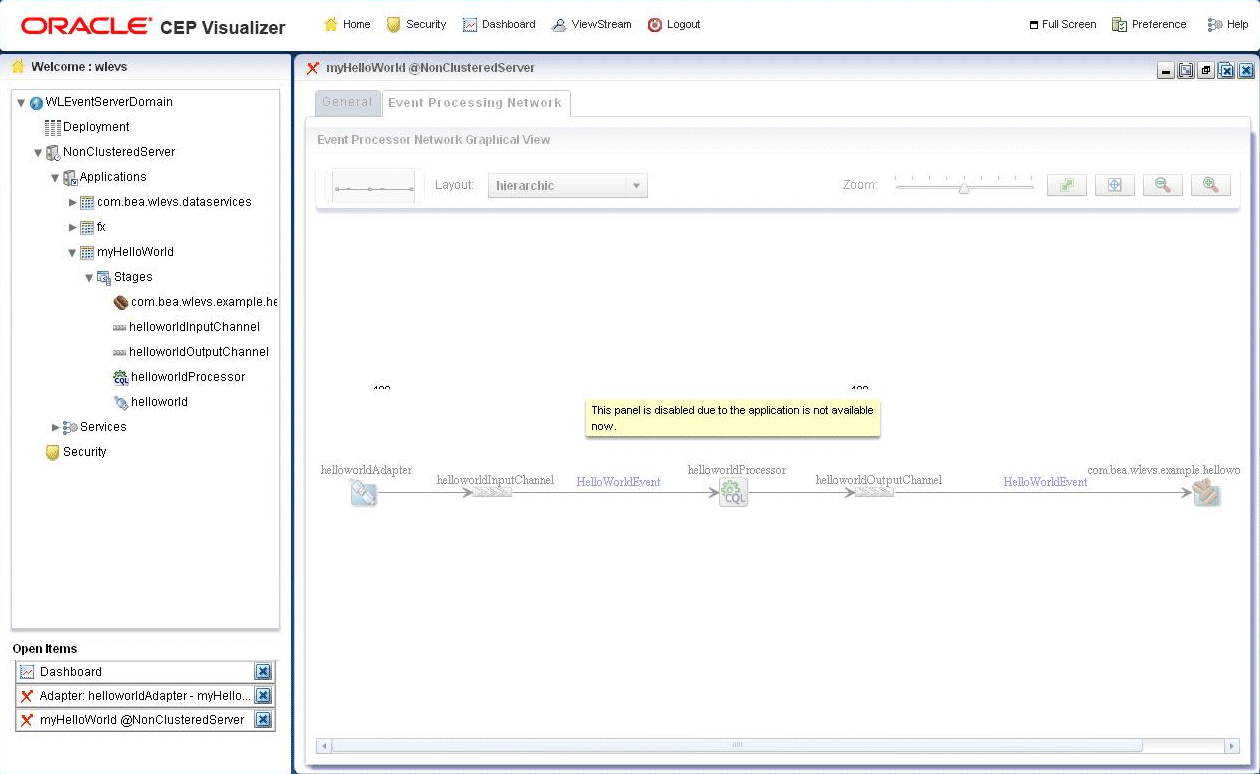
1.2.7 Oracle CEP Visualizer Panels that Require Refresh
Some operations, such as uninstalling and redeploying an application, will require you to refresh open panels.
When CEPVIS receives a notification for application re-deployment, it goes though all the affected panels that are still opened and marks the title of the panel with a red X to indicate that this panel is obsolete. To refresh such a panel, close and then re-open the panel.
For example, Figure 1-5 shows the Event Processing Network tab for an application that has been redeployed.
Figure 1-5 Event Processing Network Tab - Requiring Refresh
Description of "Figure 1-5 Event Processing Network Tab - Requiring Refresh"
1.3 Understanding Oracle CEP Visualizer Administration Tasks
This section describes the principle administration tasks you can perform using the Oracle CEP Visualizer, including:
1.3.1 Managing Oracle CEP Applications
Using Oracle CEP Visualizer, you can monitor and configure applications you develop and deploy as well as applications that Oracle CEP server deploys such as the com.bea.wlevs.dataservices application. You can monitor and configure the Event Processing Network (EPN), application lifecycle, and Oracle CQL and EPL rules.
For more information, see:
1.3.1.1 The com.bea.wlevs.dataservices Application
The com.bea.wlevs.dataservices application, called dataservices for short, is internal to Oracle CEP Visualizer and is automatically deployed every time you start an Oracle CEP server instance. You are not allowed to uninstall the dataservices application.
The purpose of this application is to provide a filter for diagnostic monitoring metrics. The application is itself an Oracle CEP application made up of adapters, streams, and a processor. The processor includes the following default EPL rule used to filter the metrics; this rule determines which event show up in the Diagnostics dashboard. The rule is as follows:
SELECT * FROM DSMonitorEvent RETAIN 1 EVENT WHERE metric > 10000
You can change this rule if you want to customize the filtering of events. See Section 7.4, "Changing the dataservices Application Event Filter Rule Using EPL" for details.
1.3.2 Managing Oracle CEP Servers
Using Oracle CEP Visualizer, you can manage Oracle CEP server instances and the services they provide such as JMX, data sources, Jetty Web server, work managers, the persistent event store, event type repository, HTTP publish-subscribe server, and logs.
For more information, see Chapter 9, "Overview of Server and Domain Tasks".
1.3.3 Managing Security
Using Oracle CEP Visualizer, you can manage Oracle CEP server and application security including users, groups, and roles, SSL, and HTTP publish-subscribe server access.
For more information, see Chapter 20, "Overview of Security Tasks".
1.3.4 Updating Configuration Data
Although you can update much of the configuration of an Oracle CEP instance and its deployed applications, not all fields can be updated. The following rules determine what fields can be updated:
-
Information in the EPN assembly file is static and thus read-only. Examples of this type of information include the stages of the EPN and how they are wired together.
-
Information in the component configuration files can be modified, although not typically added to or deleted from; the next bullet lists the two exceptions. Examples of this type of information include the maximum size and threads of a stream.
When you are allowed to update fields on a Oracle CEP Visualizer window, you will see three buttons: Edit, Save, and Cancel. Click the Edit button to modify the fields, then click Save to commit the changes to the server or Cancel to cancel.
-
The Oracle CQL and EPL rules associated with a processor and the channels associated with an HTTP publish-subscribe server cannot be modified, but you can add or delete to the existing list of rules or channels.
For these two scenarios you will see buttons for adding and deleting rules or channels; the Modify button will not be provided.
-
Some information in the Oracle CEP server's configuration file (
config.xml) can be modified, although much of it is read-only. An example of this type of information includes the configuration of work managers, the logging service, and user-defined channels of the HTTP publish-subscribe server.Note:
Do not modify or delete the internal channels of the HTTP publish-subscribe server. If you modify or delete these internal channels, Oracle CEP Visualizer will not function properlyServer configuration updates also use the three buttons: Edit, Save, and Cancel.
Note:
The preceding rules assume that you have logged onto Oracle CEP Visualizer with the required authentication credentials for performing the desired update task.
For more information, see Oracle Complex Event Processing Administrator's Guide.
1.4 Who Uses Oracle CEP Visualizer?
Oracle CEP Visualizer provides valuable services to a variety of Oracle CEP users, including:
1.4.1 Administrators
Administrators who use Oracle CEP Visualizer to connect to an Oracle CEP instance use role-based authorization to gain access. Users that successfully authenticate themselves when using Oracle CEP Visualizer are assigned roles based on their group membership, and then subsequent access to administrative functions is restricted according to the roles held by the user. Anonymous users (non-authenticated users) will not have any access to Oracle CEP Visualizer.
When an administrator uses the Configuration Wizard to create a new domain, they enter an administrator user that will be part of the wlevsAdministrators group. By default, this information is stored in a file-based provider filestore. The password is hashed using the SHA-256 algorithm. Once the domain has been created, the administrator can create new groups using Oracle CEP Visualizer, assign roles to them, and then create new users and assign them to groups.
For more information, see Section 20.1, "User, Group, and Role Management".
Note:
The security features of Oracle CEP Visualizer work only if you have security enabled for Oracle CEP server. If you disable Oracle CEP server security, then:-
Oracle CEP Visualizer does not provide default users, groups, and roles.
-
You cannot create new users, groups, and roles.
-
There is still a login page when first entering Oracle CEP Visualizer but you may enter anything for user and password.
-
Anonymous users may access the Oracle CEP Visualizer.
For more information, see "Enabling and Disabling Security" in the Oracle Complex Event Processing Administrator's Guide
1.4.2 Developers
Developers can use Oracle CEP Visualizer to view server resources (such as data sources), perform event record and playback, and trouble shoot performance issues by turning on latency and throughput statistics.
1.4.3 Business Users
Business users can use the Oracle CEP Visualizer Query Wizard to create and modify queries within a given processor. This allows rule experts to manage Oracle CQL queries and views with minimal development assistance.
1.5 National Language Support
Oracle CEP Visualizer observes Java localization and supports the use of double-byte characters in all configuration files and Oracle CEP Visualizer text entry fields.
This section describes topics of interest when using Oracle CEP Visualizer with double-byte locales, including:
Note:
By default, Oracle CEP Visualizer ships with an English resource bundle that supplies all the text that appears in the Oracle CEP Visualizer user interface.1.5.1 Configuration File Encoding: UTF-8
Oracle CEP server encodes all configuration XML files using UTF-8 encoding. This encoding is specified in the header of all Oracle CEP configuration XML files. Example 1-1 shows the encoding specified in the config.xml file.
Example 1-1 UTF-8 Encoding Attribute in Oracle CEP Server config.xml
<?xml version="1.0" encoding="UTF-8"?>
<n1:config xsi:schemaLocation="http://www.bea.com/ns/wlevs/config/server wlevs_server_config.xsd"
    xmlns:n1="http://www.bea.com/ns/wlevs/config/server"
    xmlns:xsi="http://www.w3.org/2001/XMLSchema-instance">
    <domain>
        <name>WLEventServerDomain</name>
    </domain>

    <netio>
        <name>NetIO</name>
        <port>9002</port>
    </netio>

    ...
</config>
When manually editing an Oracle CEP configuration XML file, be sure to save the file in UTF-8 encoding. Some editors will automatically save configuration XML files in the correct encoding based on the encoding attribute. However, some editors will not automatically save configuration XML files in the correct encoding. In this case, you must ensure that you select UTF-8 encoding when you save an Oracle CEP configuration XML file.
You can enter double-byte characters in any Oracle CEP Visualizer text field. The Oracle CEP Visualizer and Oracle CEP server will always write configuration XML files in the correct UTF-8 encoding.
1.6 Next Steps
For more information, see: