| Oracle® Retail Analytics Implementation Guide Release 14.1 E58117-01 |
|

 Previous |
 Next |
Retail Analytics offers a rich business intelligence solution to retail industry users. Retail Analytics is built on top of the latest Oracle technology stack and utilizes Oracle Data Integrator (ODI) for extracting, transforming, and loading (ETL) the data and Oracle Business Intelligence Enterprise Edition (BI EE) for end user reporting and analysis needs.
Retail Analytics architecture is designed to meet the retail industry's business intelligence needs in both program and report performance.
The main characteristics of the Retail Analytics product are:
Rich Reporting Capabilities: Retail Analytics offers report creation capabilities in three different flavors: Historical (As Was), Current (As Is) and Point-In-Time (PIT) in same environment. Packaged reports are provided as reference examples for users to create their own customized reports according to their needs.
Comprehensive Solution: Retail Analytics includes an end-to-end solution for reporting and BI needs of the retailer by providing data integration with source applications, transforming and loading the fact and dimension data, rolling up the data for improved query performance, Web-based graphical user interface (GUI) for report creation, shell scripts for setting up the batch schedule, and an automated installer by following business intelligence best practices.
Performant ETL Code: Retail Analytics data processing tool, ODI, offers high performance for the database batch processes on Oracle database.
Extensibility: Retail Analytics ETL code can be customized and extended for client specific needs.
Flexibility: Retail Analytics ODI and Oracle BI EE code promote flexibility during implementation based on client specific needs and help in improving batch and report performance.
Performant Reports: Retail Analytics metadata is built using Oracle BI EE and are designed to work in complex reporting scenarios.
Robust Data Model: Retail Analytics data model is designed for supporting a retailers' data needs in a business intelligence environment. Data model elements are designed to work with Oracle BI EE architecture.
This section briefly explains the fundamentals of business intelligence and data warehousing in general. It is important to understand the overall architecture and data flow for implementing Retail Analytics.
Business intelligence includes the processes, methods, and technologies adopted by organizations to answer complex business questions and for building comprehensive decision support systems. These systems help organizations in maintaining secure, conformed, and highly available data for all levels of users from top executives who make decisions based on corporate level information to managers/analysts who analyze their area and take actions based on the information.
Business intelligence is built using several processes and applications that maintain these processes by adopting latest tools and technologies. One of the main components of business intelligence is a data warehouse. A data warehouse is the repository that stores the data extracted from several source systems and modelled to perform for data loading, reporting, and ad-hoc analysis needs.
Retail Analytics has several integrated data sources, including Oracle Retail Merchandising System (RMS) and Oracle Retail Price Management System (RPM). Data from these sources is extracted, loaded and transformed to the Retail Analytics data model to support report requirements. The first step after installing the Retail Analytics application is to load the seed data into the data warehouse table using pre-packaged Oracle Data Integrator ETL programs.
Retail Analytics uses sophisticated techniques to populate the data warehouse. Explained in greater detail throughout this guide, these techniques include taking the data provided by source systems (such as RMS) and then rapidly transforming that data and loading it into the data warehouse. Techniques used to load data into the warehouse vary depending upon whether the data consists of facts or dimensions.
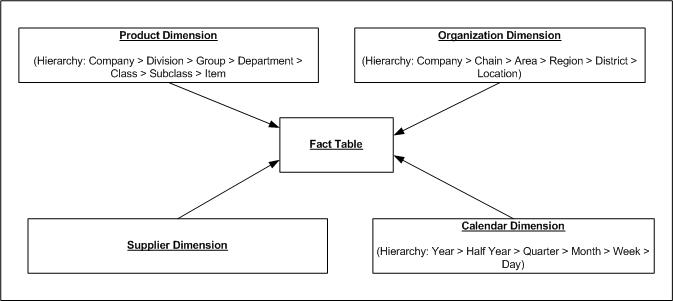
There are several fact and dimension tables in the subject areas available in Retail Analytics. Some examples of subject areas that exist in Retail Analytics include Sales, Inventory Position, and Base Cost. Each subject area has its own data mart to support reporting and analytic needs. At the center of each data mart is fact data (note that fact data here corresponds to both base fact data and aggregated data). Facts are the transactions that occur in your data warehouse's source systems, such as RMS. You may want to look at sales transaction facts, inventory stock count facts at stores or warehouses, or inventory movement facts.
Facts have little meaning by themselves because they are usually just values (for example, six sales at a store, 15 items left at a warehouse, or 300 items transferred). What gives fact data true meaning is the intersection of dimensions in which facts exist. In other words, six sales on Wednesday at store B, or 15 dishwashers in stock last Monday at the Chicago warehouse, or 300 blouses transferred during the last week in February from the St. Louis warehouse to the Denver warehouse. Dimension data, therefore, exists in the data warehouse to serve as reference data to facts.
The following diagram illustrates data elements of a generic data mart and their inter-relationships: