| Oracle® Argus Insight User's Guide, Release 7.0 E22886-01 |
|
 Previous |
 Next |
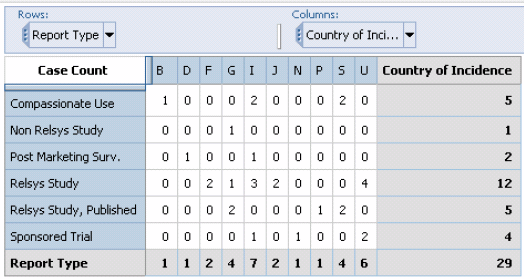
A Cube is a data model that consists of dimensions and measures. The dimensions represent key reporting aspects in rows and columns headers of the data model. At the intersection of each row and column (a cell), the Cube shows a measure, such as case, report, or event count. In this version of Argus Insight, you access Cubes through the Cognos® Analysis Studio Web Explorer interface. The interface uses a web browser and provides access to available dimensions and measures.
Using cubes enables you to run complex queries by selecting various datamart fields as dimensions and display the output on the fly. You can also select the desired measures. Use the following procedure to display the exact data you require, you can add filters, add calculations, drill down hierarchical dimensions, and statistically analyze the measures. Cubes also let you explore the interactions between different dimensions by letting you nest dimensions.
Argus Insight lets you create demand Cubes (Cubes on the Fly) based on existing standard Cubes in Argus Insight. The difference between the two types of cubes is-
Standard Cubes: These cubes are built-on the entire database.
Demand Cubes: These cubes are built on only specific case series for the required data.
The structure of a demand Cube is similar to the structure of the standard Cube you select to build the demand Cube.
The following topics explain how to work with Cubes.
Cubes Available in Argus Insight
Creating Demand Cubes
Saving Cubes Views
Refreshing Cubes
Argus Insight provides five different Cubes grouped in categories to let you analyze your safety data from Compliance, Management and Pharmacovigilance perspectives.
| Category | Cube Name |
| Compliance | Submission Statistics |
| Management | Administration Statistics |
| Pharmacovigilance | Clinical Trial Analysis
Medical Analysis Overdose-Pregnancy-Interaction |
The dimensions available in a Demand Cube depend on the type of analysis that the Cube lets you perform. The following types of measures are available.
| Measures | Available in |
| Case Count | All Cubes in Pharmacovigilance, Management and Compliance categories. |
| Case Version Count | Available in Management category, Administration Statistics Cube. |
| Record Count | Available in Compliance category, Submission Statistics. |
| Event Count | Available in Pharmacovigilance and Management categories. |
The sections that follow describe the various Cubes available in Argus Insight. For information on executing and working with Cubes, see theWorking with Cubestopic.
The Submission Statistics standard cube can be generated only for cases that have an initial or follow-up date within the last 365 days. The Submission Statistics cube lets you explore these dimensions:
| Case Creation Date Year (YYYY) Quarter (Q1, Q2, Q3, Q4) Month | Reporting Destination Country of Agency Agency |
| Dom/Frgn Country of incidence Domestic/Foreign indicator (Country of Incidence = Country of Agency or not) | Initial / Follow-up Initial Follow-up Significant or Not |
| Receipt Year Year (YYYY) Quarter (Q1, Q2, Q3, Q4) Month | Submission Indicator (Not-Required/Non-Blank/Blank Submission Date) Submission Year Month |
| StudyProtocol Number Study Number Center Number | Report Type: (SR/LIT/CT/PMS- based on derivation rule) |
| Reporter Type (HCP/Non-HCP/Unknown) (Primary Reporter only) | Intermediary |
| Fatal/LT: Fatal/LT indicator (Any event with Death or LT) | Case Seriousness (Serious/Non-Serious) |
| Case Outcome (Died/Improving/…) | Case Causality (Related / Not Related) |
| Case Listedness (Listed / Unlisted / Unknown) | Case Listedness Notes |
| Elapsed Time to Submission(Aware): Time to Submission | Elapsed Time to Submission(Generated): Time to Submission |
The Administration Statistics cube lets you explore these dimensions:
| Case Creation Date Year (YYYY) Quarter (Q1, Q2, Q3, Q4) Month | Country of Incidence: Country of incidence |
| Initial / Follow-up: Initial Follow-up Significant or Not | Receipt Year Year (YYYY) Quarter (Q1, Q2, Q3, Q4) Month |
| Study Protocol Number Study Number Center Number | Report Type: (SR/LIT/CT/PMS- based on derivation rule) |
| Case Seriousness (Serious/Non-Serious) | Case Outcome (Died/Improving/…) |
| Case Causality (Related / Not Related) | Case Listedness (Listed / Unlisted / Unknown) |
| Case Listedness Notes | Product Family: Family Name (Primary Suspect Drugs) |
| Time to Entry (In days, based on derivation rule) | Time to Central Receipt |
| Time to Lock | Lock Date Lock Year Lock Month |
| Blinding Status: Unblinded Status (Blinded / Broken by sponsor / Broken after study / Open Label Trial / Not Blinded) | Site: Master owned by Site |
| Workflow Status | Workflow Group Workflow group User Name |
Pharmacovigilance (PV) Cubes let you perform data mining for cases based on events, medical history, cause of death, and other key indicators. The Pharmacovigilance category has three Cubes: Clinical Trial Analysis, Medical Analysis and Overdose-Pregnancy-Interaction.
The Clinical Trial Analysis Cube can be generated only for clinical trial cases and enables you explore these dimensions.
| Initial Receipt Date Year (YYYY) Quarter (Q1, Q2, Q3, Q4) Month | Report Type: (SR/LIT/CT/PMS- based on derivation rule) |
| Country of Incidence | Age Group |
| Gender | Relevant History: Description PT |
| Events: (all events) SOC HLGT HLT PT LLT | Case Seriousness (Serious/Non-Serious) |
| Case Listedness (Listed / Unlisted / Unknown) | Case Causality (Related / Not Related) |
| Case Outcome (Died/Improving/…) | Leading Event/Diagnosis: Diagnosis (Yes/No) |
| Event Seriousness: (Yes/No) | Event Death: (Yes/No) |
| Event LT: (Yes/No) | Event Hospitalized: (Yes/No) |
| Event Disability: (Yes/No) | Event Congenital Anomaly: (Yes/No) |
| Event Medically Significant: (Yes/No) | Conservative Event Causality Conservative Event Causality (Derived field for the Study Drug) |
| Event Listedness Event Listedness (for the Administered/Blinded Drug and Datasheet with Name "IB") | Study Drug: (Investigational Products) Family Name Study Number Center Number |
| Administered Drug Family Name or "Blinded" <Drug> (Administered Drug or "Blinded") | Drug Type: (Suspect / Concomitant / Treatment) |
| Additional Products (only WHO Drugs) Chemical subgroup: ATC Code Pharmacological subgroup: ATC Code (ATC Text) <WHO Drug Name> (Preferred Term) | Blinding Status: Unblinded Status (Blinded / Broken by sponsor / Broken after study / Open Label Trial / Not Blinded) |
| Treatment Duration - Hours | Treatment Duration - Days |
| Treatment Duration - Weeks | Treatment Duration - Months |
| Treatment Duration - Years | Daily Dose Daily Dose |
| Route of Administration: Route of administration | Time to Onset from First Dose - Hours |
| Time to Onset from First Dose - Days | Time to Onset from First Dose - Weeks |
| Time to Onset from First Dose - Month | Time to Onset from First Dose - Years |
| Time to Onset from Last Dose - Hours | Time to Onset from Last Dose - Days |
| Time to Onset from Last Dose - Weeks | Time to Onset from Last Dose - Months |
| Time to Onset from Last Dose-Years |
You can generate the Medical Analysis standard cube only for Priority Drugs as configured by the administrator. The Medical Analysis Cube lets you explore these dimensions.

| Initial Receipt Date Year (YYYY) Quarter (Q1, Q2, Q3, Q4) Month | Report Type (SR/LIT/CT/PMS- based on derivation rule) |
| Reporter Type (HCP/Non-HCP/Unknown) | Country of Incidence |
| Age Group | Gender |
| BMI ( as per Derivation Rule) | Relevant History: Description PT |
| Events: (all events) SOC HLGT HLT PT LLT | Case Seriousness (Serious/Non-Serious) |
| Case Causality (Related / Not Related) | Case Outcome (Died/Improving/…) (Died is a derived value based on derivation rule) |
| DechallengeResult (Pos/Neg/NA/Unk) | RechallengeResult (Pos/Neg/NA/Unk) |
| Leading Event/Diagnosis: Diagnosis (Yes/No) | Event Seriousness: (Yes/No) |
| Event Death: (Yes/No) | Event LT: (Yes/No) |
| Event Hospitalized: (Yes/No) | Event Disability: (Yes/No) |
| Event Congenital Anomaly: (Yes/No) | Event Medically Significant: (Yes/No) |
| Conservative Event Causality: Conservative Event Causality | Event Listedness: BPI Event Listedness (for all Company suspect drugs and Datasheet with Name "BPI") |
| Company Product: Family Name Product Name | Drug Type: (Suspect / Concomitant / Treatment) |
| Additional Products (only WHO Drugs) Chemical subgroup: ATC Code Pharmacological subgroup: ATC Code (ATC Text) <WHO Drug Name> (Preferred Term) | Treatment Duration - Hours |
| Treatment Duration - Days | Treatment Duration - Weeks |
| Treatment Duration - Months | Treatment Duration - Years |
| Daily Dose: Daily Dose | Indication: (for Company Suspect Drugs) Indication (for Company Suspect Drugs) |
| Route of Administration: Route of administration | Time to Onset from First Dose - Hours |
| Time to Onset from First Dose - Days | Time to Onset from First Dose - Weeks |
| Time to Onset from First Dose - Month | Time to Onset from First Dose - Years |
| Time to Onset from Last Dose - Hours | Time to Onset from Last Dose - Days |
| Time to Onset from Last Dose - Weeks | Time to Onset from Last Dose - Months |
| Time to Onset from Last Dose - Years |
The Overdose-Pregnancy-interaction standard cube can be generated only for cases where at least one of the following fields is mentioned: Overdose Interaction Pregnancy Lack of Efficiency.

The Overdose-Pregnancy-Interaction Cube lets you explore these dimensions.
| Initial Receipt Date: Case Creation Date Year (YYYY) Quarter (Q1, Q2, Q3, Q4) Month | Age Group |
| Gender | BMI (As per Derivation Rule) |
| Relevant History | Events: (all events) SOC HLGT HLT PT LLT |
| Case Listedness: (Listed / Unlisted / Unknown) | Case Outcome: (Died/Improving/…) |
| Leading Event/Diagnosis: Diagnosis (Yes/No) | Event Seriousness: (Yes/No) |
| Event Death: (Yes/No) | Event LT: (Yes/No) |
| Event Hospitalized: (Yes/No) | Event Disability: (Yes/No) |
| Event Congenital Anomaly: (Yes/No) | Event Medically Significant: (Yes/No) |
| Event Outcome (Fatal/Improving/…) | · Event Listedness BPI Event Listedness (for all suspect drugs and Datasheet with Name "BPI") |
| Company Product Family Name Product Name | Drug Type: (Suspect / Concomitant / Treatment) |
| · Additional Products (only WHO Drugs) Chemical subgroup: ATC Code Pharmacological subgroup: ATC Code (ATC Text) <WHO Drug Name> (Preferred Term) | Daily Dose Daily Dose |
| Indication: (for Company Suspect Drugs) Indication (for Company Suspect Drugs) | Route of Administration: Route of administration |
| Time to Onset from First Dose - Hours | Time to Onset from First Dose - Days |
| Time to Onset from First Dose - Weeks | Time to Onset from First Dose - Month |
| Time to Onset from First Dose - Years | Time to Onset from Last Dose - Hours |
| Time to Onset from Last Dose - Days | Time to Onset from Last Dose - Weeks |
| Time to Onset from Last Dose - Months | Time to Onset from Last Dose - Years |
| Overdose (as per Derivation Rule) | Interaction (as per Derivation Rule) |
| Pregnancy (as per Derivation Rule) | Lack of Efficacy (as per Derivation Rule) |
This section provides information about using and executing Cubes. Be aware, however, that this section only discusses the basic features of Standard and Demand Cubes. For detailed information, refer to the documentation supplied with the Cognos8 products.
Refer to the section onCreating Demand Cubesfor detailed information on creating Demand Cubes
Use the following procedure to execute a Cube.
In Argus Insight, select Datamart Reports >Cubes > All. The Cubes page displays all the built-in Cubes in Argus Insight and the Demand Cubes which the group users have created.
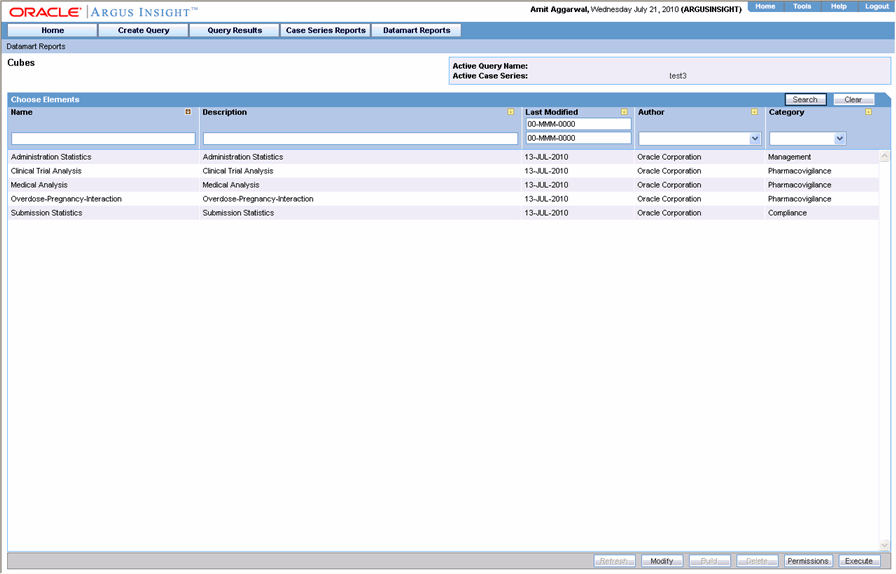
Select the Cube you wish to execute.
Click Execute. A separate Analysis Studio Explorer window displays the option to view the cube in either the Default Analysis or Blank Analysis state.
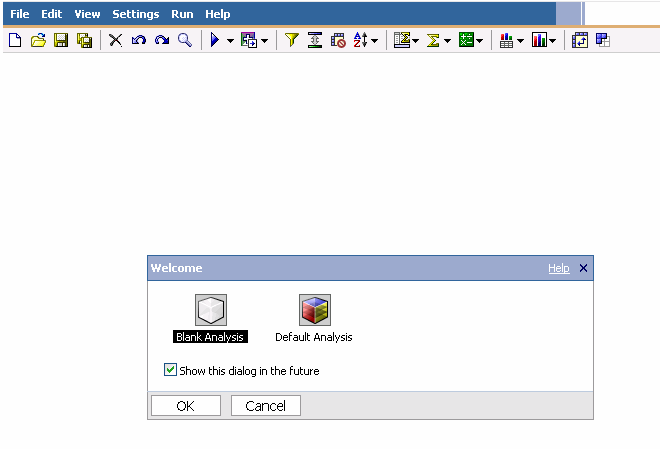
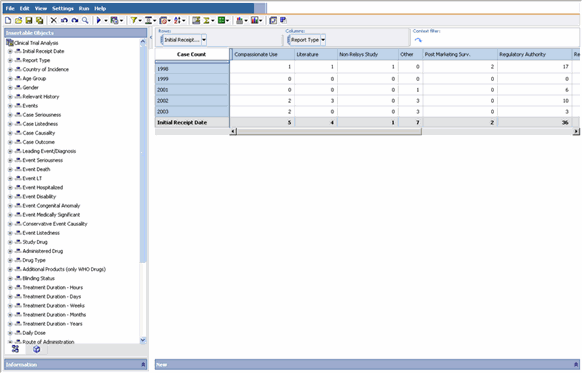
Select Default Analysis to view the Cube in the interface similar to the one shown in the following figure.
|
Tip: Alternatively you can select the Blank Analysis option. This is useful when you want to select the Cube dimensions and measures based on your analysis requirements.The Default Analysis option is helpful when you need to perform Cube analysis on the default dimensions and measures displayed in the Cube. |
The left frame of the Cognos Analysis Studio Web Explorer window displays the available dimension categories (reporting aspects) in a tree hierarchy.
The Measures folder in the tree structure contains the available measures for the Cube. The report output area in the right frame displays the Cube structure, which is similar to a crosstab report. The dimensions from the first two categories appear as rows and columns in the Cube, respectively. Use the following procedure to explore dimensions from other available categories, you can replace the existing dimensions in the Cube or nest other dimensions with the existing dimensions. You can also filter the output or drill down the dimensions in the Cube to display specific data.
The sections that follow explain the basic Analysis Studio Web Explorer options that let you work with Cubes.
You can drill-down and drill-up hierarchical dimensions to explore different aspects of your work and to move between levels of information. You can drill-down and drill-up multiple levels at a time. When you drill-down on a dimension that groups other dimensions in a row or column, some information may be removed from the Cube. For example, in a Cube that shows years and quarters asgrouped dimensions, drilling down on a specific year removes the redundant years levels.
An example to demonstrate the drill functionality follows.
Use the following procedure to drill down to the next level in a hierarchical dimension, such as Product.
Click in the area between the top-left cell (measure cell) and the first header cell of the dimension row/column as shown in the following figure.

Click the Down a Level icon in the context menu that appears. The Cube output changes to display the data for all the next level dimensions.
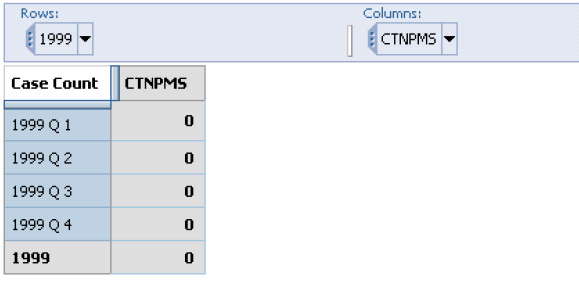
If the dimension has another lower level, you can drill down further by performing step 2.
While the above steps let you display the data for all the lower levels for all the products, you may change the reporting focus by only displaying the lower-level data for a specific product. Use the following procedure to do this, simply click on the dimension in the Cube output.
You can select a dimension to filter a Cube in order to reduce the data displayed in the Cube output. Unlike thedrilloperation, filtering does not change the existing Cube layout. Instead, it changes the measure values displayed in the Cube output according to the dimension you select as the filter. An example follows.
In the Medical Analysis Cube, the default row dimensions are from the Initial Receipt Date category and the default column dimensions are from the Report Type category. At the intersection of each row and column dimension the Cube displays the total Case Count. However, instead of viewing the total Case Count for the existing dimensions, you may wish to view the Case Counts for a specific country of incidence.
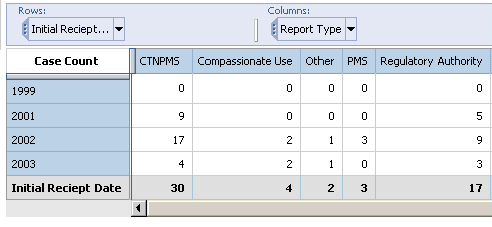
While the Medical Analysis Cube is open, the left panel in the Analysis Studio web browser window lists all the dimension categories available for the Medical Analysis cube.
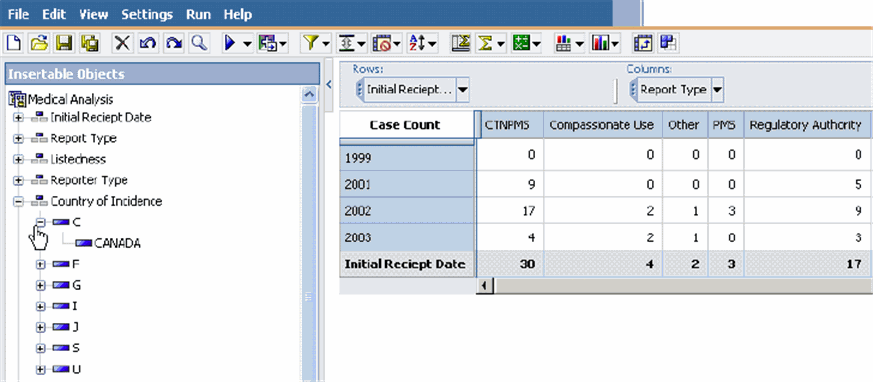
Drag and drop Country of Incidence > Canada, from the left-panel into the Context drop-down list as shown in the following figure.
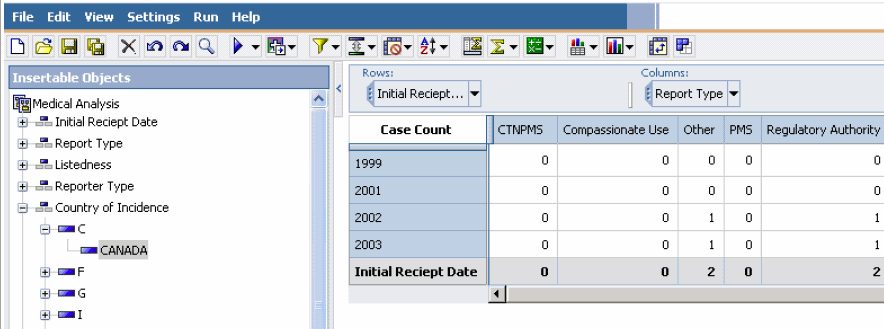
While the layout of the Medical Analysis Cube remains the same, the data in the Cube output changes to display the measure values specific to the selected country. Additionally, the Context drop-down displays Canada to indicate that the Cube output is filtered by the Canada dimension.
You can filter the output further by selecting another dimension as the filtering criterion.

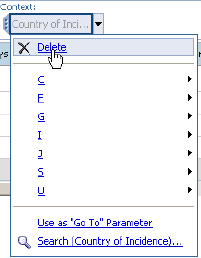
You can eitherresetthe Cube output or click the undo icon or in the Context drop-down list, right click to view the delete option. For example, to remove the filter described in the example above, select Country of Incidence>Canada in the Context drop-down and click Delete.
You may want to replace the existing row or column dimensions with dimensions from another category to observe the interaction between dimensions from different categories. Use the following procedure to do this, you can drag a category or a dimension from the left-panel of the Cognos Analysis Studio Web Explorer window into the middle of any header cell of the column or row you want to replace. An example follows.
In the Medical Analysis Cube, the default row dimensions are from the Initial Receipt Date category and the default column dimensions are from the Report Type category.
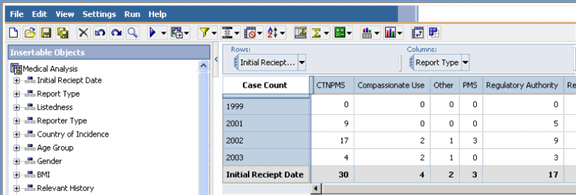
Use the following procedure to replace the existing row dimensions.
With the Drug Type dimensions , select and drag the Drug Type dimension from the left panel to the middle of any row header cell in the Cube.
The existing row dimensions in the Cube are replaced with the Drug Type dimension.
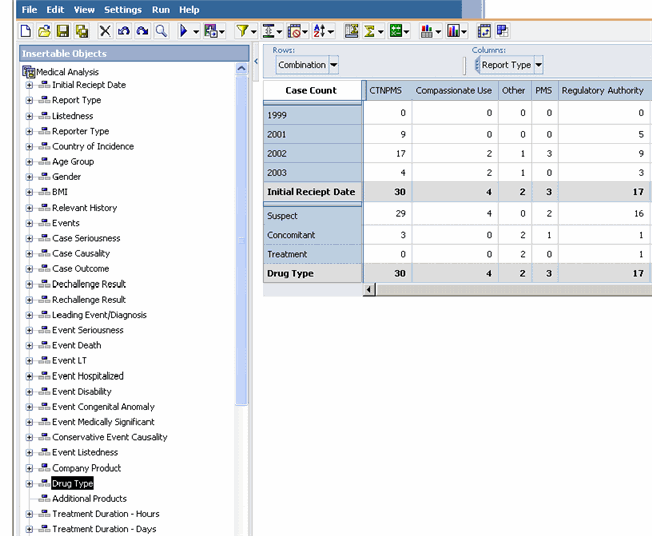
Similarly you can replace the existing column dimensions with other dimensions. You can also replace the existing row/column dimensions with a single category from a dimension by dragging the category from the left panel into the middle of a row/column header cell.
You can have multiple rows and columns in a Cube by dragging additional entities (dimensions or categories) from the tree structure into the Cube. When you add a new entity to a Cube, the output is automatically grouped to let you view data easily. Row grouping happens by the leftmost row entity and column grouping happens by the topmost column entity.
Select an entity from the tree structure in the left frame of the Analysis Studio Web Explorer window and drag it into the left or right edge of the row header area within the Cube.
The Cube output refreshes to show the grouping depending on the edge of the row header area where you dragged the new entity. 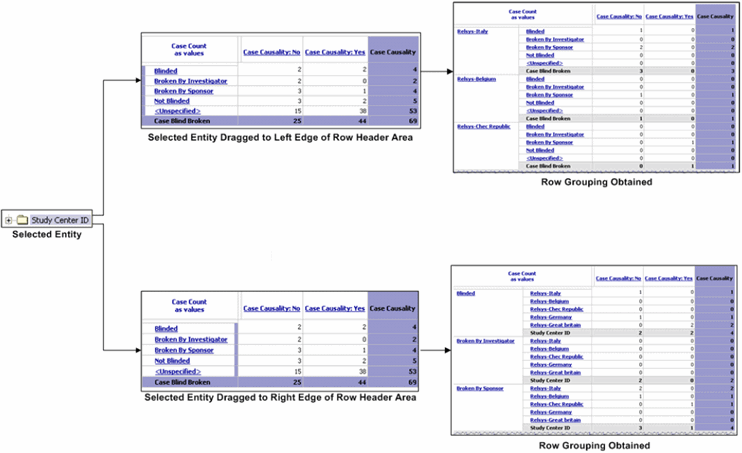
Use the following procedure to obtain a new column grouping.
Select an entity from the tree structure in the left frame of the Analysis Studio Web Explorer window.
Drag the entity to the upper or lower edge of the column header area in the Cube.
The Cube output refreshes to show the grouping depending on the edge of the column header area where you dragged the new entity. 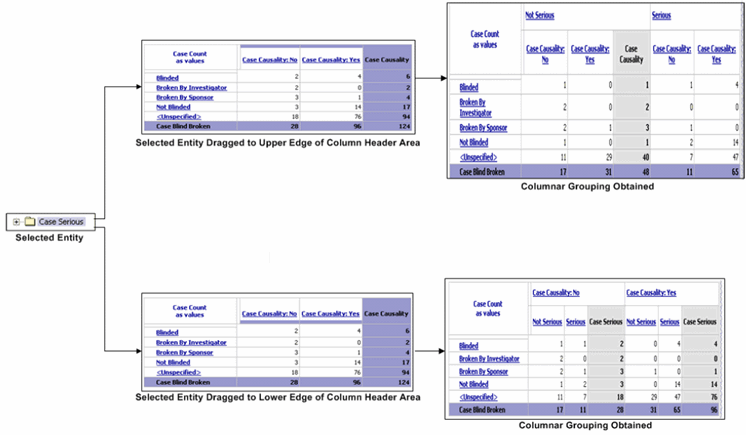
Use the following procedure to remove a dimension row from a Cube.
Click in the white space between the top-left cell (measure cell) and the first header cell of the dimension row.
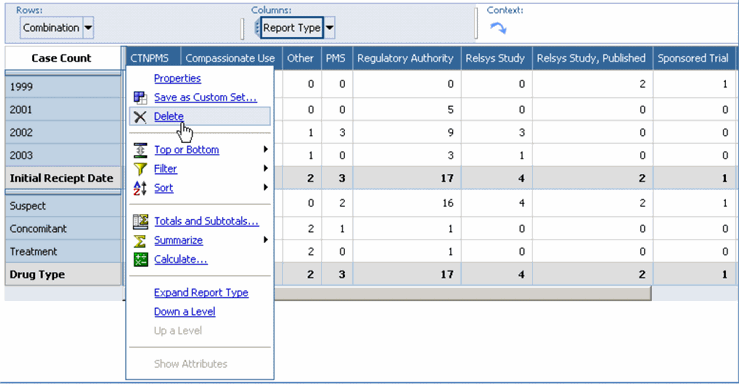
In the context menu that appears, click the Delete icon to delete the dimension row.
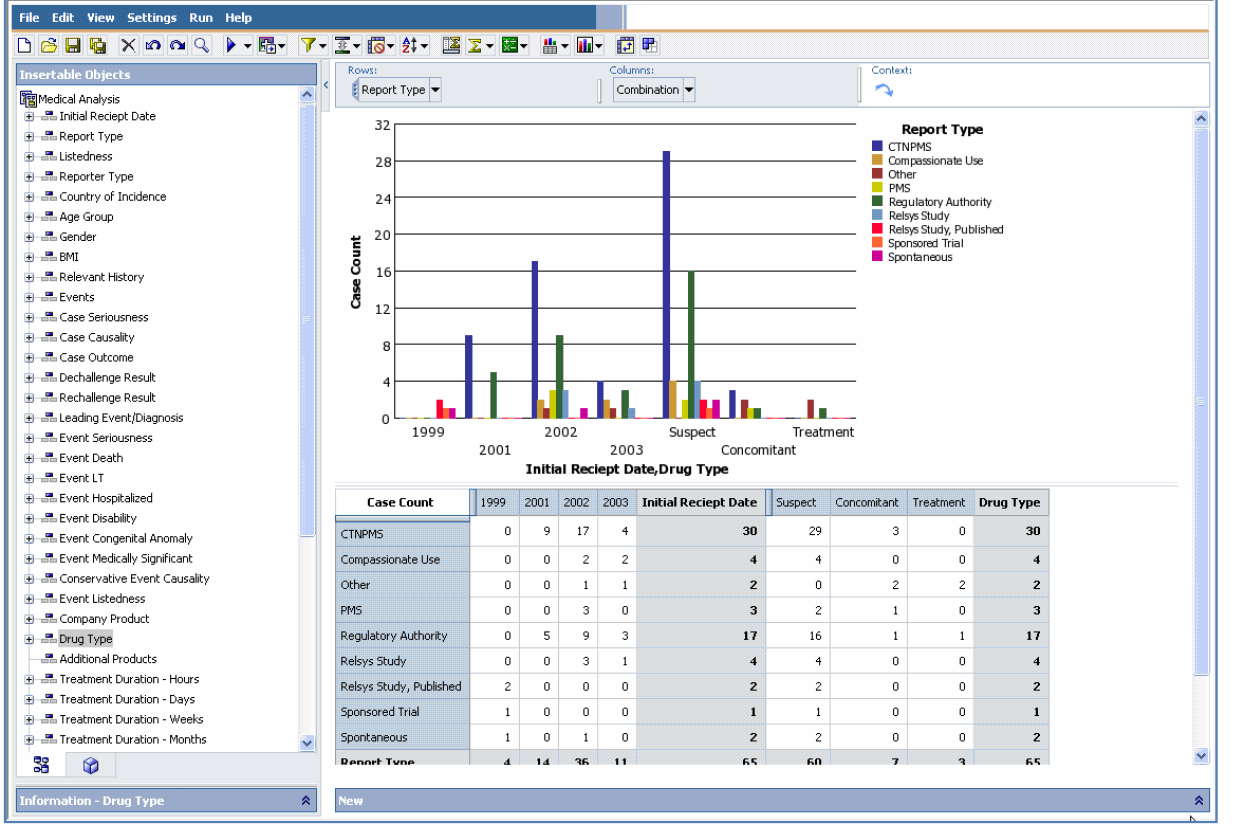
You can display a Cube as a chart to graphically see patterns and trends in data.
Perform the necessary operations on the Cube to get the desired reporting focus.
Click the arrow next to the Chart icon on the Analysis Studio Web Explorer toolbar. A context menu displays the available chart types.
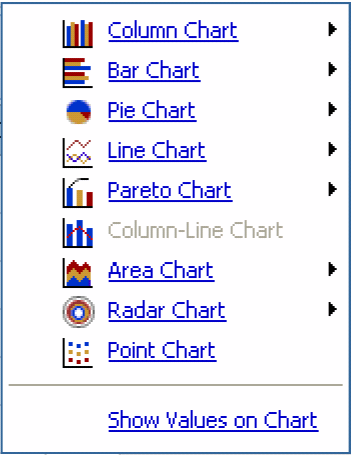
Select a chart type from the context menu, as appropriate. The report output refreshes; the chart is displayed.
Swapping Rows with Columns
You may want to swap the rows with columns in a Cube that has few rows and many columns. This improves the readability of the Cube output.
Use the following procedure to interchange rows and columns in a Cube, click the Swap icon on the Analysis Studio Web Explorer toolbar. If there are multiple/grouped rows or columns in the Cube, the outermost rows become the outermost columns, and the outermost columns become the outermost rows.
You can export the Cube output to formats, such as PDF, XLS, CSV and XML and save the file on the local machine.
Perform the necessary operations on the Cube to get the desired reporting focus.
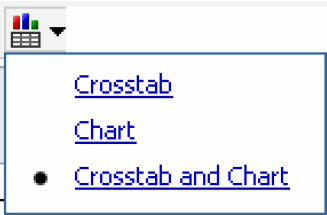
If required, change the Cube layout to a crosstab or chart ,as appropriate .
Click Run in the Analysis Studio Web Explorer toolbar. A context menu displays the available export options.
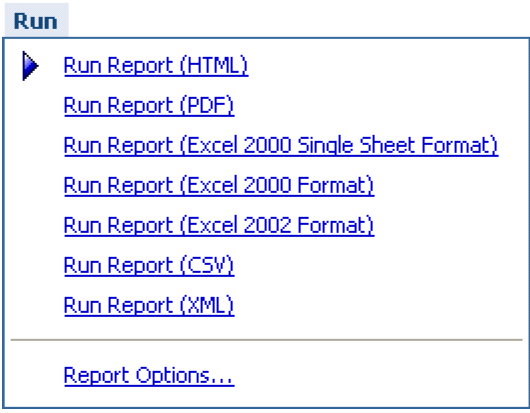
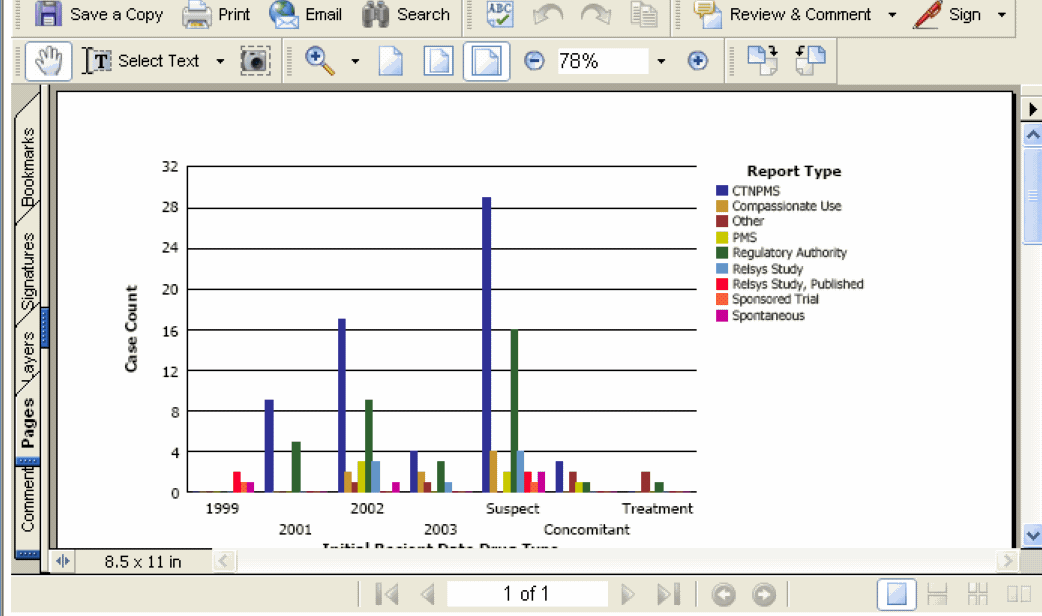
Select the desired run option. The file appears in the selected format in a new window.
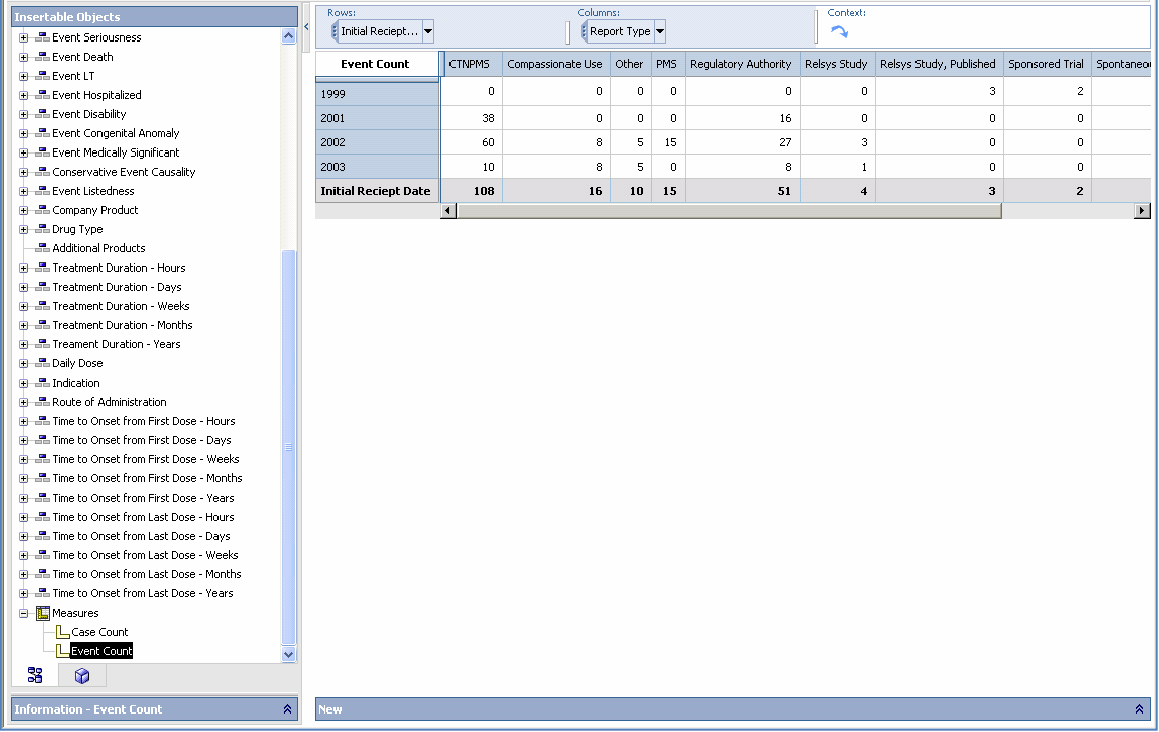
The reporting focus of Cubes that have multiple dimensions available can be changed by replacing an existing measure within the Cube with another measure. For example, Pharmacovigilance Cubes have both Case Count and Event Count as available measures. While the default measure displayed in these Cubes is Case Count, you can replace it with Event Count to change the reporting focus.
In the left panel displayed in the Analysis Studio Web Explorer window, select Measures. The measures available for the Cube are displayed.
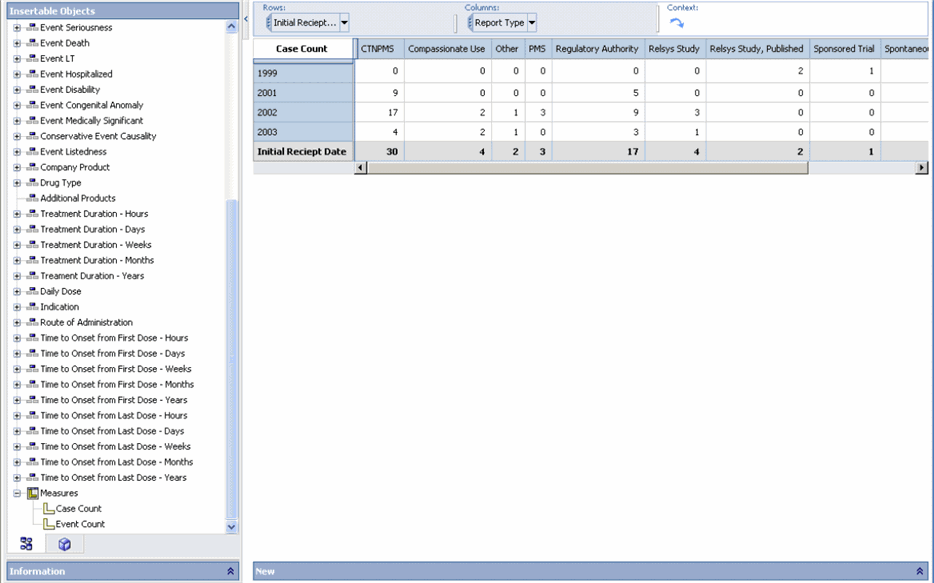
Click and drag the category required under Measure. Alternatively you can also right-click the measure in the cross-tab output and select the required option.

The crosstab output is refreshed; Event Count is the new measure added to the Medical Analysis Cube.
Use the following procedure to modify a cube.
In Argus Insight, select Datamart Reports >Cubes > All. The Cubes page displays all the built-in Cubes in Argus Insight and the Demand Cubes which the group users have created.
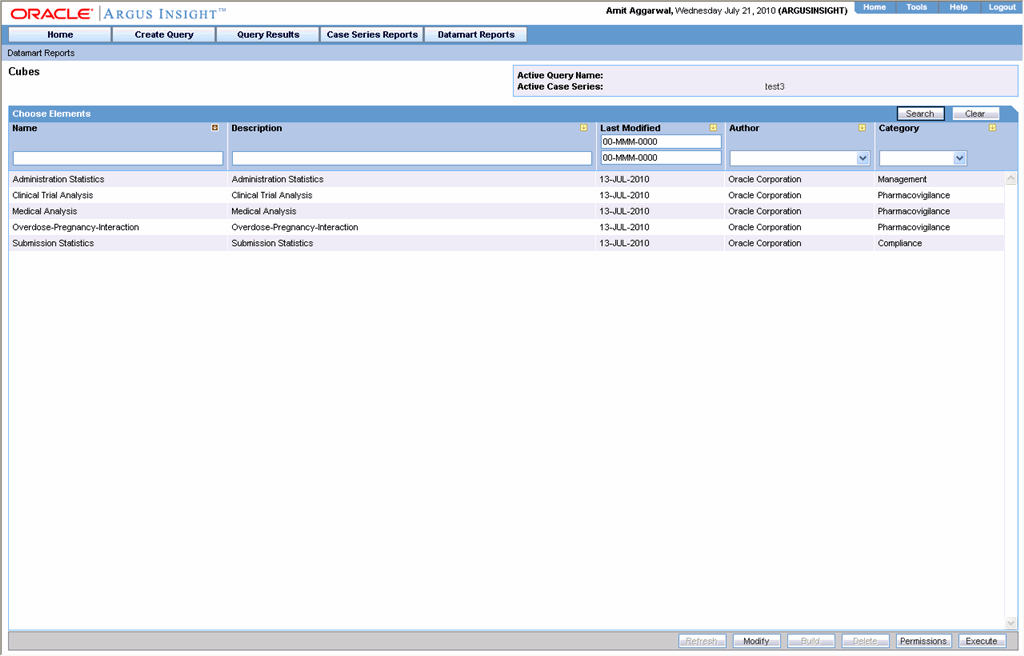
Select the required Cube and click Modify.
The Modify cube interface appears. This interface helps you to capture information to modify the Demand Cube.
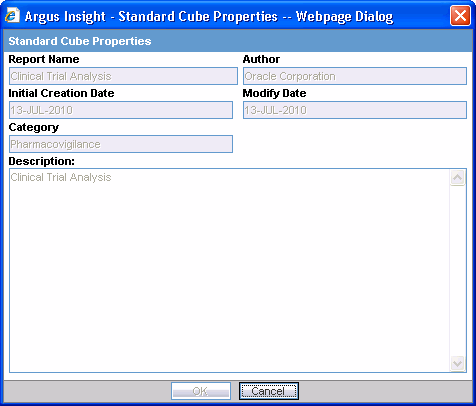
Expiration Date informs you about the expiration date of the cube. You are notified when the expiry date is due and you can save or delete the existing cube as per preference. This field is visible only for Demand cubes.
Initial Creation Date captures the date when the Cube was loaded in the repository for the first time.
Modify Date captures the date when the Cube was last modified.
ETL Run captures the date of ETL run on which the case data is based. This field is visible only for demand cubes. This field is visible only for Demand cubes.
Case Series captures the name of the case series on which the cube was built. This field is visible only for Demand cubes.
Use the following procedure to delete a cube.
In Argus Insight, select Datamart Reports >Cubes > All. The Cubes page displays all the built-in Cubes in Argus Insight and the Demand Cubes which the group users have created.
|
Note: Standard Cubes cannot be modified/deleted. |
Select the required Cube and Click Delete.
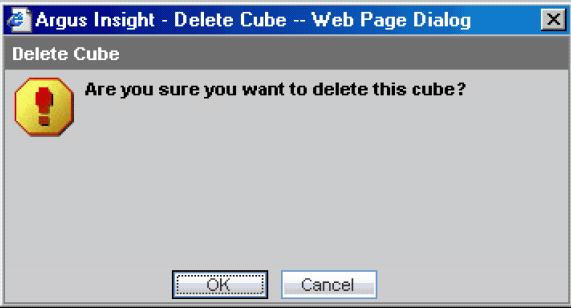
The Delete cube confirmation dialogue appears. Click OK to confirm the operation.
You can set group-level access permissions for the Demand Cubes. This determines which user groups will be able to view, modify, or delete a Demand Cube.
|
Note: You can set permissions only on Demand Cubes you have saved to the system. |
Use the following procedure to set Demand Cubes permissions.
In the Argus Insight page, select the Datamart Reports > Cubes > All.
Click Permissions. The Permissions dialog box appears. A list in this dialog box displays the names of all the groups (except the Administrator group) that the system administrator has created.
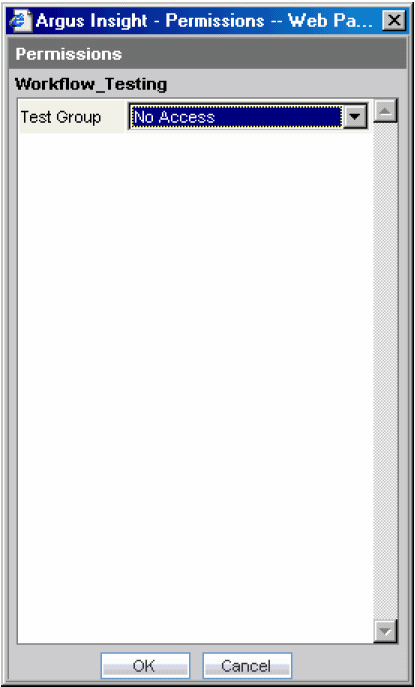
Use the list box next to a group name to assign permissions to the group members on the Demand Cube you have selected. You can select from these options:
| Permission | Description |
| No Access (Default) | No group members will be able to access the Case Series |
| Full Access | You can modify/delete/view the Cube |
Click OK. The system saves the permission settings.
Argus Insight lets you create demand Cubes based on existing standard Cubes in Argus Insight. The structure of a demand Cube is similar to the structure of the standard Cube you select to build the demand Cube. For more information on performing operations on Cubes refer to the section onWorking with Cubes.
Demand Cubes are based on a specificCase Seriesinstead of the entire datamart. Therefore, you can use demand Cubes to analyze a reduced data set based on a specific Case Series and quickly obtain the desired reporting focus without having to drill down or filter data. However, this feature makes the demand Cubes static, which means that each time the Case Series is modified, you need to delete the demand Cube and create a new one.
In Argus Insight, select Datamart Reports >Cubes > All. The Cubes page displays all the built-in Cubes in Argus Insight.
Select the standard Cube using which you wish to create the demand Cube. The Cube name is highlighted; the Build button becomes active.
Click Build. The Cube Properties dialog box appears.
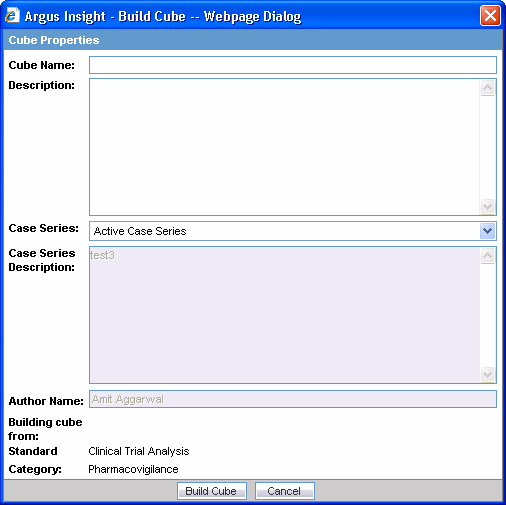
Enter the demand Cube name in the Cube Name text box.
Enter the demand Cube description in the Description text area.
Use the Case Series list box to select the Case Series on which you want to create the demand Cube. The description of the selected Case Series appears in the associated Description text area.
Click Build Cube. The Cubes - Build dialog box notifies you that the Cube has been scheduled for generation on the Cognos8 server.
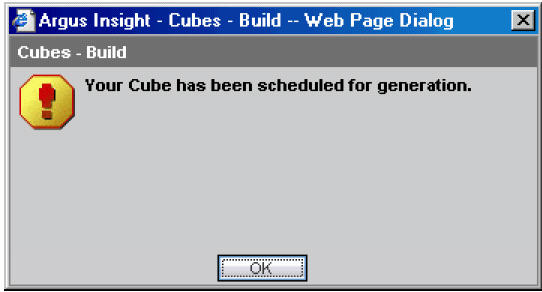
Click OK. The Cubes page displays the demand Cube name in grey.
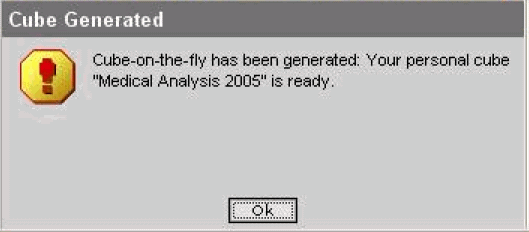
When the Cognos8 server generates the demand Cube, the Cubes Generated dialog box notifies you. After the Cube is generated, you can execute it by selecting the Cube name and clicking Execute.
|
Note: The maximum number of cases for creating Demand Cubes is configured on the List Maintenance items. |
Demand Cubes have a limited life span on the system. The system deletes the demand Cube after 14 days (default) from the date of creation. You can configure the Cube-on-the-fly Lifespan list maintenance item to set the expiration period.
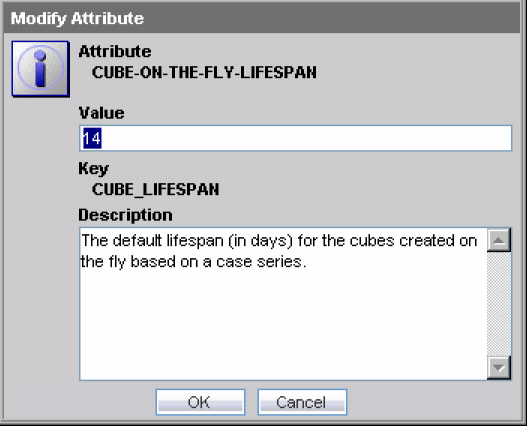
When the demand Cube has reached the expiration date, the system notifies you through the following dialog box.

At this point, you can either delete the demand Cube or retain it for another 14 days (default).
This section describes the procedure to save Cube views (based on the drilled-down data).
Use the following procedure to save Cube views.
Click Datamart Reports->Cubes All to view all the cubes

|
Tip: You can also search for specific Cubes by using any of the search options displayed on the screen. |
Select the Cube view that you want to save. The name of the cube is highlighted.
Click Execute. The Cognos Analysis Studio web explorer is displayed.

Perform the desired drill through operation. The cube view is displayed.
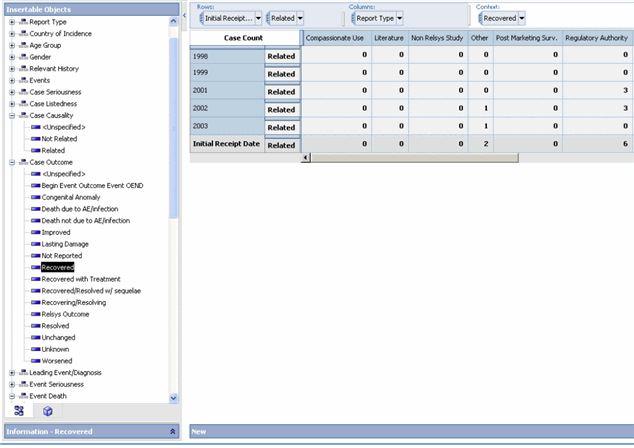
From the File menu, click Save. The Save As dialog appears.
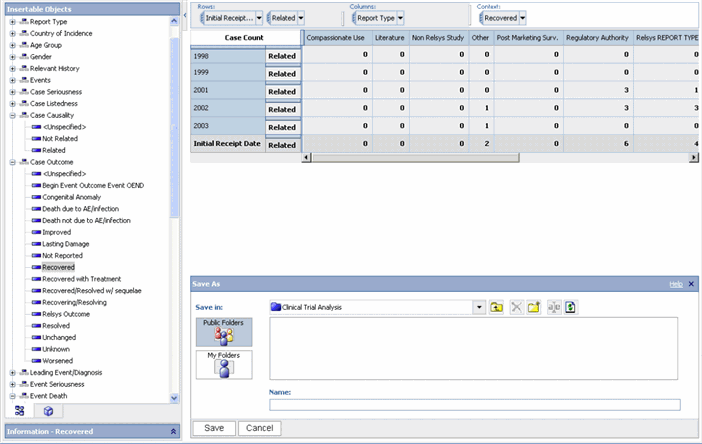
Select My Folders>CubeViews to save the cube view in the CubeViews folder.
|
Tip: If the CubeViews folder is not visible, create the CubeViews folder by clicking on the create new folder icon.When naming the folder, do not leave a space between the letters. |
Enter and save the Name of the Cube view. The Cube view is now saved.

Use the following procedure to view the saved Cube view.
Click on Datamart Reports ->Cubes -> Library option. The Cube view name appears in the list of cubes saved in the library.
|
Note: Standard Cubes: If the data mart has been updated since the last saved view, the information displayed within the cube will reflect the updated data as the view of the Cube is saved.Demand Cubes: If the data mart has been updated since the last saved view, the information displayed within the cube will remain static as it is based on static case series. |
The Cube views can only be viewed by the owner or author of the Cube View.
Although the ETL process updates the datamart on a regular basis, you need to separately update each Cube after the incremental ETL process is completed. Use A batch process needs to be set up to update the Cubes installed as part of the Argus Insight application. The batch process performs the following tasks:
Updates Cube data- the data in the Cube is updated with the latest data from the datamart
Copies the updated Cubes in the backup folder- the updated Cubes are copied into a backup folder that contains subfolders for each Cube; the backup folder path is: <Argus Insight Installation path>\PowerReports\cognos\backup\PPESCubesFor example:C:\Program Files \Relsys\PowerReports\Cognos\backup\PPESCubes
Copies the updated Cubes in the published folder - the updated Cubes are copied into the published folder at this location: <Argus Insight Installation path>\PowerReports\cognos\PPESCubes For example: C:\Program Files\Relsys\PowerReports\Cognos\PPESCubes
Individual tasks need to be scheduled to update each Cube. Use the following procedure to improve the performance of the batch process, make sure that individual batch execution processes do not overlap with each other.
|
Note: Demand Cubes are refreshed sequentially. |
This section provides instructions for scheduling batch generation using Windows Task Manager. You must perform this procedure for each of the five Cubes.
On the Cognos8 Server, select Start > Settings > Control Panel. The Control Panel window appears.
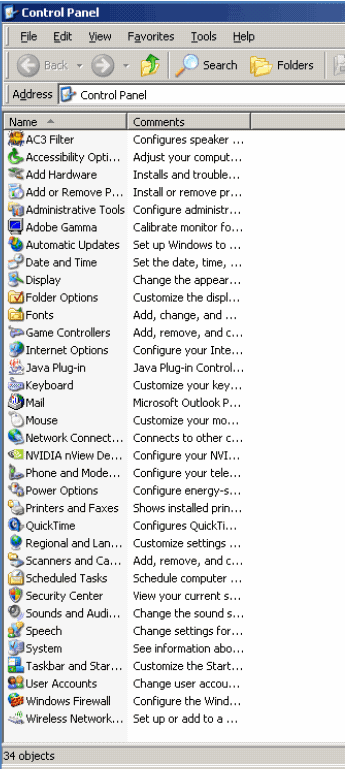
Double-click the Scheduled Tasks item. The Scheduled Tasks window opens.
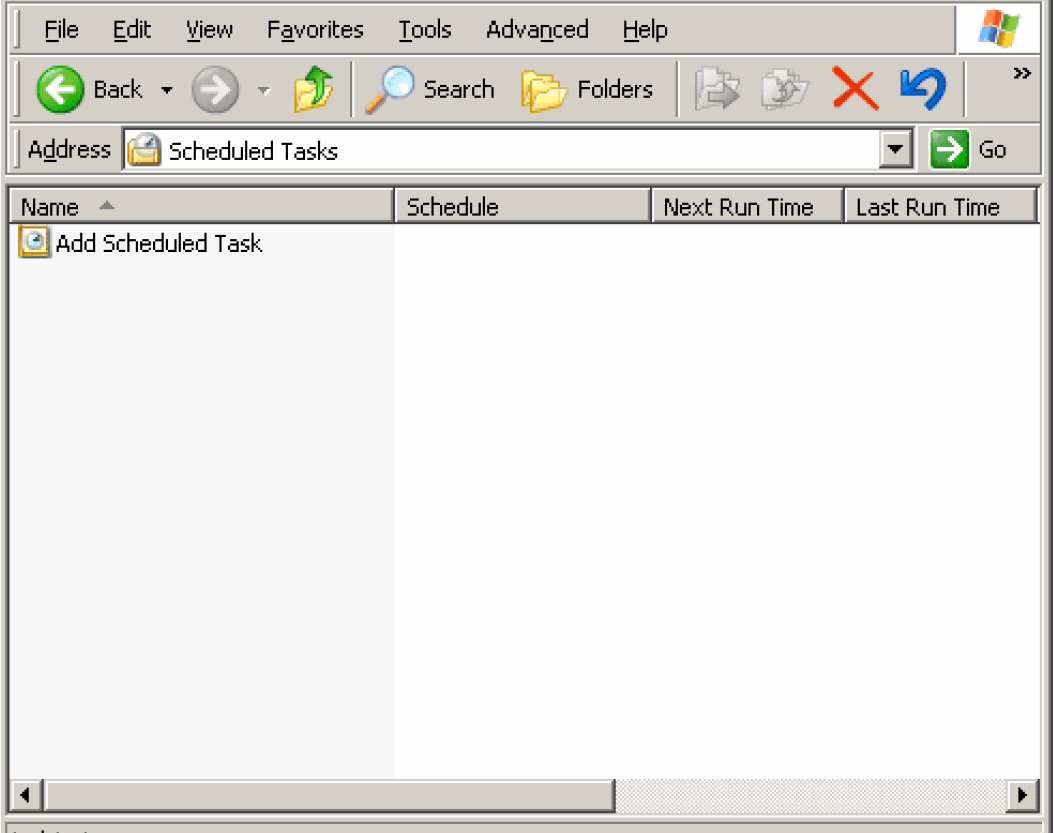
Double-click the Add a Scheduled Task item. The Scheduled Task Wizard starts.
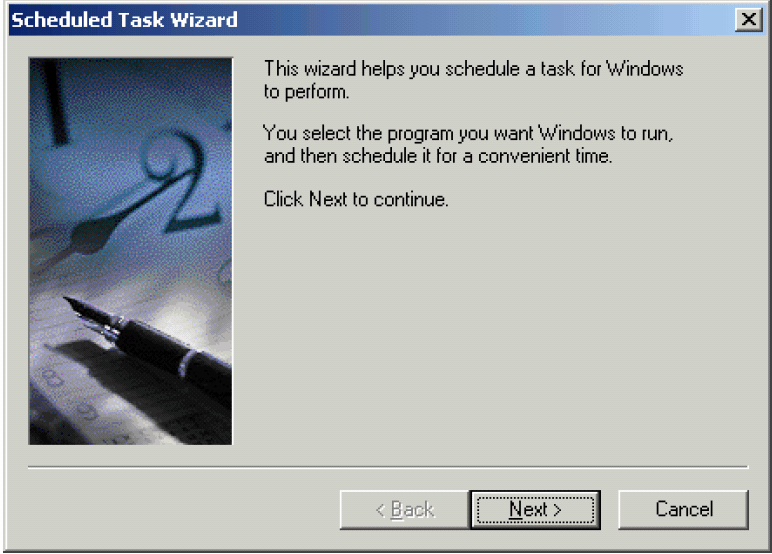
Click Next. The next screen of Scheduled Task Wizard appears.
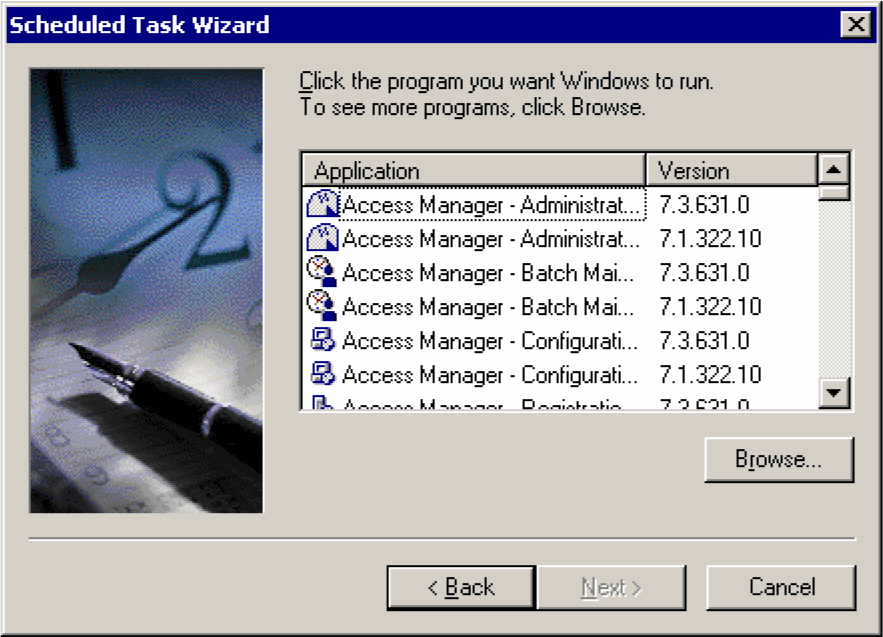
Click Browse. The Select Program to Schedule dialog box appears.
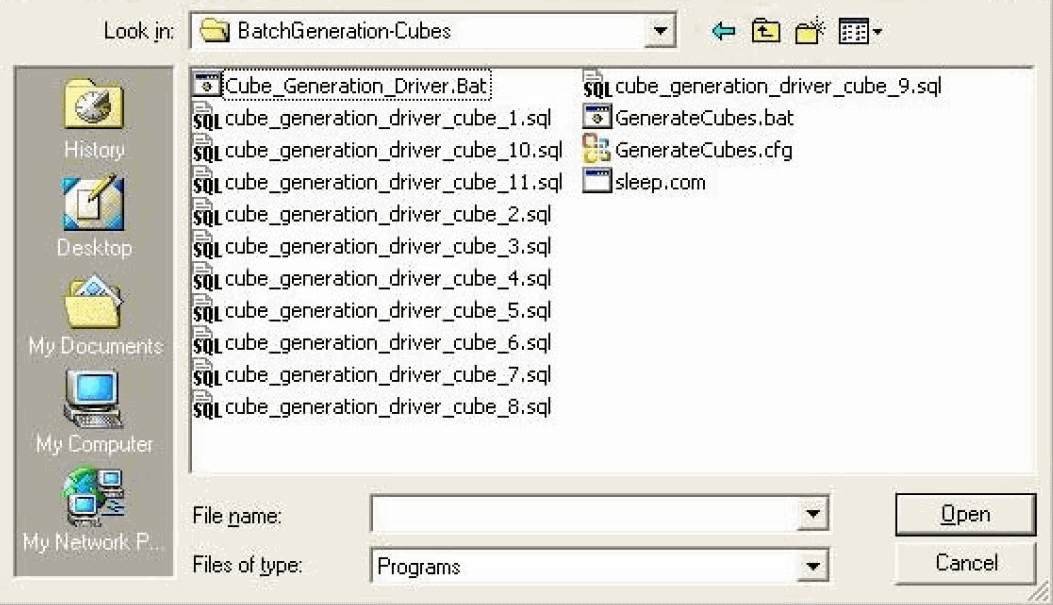
Navigate to the following location: <Argus Insight Installation Path>\PowerReports\Cognos\Cubes\BatchGeneration-Cubes
Select the Cube_Generation_Driver.bat file.
Click Open. The next screen of Scheduled Task Wizard appears.
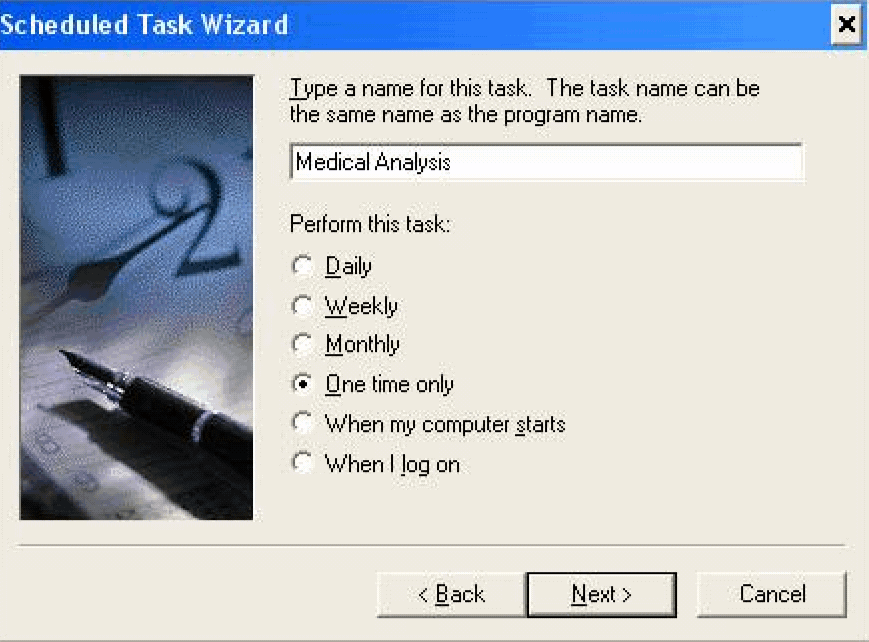
In the text box for entering the task name, type Cube Generate 1. The task name should be entered in the format Cube Generate <Cube ID>. The Cube IDs are listed in the table below.
| Cube Name | Cube ID |
| Medical Analysis | 7 |
| Clinical Trial Analysis | 8 |
| Overdose-Pregnancy-Interaction | 9 |
| Submission Statistics | 10 |
| Administration Statistics | 11 |
Use the Perform this task option button group to set the frequency of the task, as appropriate.
Click Next. The next screen of Scheduled Task Wizard appears.
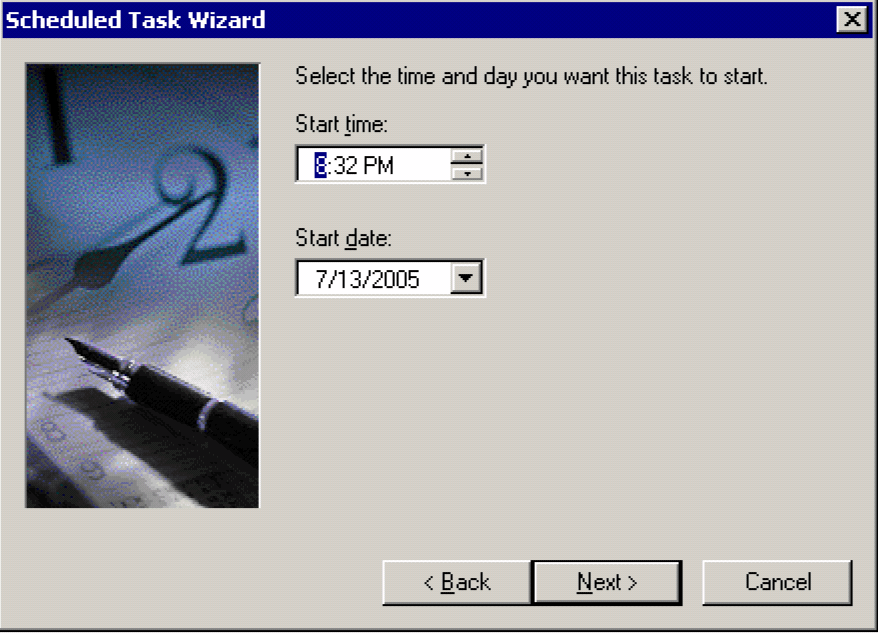
Set the start time and day.
Click Next. The next screen of Scheduled Task Wizard appears.
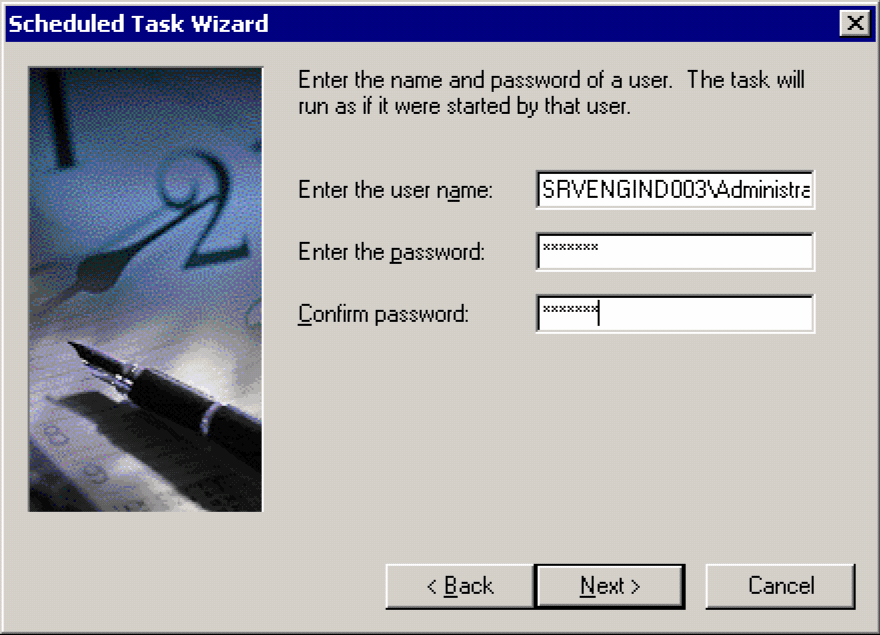
Enter the user name and password of the user authorized to run this task.
Click Next. The next screen of Scheduled Task Wizard appears.
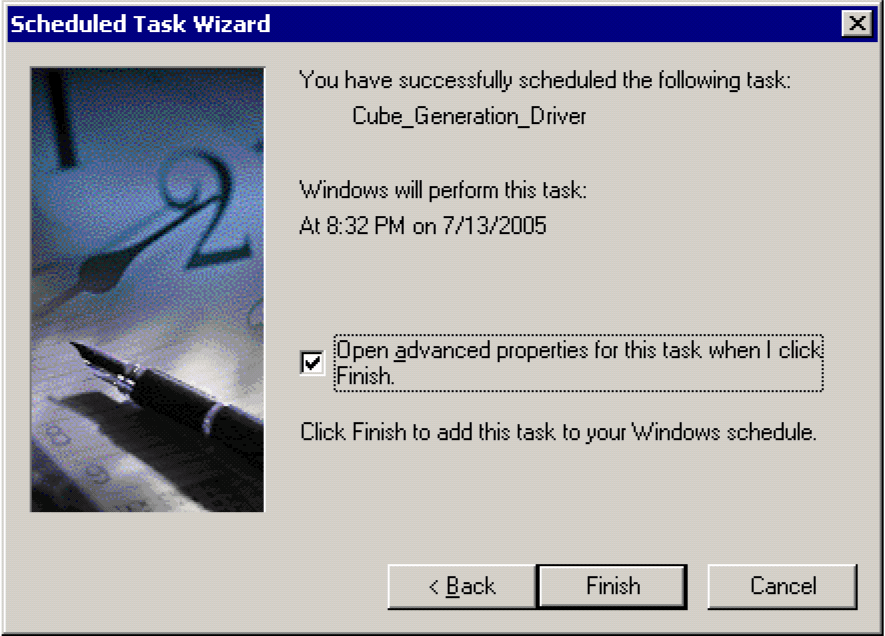
Check the Open advanced properties for this task when I click finish checkbox.
Click Finish. The dialog box for setting advanced properties for the task appears.
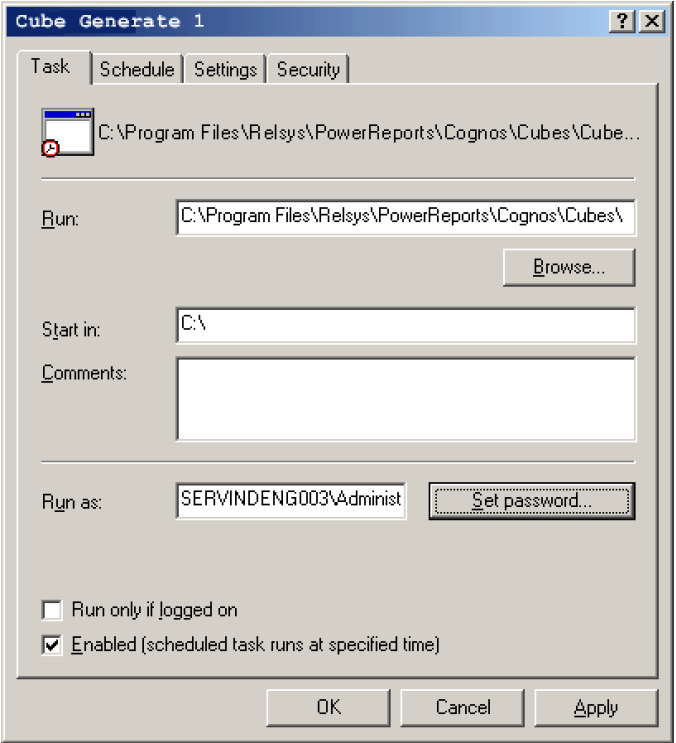
In the Run text box within the Task tab, enter the run-time parameter for this task in p[the following format: <Argus Insight Installation Path>\PowerReports\Cognos\Cubes\ BatchGeneration-Cubes\Cube_Generation_Driver.bat" <Cube ID> <Cognos user name> <Cognos password> where CubeID is the ID of the Cube for which you are scheduling the batch generation, Cognos user name is the user name of the Cognos admin user, and Cognos password is the password for the Cognos admin user. Include the double quotation marks (" ") while entering the runtime parameter. The following table lists the Cube ID for each cube and provides examples of the run-time parameter to be entered.
|
Note: The Cognos administrator password is blank in the following examples. To reset the Cognos login password, the administrator should log in to Argus Console, uncheck the LDAP authentication, reset the password, and save the change. |
Click Set Password. The Set Password dialog box appears.
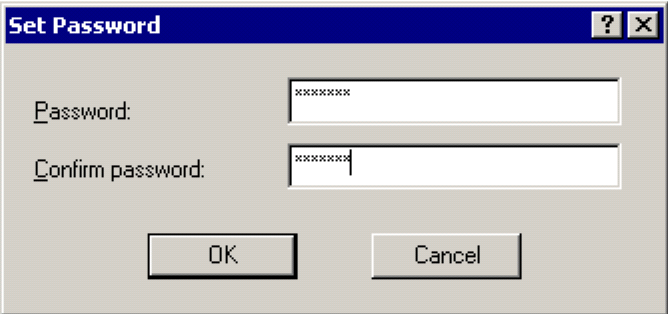
Enter the password for the Cognos8 Server admin user.
Click OK.
Select the Schedule tab. The Schedule tab page appears.
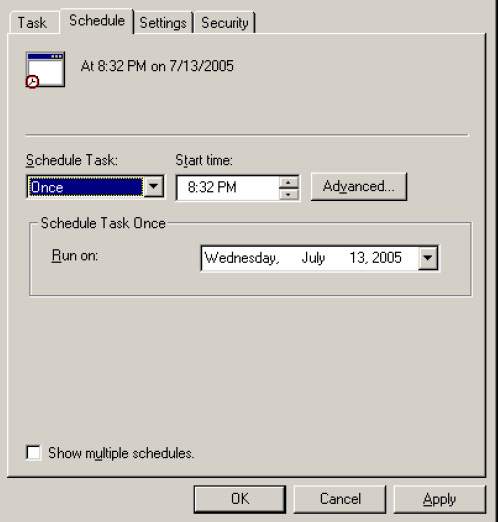
Set the schedule options, as appropriate.
Select the Settings tab. The Settings tab page appears.
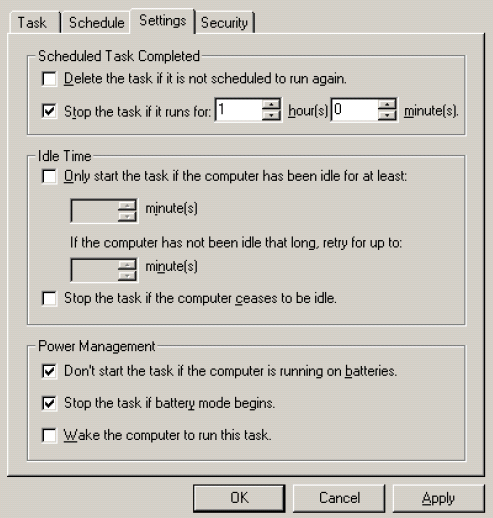
In the Scheduled Task Completed and Power Management sections, set the options as shown in the figure above.
Select the Security tab. The Security tab page appears.
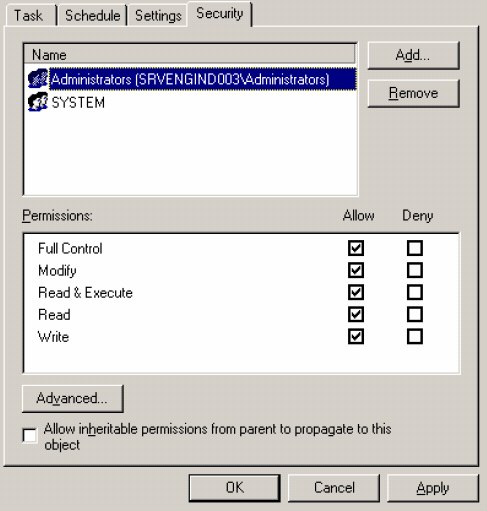
Verify that the user has full permissions assigned.
Click OK. The system creates the new scheduled task Cube Generation 1. Repeat the above steps to schedule batch generation for the remaining cubes.