The Kodo profiling capability allows for profiling of application code. It is designed to help optimize the use of Kodo, and is not intended to be a generic profiling tool. Only Kodo specific APIs are instrumented.
The profiling capability can either be used standalone
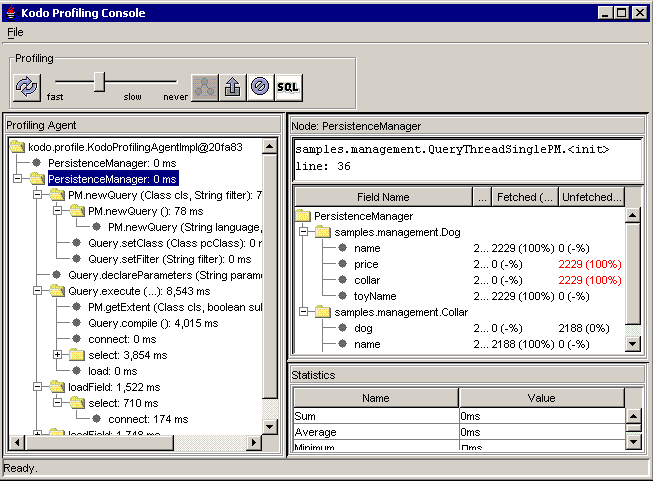
using the Kodo Profiling Console, or inside
the Kodo Management Console using the
Profiling MBean. To use the profiling capability within the
Kodo Management Console see
Section 12.4.8, “Profiling MBean”.
The Profiling capability is configured via the standard Kodo
configuration system using the
kodo.Profiling property.
This property is a plugin string (see
Section 2.4, “Plugin Configuration”), so you can also set it
to the full class name of a custom
kodo.profile.Profiling. Pre-defined
values are:
none: No profiling turned on. This is the default.gui: Turn on the local profiling GUI (see Section 13.2, “Profiling in an Embedded GUI” for more configuration information).export: Export profiling data (see Section 13.3, “Dumping Profiling Data to Disk from a Batch Process” for more configuration information).local: Enable profiling without export or GUI. Useful when trying to access theProfilingAgentprogrammatically.