 Understanding Layouts
This chapter provides an overview of layouts and discusses how to:
Convert existing layouts and reports to OpenXML format.
Compare tabular layouts, matrix layouts, and QueryLink.
Work with layouts.
Create layouts.
Understanding Layouts
PS/nVision enables you to import information directly from your database into an Excel spreadsheet, so you can spend your time analyzing results rather than summarizing data and entering it into your spreadsheet.
To specify the data you want to bring into Excel, you use a report layout. A report layout is an Excel spreadsheet used as a template to define how a report looks and the type of information that goes into the spreadsheet’s different cells. A layout does not contain data from the database. Rather, it specifies what data should be mapped directly into your report.
You do not need to create a new layout every time you run a report. After you have created a library of report layouts, select the existing layout that best suits your needs. PS/nVision keeps track of the layout used in any given report, so to run an existing report you simply select nVision, Report Request and specify the report name or simply click the Run Reports button from the NVSUSER homepage. The correct layout is loaded automatically.
Converting Existing Layouts and Reports to OpenXML FormatBeginning from PeopleTools release 8.51, all PS/nVision layouts and all report instances (that are used to perform drilldown) must be in OpenXML (.xlsx) format. If you want to use existing layouts and reports that are in Excel 2003 (.xls) format, you must convert their format to .xlsx.
To convert layouts from .xls format to .xlsx format, perform one of these methods on the PS/nVision client desktop:
If you use Excel 2007, open each layout in Excel and save the layout in .xlsx format with .xnv as file extension.
If you use Excel 2003:
Download and install MS Compatibility Pack for Office 2007.
With the compatibility pack installed, you are able to read, edit, and save files in .xlsx format.
See The Enterprise PeopleTools Installation Guide: “Setting Up Process Scheduler on Windows,” Installing OpenXML SDK.
Open each layout in Excel 2003 and save the layout in .xlsx format with .xnv as file extension.
Comparing Tabular Layouts, Matrix Layouts, and QueryLink
PS/nVision offers two kinds of report layouts: tabular layouts and matrix layouts. The major difference between them is how they specify the data to retrieve from the database. In general, tabular layouts lend themselves to detailed transaction reporting, while matrix layouts are more appropriate for summarized reporting and analysis.
Tabular layouts are simpler than matrix layouts. They use a query defined in PeopleSoft Query to retrieve data. The columns in the report correspond to the fields returned by the query; the rows in the report correspond to the rows in the query result set. You can specify a heading row, a first result row, and a totals row (if you need one). You can also use scopes in a tabular layout to filter your results.
Matrix layouts have data selection criteria based on the intersection of columns and rows in the spreadsheet, creating a criteria matrix. The data retrieved for an individual cell is determined by a combination of the criteria for its column and its row. Unless you are specifying a query in the matrix layout, all matrix layouts must have at least one TimeSpan, at least one ledger, and at least one ChartField as criteria.
You can specify a ledger, a query, or both a ledger and a query to retrieve data. For PeopleSoft Financials applications, matrix layouts most often use ledgers for data retrieval. PS/nVision knows automatically the tables to access and the fields to retrieve based on the ledger definition.
QueryLink is a PeopleSoft Query feature that enables you to send the results of a query directly to an Excel spreadsheet, bypassing the need for a PS/nVision layout. Any query results sent to Excel through QueryLink are based on the QUERY.XLT Excel template. To make any permanent changes to spreadsheets derived through QueryLink, make the changes to QUERY.XLT.
The following table shows some of the key differences between tabular layouts, matrix layouts, and QueryLink.
|
Feature/Function |
Matrix Layout |
Tabular Layout |
QueryLink |
|
Data sources |
Multiple queries and ledgers; labels. |
Single query. |
Single query. |
|
Data |
Numbers in matrix, text in labels and variables. |
Text and numbers. |
Text and numbers. |
|
Data delivery |
Matrix intersections of field criteria and queries (amounts) of label and field criteria (text). |
Selected query result columns, one data row per spreadsheet row. |
All query result columns, one data row per spreadsheet row. |
|
Layouts |
One per workbook. |
Multiple worksheets per workbook. |
None: produces one sheet in template workbook (QUERY.XLT). |
|
Selection criteria |
Scope Business Unit Effective Dates Query/Ledger TimeSpan Field Label String |
Scope Query |
Query |
|
PS/nVision variables |
Yes |
No |
No |
|
Scope |
Multiple instances from the layout workbook. |
Multiple instances from the layout workbook. |
None |
|
nPlosion |
Rows and columns. |
None |
None |
|
Drilldown from instance |
Yes |
No |
No |
|
TimeSpans |
Yes, with data keyed by year, period. |
No |
No |
|
Number of layout sheets allowed |
One |
Many |
One |
Working With LayoutsIn general, how you create a layout depends on the layout type. However, some basic tasks are common to all layout types. This section discusses how to:
Specify criteria.
Use nPlosion (matrix layouts only).
Set a TimeSpan.
Specify setIDs and business units.
Enter effective dates.
 Specifying Criteria
Data selection is the heart of the PS/nVision layout. The database values retrieved for a matrix-based report are the results of intersecting criteria defined in the matrix layout. These criteria tell PS/nVision exactly which database values to retrieve and where to put them. The values retrieved from a tabular layout are not row and column intersections but the results of a query. Each instance is a list file representing either a partial or complete answer set for that query.
You can specify data selection criteria at the level of the entire spreadsheet, a row or column, or an individual cell. Generally, you specify criteria at the highest level applicable. So, if you have criteria that apply to the entire worksheet, you specify them at the worksheet level; if you have criteria that are unique to a single cell, you apply them to that cell only.
If there is a conflict between row and column criteria, the row overrides the column criteria. Cell criteria override all other criteria, followed by row, column, and finally worksheet criteria at the lowest level of the hierarchy.
Note. nVision should not use trees with a mixture of dynamic details and range details. The results returned from the reports using such trees could be inaccurate.
See Also
Using nPlosion
nPlosion is a feature that you can specify within your field criteria. If field criteria uses a tree node value, nPlosion automatically adds rows or columns that contain the sublevels (while subtotaling) as well as detail values found under the tree nodes that you specify. This creates a group of rows or columns that can be summarized—showing just the tree node value—or expanded to show the detail values and the summarized value.
You can also use nPlosion to show detailed TimeSpan information.
See Also
Setting a TimeSpan
A TimeSpan limits query or ledger results to those from a particular period of time. Although you can use TimeSpan in a query-based matrix layout, it is more commonly used in ledger-based matrix layouts.
See Also
Specifying SetIDs and Business Units
PS/nVision uses the setID you specify when creating a matrix layout to determine available choices when you define layout criteria. If the Use Business Unit in nVision option is clear, you can omit the setID. If you enter one, it must be valid. To set the Use Business Unit in nVision option on or off, select PeopleTools, Utilities, Administration, PeopleTools Options.
Note. The Use Business Unit in nVision option is selected by default because essentially all PeopleSoft applications now use business units.
Entering Effective Dates
When you define a matrix layout, you must always enter an effective date. Like the setID, this controls which values are available for you to select when defining criteria. For some criteria, you can override the global effective date. Generally, it’s a good idea to use an effective date as late as any control (tree, department, and so on) you might want to use in the layout. The effective date used for prompting while designing a layout is not used when running the report; instead, the as of date for trees and other controls is specified in the report request when running a report.
Creating Layouts
This section describes how to:
Plan a layout.
Open an existing layout.
Create a new layout.
Save a spreadsheet as a layout.
Select a layout type.
Specify a layout definition.
Planning a Layout
Before you begin to define a layout online, you should do some planning and outlining on paper so you fully understand what data you want to retrieve, what you want the resulting reports to look like, and so on. The following checklist is a good way to make sure that you cover all bases before you start defining a layout.
Outline your report specifications on paper, showing the desired rows, columns, and headings.
Examine existing layouts and copy them, if possible, instead of starting from scratch.
Determine the naming convention for your layout, scope, report request, and instances.
Determine at which levels (worksheet, column, row, or cell) you should specify the queries and ledgers, fields, and labels you want to use as your criteria.
Identify existing PeopleSoft queries that might support your query criteria. If they don’t exist, you’ll have to create them. Do you want to use TimeSpans?
Identify existing PeopleSoft trees that might support your field criteria, because it’s simpler to use tree nodes than to specify detail values as your field criteria. Do you want to use nPlosion?
Opening an Existing Layout
You can open an existing layout to copy the report and then make minor changes to it. To open an existing layout in PS/nVision:
Select nVision, Open Layout from the nVision menu of PS/nVision (Nvsuser.)
Alternatively, click the Open Layout button.
The Open nVision Layout dialog box appears.
Select a layout (.xnv) file.
The directory this dialog box opens to is defined in the Configuration Manager.
Specify whether to create the layout as read-only.
Click the Open button.
After the file is open, select the Save as Layout option from the nVision menu and give the layout a new name.
Note. If you used Microsoft Excel 2007 to save a layout with named cell using the File Name field, when you open this layout file through PS/nVision, the named cell reference might be corrupted and the named cell details are not properly shown.
See Also
Creating a New Layout
You can create a new layout from scratch rather than basing a new layout on an existing one.
To create a new layout in PS/nVision:
Select nVision, New Layout from the nVision menu.
The Create New nVision Layout dialog box appears.
Enter a name in the File name field.
PS/nVision supports file names of up to 50 characters in length. You cannot change the default .xnv extension.
Specify whether you want to open the new layout as read-only.
Selecting this option enables you to open layouts in read-only mode. This protects shared layouts from accidental changes and eliminates Excel messages indicating that the layout is in use (or resides on a read-only network drive). Changes made to a read-only layout are not saved and are not reflected in the report instances produced.
Click the Save button.
The new layout is created, saved, and opened for you to define.
See Also
Saving a Spreadsheet as a Layout
You can save an existing Excel spreadsheet or layout as a new layout.
To save an Excel spreadsheet or layout as a new layout:
From PS/nVision, open the spreadsheet by selecting File, Open from the nVision menu.
Select nVision, Save As Layout from the nVision menu.
The Save As nVision Layout dialog box appears, which enables you to save an opening Excel spreadsheet (.xls file) as an nVision layout (.xnv file), or to save an opening layout as a new layout.
Type in a file name and click the Save button.
An Excel spreadsheet opens in PS/nVision.
Enter any text, such as headings in the columns and rows, that you need to type in manually.
Choosing a Layout Type
When you first create a new layout, the type – matrix or tabular – is not yet defined. You use the PeopleSoft nVision Layout Options dialog box to specify the layout type:
To specify a layout type in PS/nVision:
Select nVision, Layout Definition from the nVision menu.
The PeopleSoft nVision Layout Options dialog box appears.
Select either the Matrix Layout Sheet option or the Tabular Layout Sheet option.
Enter a setID, effective date, and business unit.
A setID identifies the table set you want to work with and corresponds to the set control value used in establishing table set sharing within the PeopleSoft database.
The effective date determines which values in PeopleSoft tables are valid at the time you develop the report. The effective date is not the same as the as of date that is entered in the report request. (The as of date determines the current period for data retrieval.)
The business unit represents part of your corporation that is independent with regard to one or more operational or accounting functions. PeopleSoft General Ledger business units typically comprise individual entities for accounting purposes.
Note. The values you enter here do not determine the setID and effective date used for the reports—runtime controls are specified on the report request. Instead, PS/nVision uses the setID and effective date you enter here to determine the data you can select from while creating your layout.
Click the OK button.
The nVision Layout Definition dialog box appears, prompting you to define your layout further.
Specifying a Layout Definition
You set layout options for your report using the nVision Layout Definition dialog box. The tabs at the top of the dialog box vary depending on the type of layout you are creating. Select a tab to select layout criteria or special nVision functionality for your worksheet.
A group box in the upper-left corner of the Summary tab displays information about the contents and location of the selected cells.
This is an example of the PeopleSoft nVision Layout Definition – Summary dialog box:
When no PS/nVision information is stored in the current selection, the group box appears as it does in this dialog box. The box is titled Undefined, followed by the location of the cells selected. If you have an entire row selected, the name of that row appears; the same applies to columns. If you have the entire worksheet selected, the location text is Sheet Defaults.
If the current selection contains PS/nVision information, the title of the group box reflects it. Also, the details about that information appear as the contents of the group box, as shown in this example:
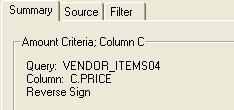
Informational group box displaying PS/nVision cell contents
Note. When you view a PS/nVision layout, you’ll notice that Row 1 and Column A are always hidden. PS/nVision reserves them to store control information, such as data selection criteria; you cannot use Row 1 or Column A in your layout. The first available column is B, and the first available row is 2. Whenever you open a new layout definition, the cell pointer is automatically placed at cell B2—the upperleft cell available for use in the layout.
To move between cells and columns, use the navigate buttons in the dialog box.
For example, clicking the right arrow moves the cell pointer in Excel one cell to the right. You can select individual cells, or you can select entire rows and columns by navigating to the uppermost and leftmost sides of the layout. You can also select the entire worksheet by navigating to the upper-left corner of the layout. The new cell selection appears in the informational section title.
This is an example of the navigate section:
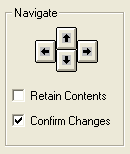
Navigate section
Select the Retain Contents option to preserve the currently displayed information in the informational group box when you navigate elsewhere. You can then apply the same information to the new cells and make only minor changes, if necessary.
Clear the Confirm Changes option to stop being prompted to save your changes each time you change the PS/nVision information and navigate elsewhere. This can save time if you are creating a new layout. When this option is cleared, changes you have made to the current row, column, and so on are automatically saved when you use the arrow keys.
The OK button closes the dialog box and enables you to access the Microsoft Excel menus or to enter text into the worksheet manually. The Clear All button removes any existing criteria from the current selection. When you click the Clear All button, the Apply button becomes available enabling you to apply your changes. You can also click the Cancel button to exit the sheet without clearing criteria.
Note. If you clicked the Clear All button and you navigate to another cell or other area of the layout, your criteria are permanently deleted unless you click the Cancel button before you move the cursor.
Six tabs appear at the top of most Layout Definition dialog boxes. Not all layout types require the same information, so not all of these tabs appear with each type of layout.
This is an example of six taps in the PeopleSoft nVision Layout Definition dialog box:
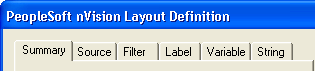
Example of the Layout Definition tabs
Using these tabs, you can specify options for your worksheet and for rows and columns. The controls on the dialog box vary depending on whether you have a cell, row, column, or the entire worksheet selected.
Possible tabs are:
|
Displays the information about the contents and location of the selected cell. |
|
|
Enables you to select query, ledger, and TimeSpan criteria as well as some nPlosion options. |
|
|
Identifies specific detail values from PeopleSoft trees. These act to limit query, ledger, and label criteria. |
|
|
Retrieves descriptive field values from either tree nodes or detail values. Like queries and ledgers, these criteria also perform the role of a data source—although the data is always textual rather than numeric. |
|
|
Displays information that is specific to each report request and report instance—for example, scope instance number, reporting period, and other information that can change when you use a different scope. |
|
|
Enables you to build multilingual layouts. Certain text strings are replaced by specially formatted strings whose user-language equivalents are retrieved from a table in the database. |
|
|
Enables you to map the layout columns to the appropriate query columns. The columns contain the data that the query returns. This tab is only available if you have selected a tabular layout. |
|
|
Enables you to select one of the Sheet Options, Row Options and Column Options. This tab is only available if you have selected a tabular layout. |