| Skip Navigation Links | |
| Exit Print View | |

|
Oracle Solaris Studio 12.3 IDE Quick Start Tutorial Oracle Solaris Studio 12.3 Information Library |
| Skip Navigation Links | |
| Exit Print View | |

|
Oracle Solaris Studio 12.3 IDE Quick Start Tutorial Oracle Solaris Studio 12.3 Information Library |
Creating an Application Project
Switching Between the Logical View and the Physical View of the Project
Adding Files and Folders to Your Project
Adding New Files to Your Project
Adding More New Files to Your Project
Adding Existing Files to Your Project
Setting Source File Properties
Creating a Project From Existing Sources
Building and Rebuilding Your Project
Creating a Project From a Binary File
Creating an Oracle Database Project
Folding Blocks of Code in C and C++ Files
Using Static Code Error Checking
Adding Source Code Documentation
Finding Class, Method, and Field Usages
Running Memory Access Checking on Your Project
Creating and Removing a Line Breakpoint
Creating a Function Breakpoint
Inspecting the State of the Application
Debugging at the Machine-Instruction Level
December 2011
This tutorial takes you through some of the basic steps of developing a C, C++, or Fortran application using the Oracle Solaris Studio 12.3 IDE.
The Oracle Solaris Studio IDE lets you create C, C++, and Fortran Application and Library projects with generated makefiles, as well as projects that have existing source code and makefiles, and projects from existing binary files.
You can build, run, and debug your project on the local host (the system from which you started the IDE), or on a remote host running the Solaris operating system or the Linux operating system.
With a C/C++/Fortran Application, Dynamic Library, Static Library, or Oracle Database project, the IDE controls all aspects of how your application is built, run, and debugged. You specify project settings when creating the project and in the Project Properties dialog box. The IDE generates a makefile in which all of your settings are stored.
A project from existing sources is built using your makefile.
Open the New Project wizard by choosing File > New Project (Ctrl+Shift+N).
In the wizard, select the C/C++/Fortran category.
The wizard gives you a choice of several types of new projects. Select C/C++/Fortran Application and click Next.
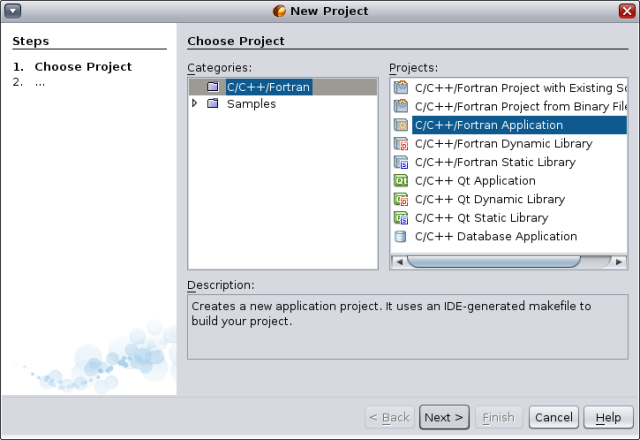
Create a new C/C++/Fortran Application project from the wizard using the defaults. You can choose the name of the project and the location of the project.
Click Finish to exit the wizard.
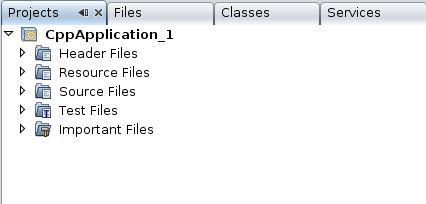
A project is created with several logical folders. A logical folder is not a directory. It is a way for you to organize your files and does not reflect where the files are physically stored on disk. Files added to logical folders are automatically part of the project and are compiled when you build the project.
Files added to the Important Files folder are not part of the project and are not compiled when you build the project. These files are just for reference and are convenient when you have a project with an existing makefile.
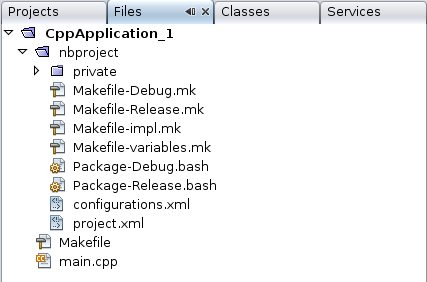
A project has both a logical and a physical view. You can switch between the logical view and the physical view of your project.
Select the Files tab. This window shows the physical view of your project. It displays files and folders as they are stored on disk.
Select the Projects tab. This window shows the logical view of your project.
You can add logical folders to your project.
Right-click the project node of your CppApplication_1 project and choose New Logical Folder. A new logical folder is added to the project.
Right-click the new logical folder and select Rename. Type the name you would like to give the new folder.
You can add both files and folders to an existing folder. Logical folders can be nested.
You can add new files to your project.
Right-click the Source Files folder and choose New > C Main File.
On the Name and Location page, newmain is displayed in the File Name field.
Click Finish.
The newmain.c file is created on disk in the project directory and added to the Source Files folder. You can add any kind of file to this folder, not only source files.
Note - You can also remove files from the folder. In this case, you do not need the main.cpp file that was added by default when you created the project. To remove this file from the project, right-click on the file name and choose Remove From Project.
Right-click the Header Files folder and choose New > C Header File.
On the Name and Location page, newfile is displayed in the File Name field.
Click Finish.
The newfile.h file is created on disk in the project directory and added to the Header Files folder.
You can add existing files to your project in two ways:
Right-click the Source Files folder and choose Add Existing Item. You can point to an existing file on disk using the Select Item dialog box and add the file to the project.
Right-click the Source Files folder and choose Add Existing Items from Folders. Use the Add Folders dialog box to add folders that contain existing files.
Do not use the New menu item to add existing items. The Name and Location panel will tell you the file already exists.
When the project is created, it has two configurations, Debug and Release. A configuration is a collection of settings used for the project, which allows you to easily switch many property settings at once. The Debug configuration builds a version of your application that includes debug information. The Release configuration builds an optimized version.
The Project Properties dialog box contains build and configuration information for your project. To open the Project Properties dialog box:
Right-click the project node of the Application project and choose Properties.
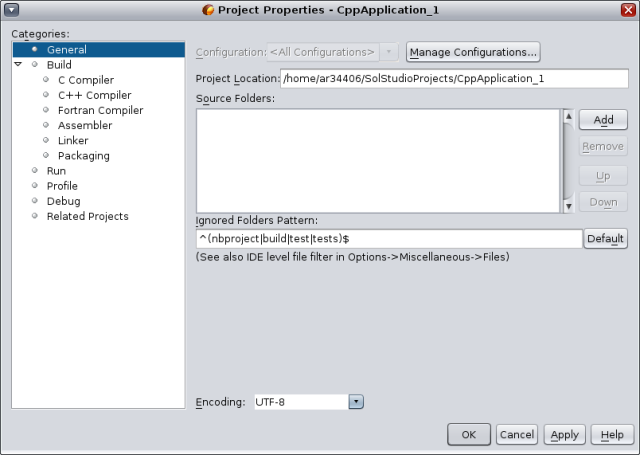
You can modify the compiler settings and other configuration settings in the Project Properties dialog box by selecting a node in the left panel and modifying the properties in the right panel. Select some of the nodes and property values and notice the properties you can set. When you set General properties, you are setting them in all configurations of the project. When you set Build, Run, or Debug properties, you are setting properties in the currently selected configuration.
Properties changed in the Project Properties dialog box are stored in the makefile for the current configuration. You can edit the default configurations or create new ones. To create a new configuration:
Click the Manage Configurations button in the Project Properties dialog box.
In the Configurations dialog box, select the configuration which most closely matches your desired configuration. In this case, select the Release configuration and click the Copy button. Then click Rename.
In the Rename dialog box, rename the configuration to PerformanceRelease. Click OK.
Click OK in the Configurations dialog box.
In the Project Properties dialog box, select the C Compiler node in the left panel. Note that the PerformanceRelease configuration is selected in the Configuration drop-down list.
In the property sheet in the right panel, change the Development Mode from Release to PerformanceRelease. Click OK.
You have created a new configuration that will compile the application with a different set of options.
When you set the project properties for your project, the relevant properties apply to all files in the project. You can set some properties for a specific file.
Right-click the newmain.c source file and choose Properties.
Click the General node in the Categories panel and see that you can select a different compiler or other tool to build this file. You can also select a checkbox to exclude the file from the build of the currently selected project configuration.
Click the C compiler node and see that you can override the project compiler settings and other properties for this file.
Cancel the Project Properties dialog box.
When you right-click a project node in the Projects window, the IDE displays a pop-up menu of actions you can perform on the selected project. If you have multiple projects open at the same time, the pop-up menu for a project node implies you are operating on that project.
Most of the project-related actions on the menu bar and toolbar operate on the main project. The main project node is displayed in bold text in the Projects window.
To change the main project in the IDE:
Right-click the desired project node and choose Set as Main Project. This project is now the main project in the IDE and actions in the menu bar and toolbar refer to this project.
To build your project:
Right-click the project and choose Build. The project builds. The build output is shown in the Output window.

Switch the configuration from Debug to PerformanceRelease in the configuration drop-down list in the main toolbar. Now the project will be built using the PerformanceRelease configuration.
Right-click the project and choose Build. The project builds. The build output is shown in the Output window.
To build multiple configurations of the project at the same time, choose Run > Batch Build Main Project and select the configurations you want to build in the Batch Build dialog box.
You can build, clean, or both clean and build the project by right-clicking the project and choosing actions from the menu. The project also keeps object files and executables from different configurations separate, so you do not have to worry about mixing files from multiple configurations.
To compile a single source file:
Right-click on the newmain.c file and choose Compile File. Only this file is compiled.
Note - Single file compilation is not supported for the project type C/C++/Fortran Project From Existing Code.
The Arguments sample program prints command-line arguments. Before running the program, you'll set some arguments in the current configuration. Then you'll run the program.
To create the Arguments_1 project, set some arguments, and run the project:
Choose File > New Project.
In the project wizard, expand the Samples category.
Select the C/C++ subcategory, then select the Arguments project. Click Next, then click Finish.
Right-click the Arguments_1 project node and choose Build. The project builds.
Right-click the Arguments_1 project node and choose Properties.
In the Project Properties dialog box, select the Run node.
In the Run Command text field, type 1111 2222 3333 after the output path. Click OK.
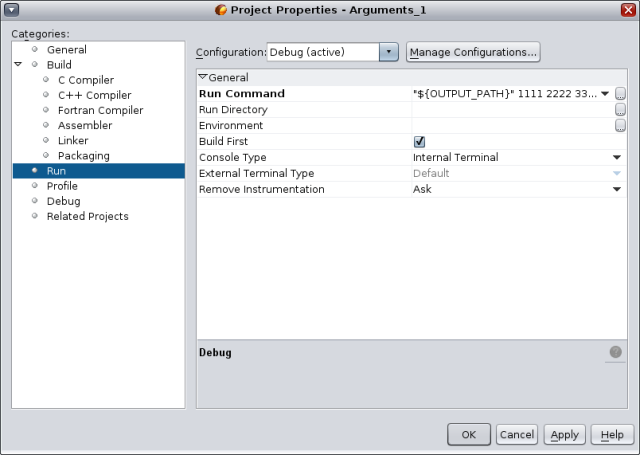
Choose Run > Run Main Project. The application builds and runs. Your arguments are displayed in an external window.
Tip - The Run Monitor tab opens when you run the project and displays profiling tools for observing your application's behavior. You can turn off the profiling tools in the Profile category in the Project Properties dialog box.
With a C/C++/Fortran Project From Existing Sources, the IDE relies on your existing makefile for instructions on how to compile and run your application.
Choose File > New Project.
Select the C/C++/Fortran category.
Select C/C++/Fortran Project From Existing Sources and click Next.
On the Select mode page of the New Project wizard, click the Browse button. In the Select Project Folder dialog box, navigate to the directory where your source code is located. Click Select.
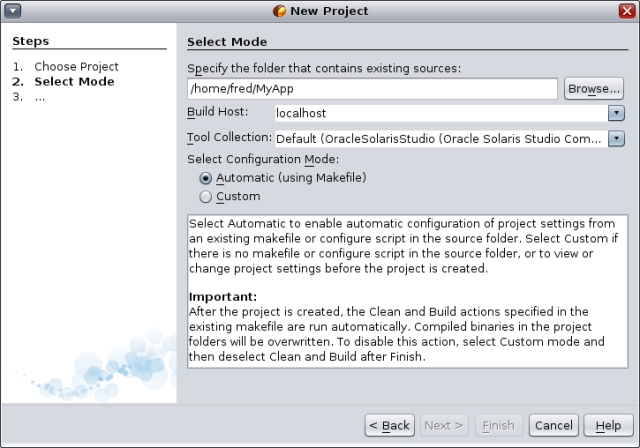
Use the default configuration mode, Automatic. Click Finish.
The project is created and opened in the Projects window, and the IDE automatically runs the Clean and Build sections specified in the existing Makefile. The project is also automatically configured for code assistance.
The project is created and opened in the Projects window. You have created a project that is a thin wrapper around existing code.
To build the project:
Right-click the project node of the project and choose Build.
To rebuild the project:
Right-click the project node of the project and choose Clean and Build.
With a C/C++/Fortran project from a binary file, you can create a project from an existing binary file.
Choose File > New Project.
Select the C/C++/Fortran category.
Select C/C++/Fortran Project from Binary File and click Next.
On the Select Binary File page of the New Project wizard, click the Browse button. In the Select Binary File dialog box, navigate to the binary file from which you want to create a project.
The root directory for the source files from which the binary was built is filled in automatically. By default, only the source files from which the binary was built are included in the project. By default, dependencies are included in the project. The shared libraries required by the project are automatically listed.
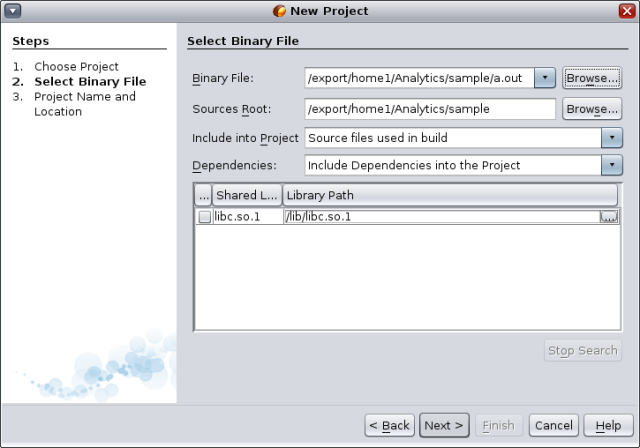
Click Next.
On the Project Name and Location page, you can choose the name and location of the project. Click Finish.
You can create a project for an Oracle Database application. In order to do so, the Oracle Solaris Studio installation you are using must include the optional Oracle Instant Client component.
Choose File > New Project.
In the New Project dialog box, select the C/C++/Fortran category and the C/C++ Database Application project. Click Next.
On the Project Name and Location page, you can choose name and location of the project. Click Next.
On the Master table page, select jdbc:derby://localhost:1527/sample from the Database Connection drop-down list. The IDE connects to the database. Select the master table for your project from the Database Table drop-down list. Use the arrow keys between the Available Columns and Columns to Include lists to select the table columns you want to include in your project.
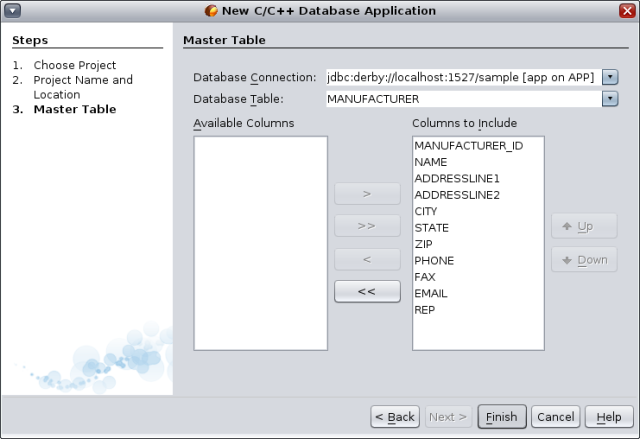
Click Finish.
You can build, run, and debug projects on the local host (the system from which you started the IDE) or on a remote host running a UNIX® operating system. Remote development lets you run the IDE locally in your familiar desktop environment, while using the computing power and development tools on a remote server to build your projects.
You can configure remote development hosts in the Build Tools tab of the Options dialog box. To add a remote host:
Choose Tools > Options, and click the C/C++ category.
In the Build Tools tab of the Options dialog box, click Edit.
In the Build Hosts Manager dialog box, click Add.
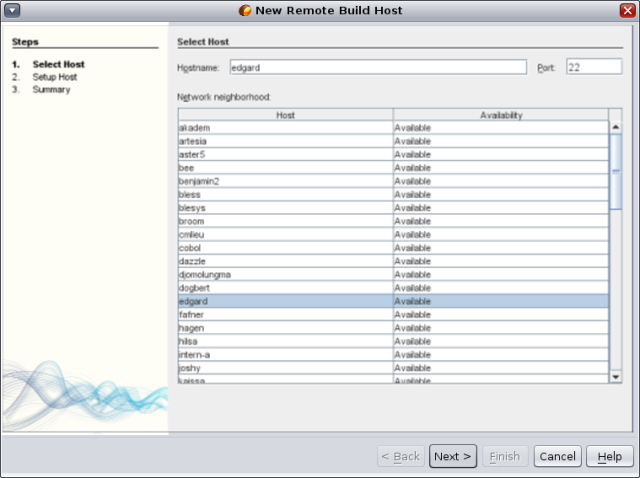
On the Select Host page in the New Remote Build Host wizard, type the system name of the host in the Hostname field or double-click an available host in the Network neighborhood list to select it. Click Next.
On the Setup Host page, type your login name in the Login field and click Next.
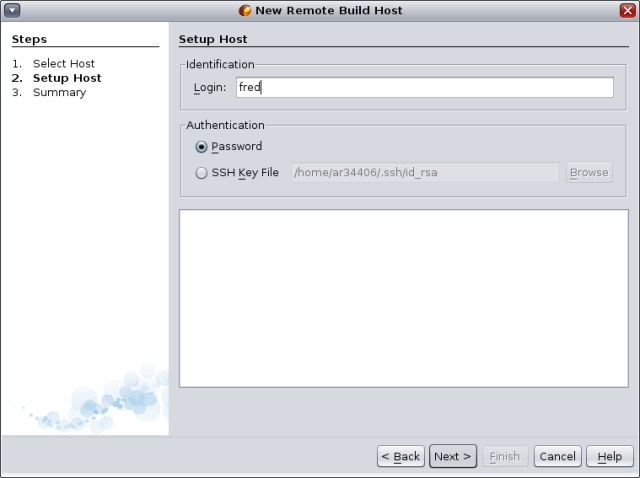
The wizard prompts you for a password, connects to the host, and displays a Summary page. Click Finish.
After the host is added to the Build Hosts list in the Build Hosts Manager dialog box, click OK.
You can set properties that specify how the IDE uses the remote host in the Services window. Expand the C/C++ Build Hosts node, right-click the remote host, and choose Properties. Set the desired properties in the Host Properties dialog box.
To set the remote host as the default build host, right-click the host in the C/C++ Build Hosts node in the Services window, and choose Set as Default.
To develop a project on a remote host, the project must be on a shared filesystem that is visible on both the local host and the remote host. Typically such a filesystem is shared using NFS or Samba. You can define the mapping between local and remote paths to project source files when you define the remote host.
When you create a project, the default build host is selected as the build host for the project. You can change the build host for the project on the Build panel of the Project Properties dialog box. You can also specify the build host when you are debugging an executable or a core file.
To work on a project that resides on a remote host on your local host, choose File > Open Remote C/C++ Project.
You can package a completed application as a tar file, zip file, Solaris SVR4 package, RPM, or Debian package.
Right-click the Arguments_1 project and choose Properties.
In the Project Properties dialog box, select the Packaging node.
Select the Solaris SVR4 package type from the drop-down list.
Change the output path if you want to use a different destination directory or filename for the package.
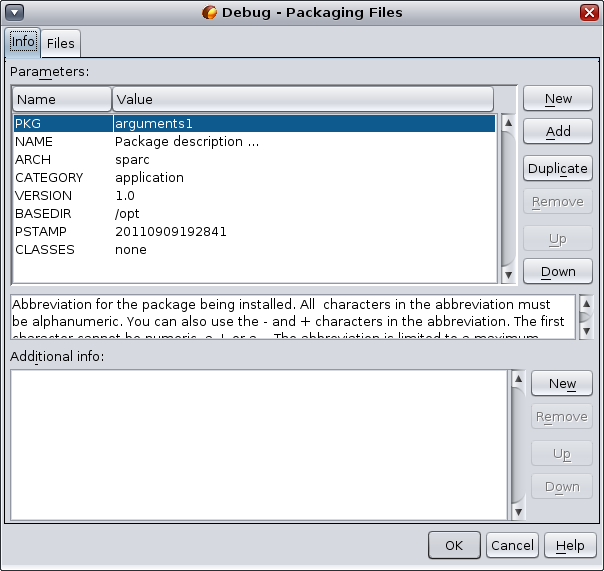
Click the Packaging Files browse button. In the Packaging Files dialog box (for an SVR4 package), modify the package parameters on the Info tab as needed.
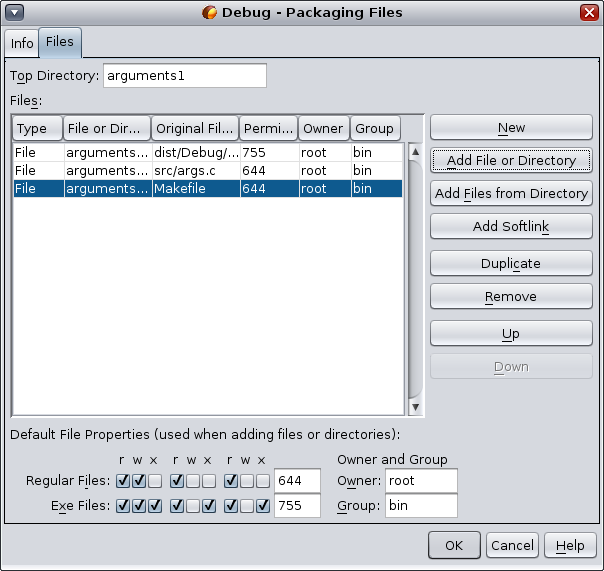
For all package types, add files to the package using the buttons on the Files tab. For each file, you can specify the path you want it to have in the package in the File or Directory Path in Package column of the Files list. Click OK when your Files list is complete.
Turn off verbose mode if you wish by clicking the checkbox.
Click OK.
To build your package, right-click the project and choose More Build Commands > Build Package.
The Oracle Solaris Studio IDE provides advanced editing and code assistance features to help you in viewing and modifying your source code. To explore these features, use the Quote project:
Choose File > New Project.
In the project wizard, expand the Samples category and the C/C++ subcategory, then select the Quote project. Click Next, then click Finish.
You can use the Options dialog box to configure default formatting style for your projects.
Choose Tools > Options.
Click Editor in the top pane of the dialog box.
Click the Formatting tab.
Select the language for which you want to set formatting style from the Language drop-down list.
Select the style you want to set from the Style drop-down list.
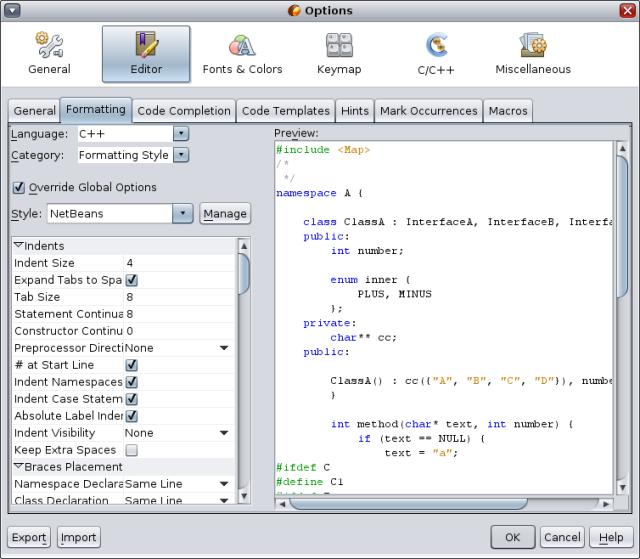
Modify the style properties as desired.
For some types of files, you can use the code folding feature to collapse blocks of code so that only the first line of the block appears in the Source Editor.
In the Quote_1 application project, open the Source Files folder, then double-click the cpu.cc file to open it in the Source Editor.
Click the collapse icon (small box with minus sign) in the left margin to fold the code of one of the methods.
Mouse over the {...} symbol to the right of the folded block to display the code in the block.
You can set an option so that when you click on a class, function, variable, or macro, all occurrences of that class, function, variable, or macro in the current file are highlighted.
Choose Tools > Options.
Click C/C++ in the top pane of the dialog box.
Click the Highlighting tab.
Make sure that all of the check boxes contain checkmarks.
Click OK.
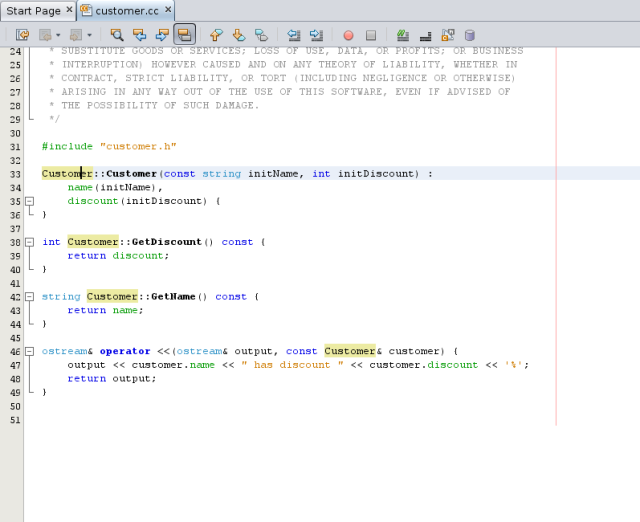
In the customer.cc file of the Quote_1 project, notice that the function names are highlighted in bold.
Click on an occurrence of the Customer class.
All of the occurrences of the Customer class in the file are highlighted with a yellow background.
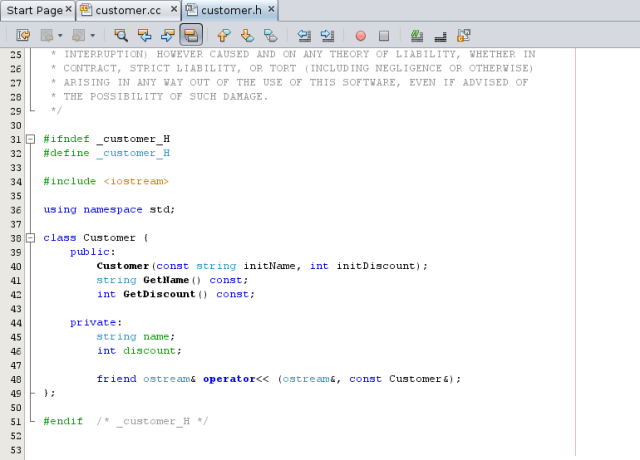
In the customer.h file, notice that class fields are highlighted in bold.
The IDE has a dynamic C and C++ code completion feature that enables you to type one or more characters and then see a list of possible classes, methods, variables, and so on that can be used to complete the expression.
Open the quote.cc file in the Quote_1 project.
On the first blank line of the quote.cc file, type a capital C and press Ctrl-Space. The code completion box displays a short list that includes the Cpu and Customer classes. A documentation window also opens and displays the message No documentation found because the project source code does not include documentation.
Expand the code completion list by pressing Ctrl-Space again.
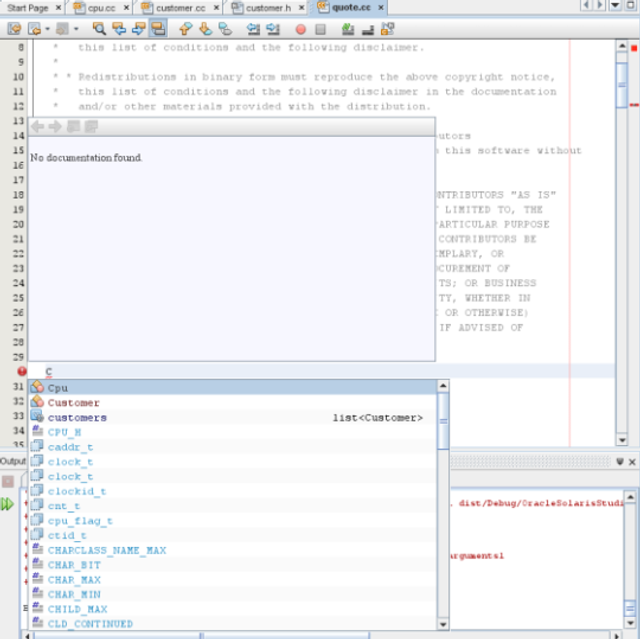
Select a standard library function such as calloc() from the list and the documentation window displays the man page for the function if the man page is accessible to the IDE.
Select the Customer class and press Enter.
Complete the new instance of the Customer class by typing andrew;. On the next line, type the letter a and press Ctrl-Space. The code completion box displays a list of choices starting with the letter a, such as method arguments, class fields, and global names, that are accessible from the current context.
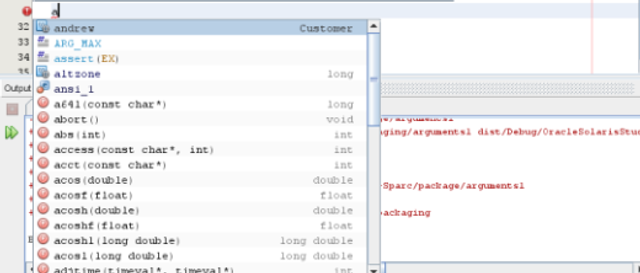
Double-click the andrew option to accept it and type a period after it. You are automatically provided with a list of the public methods and fields of the Customer class.

Delete the code you have added.
When you type code in a source or header file in the
Source Editor, the editor performs static code error checking as you type and
displays an error icon ![]() in the left margin when it detects an error.
in the left margin when it detects an error.
In the quote.cc file of the Quote_1 project, type #include "m on line 40 and notice the error icon that appears in the margin.
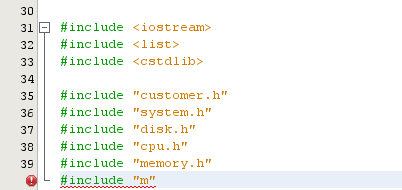
Backspace over the second quotation mark and complete the statement by typing odule.h”, and notice that error icon disappears as soon as the statement references an existing header file.
Delete the statement you have added.
You can add comments to your code to generate documentation for your functions, classes, and methods. The IDE recognizes comments that use Doxygen syntax and automatically generates documentation. It can also automatically generate a comment block to document the function below the comment.
In the quote.cc file, place your cursor on the line above the line int readNumberOf(const char* item, int min, int max) {.
Type a slash and two asterisks and press Enter The editor inserts a Doxygen-formatted comment for the readNumberOf class.

Add some descriptive text to each of the @param lines and save the file.
Click the readNumberOf class to highlight it in yellow, and click one of the occurrences marks on the right to jump to a location where the class is used.

Click the readNumberOf class in the line you jumped to, and press Ctrl-Shift-Space to show the documentation you just added for the parameters.
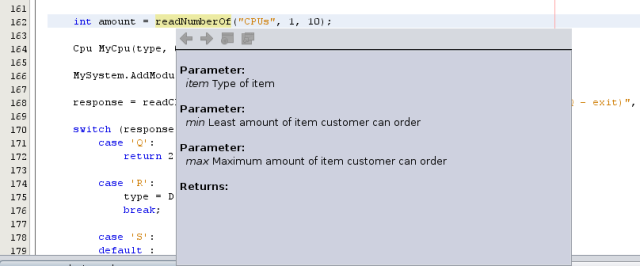
Click anywhere else in the file to close the documentation window, and click on the readNumberOf class again.
Choose Source > Show documentation to open the documentation window for the class again.
The Source Editor has a set of customizable code templates for common snippets of C, C++, and Fortran code. You can generate the full code snippet by typing its abbreviation and pressing the Tab key. For example, in the quote.cc file of the Quote_1 project:
Type uns followed by a tab and uns expands to unsigned.
Type iff followed by a tab and iff expands to if (exp) {}.
Type ifs followed by a tab and ifs expands to if (exp) {} else {}.
Type fori followed by a tab and fori expands to for (int i=0; i< size; i++) { Object size = array[i]; }.
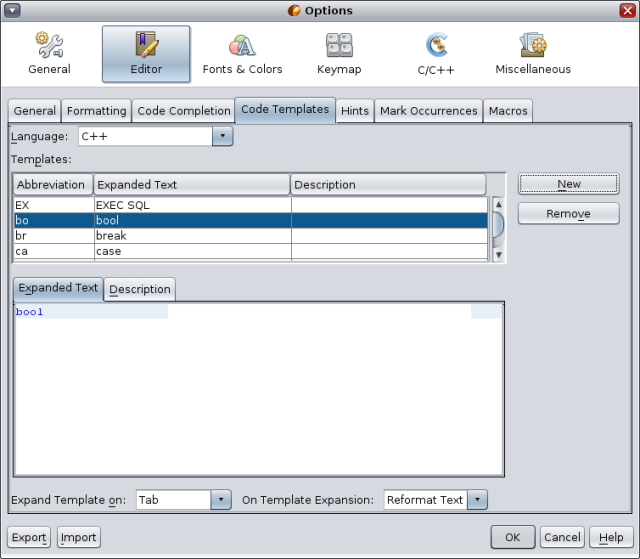
To see all of the available code templates, modify them, create your own code templates, or select a different key to expanded the templates:
Choose Tools > Options.
In the Options dialog box, select C/C++, and click the Code Templates tab.
Select a language from the Language drop-down list.
When you edit your C and C++ source file, the Source Editor does “smart” matching of pair characters such as brackets, parentheses, and quotation marks. When you type one of these characters, the Source Editor automatically inserts the closing character.
In the Quote_1 project, placed the cursor after the { on line 116 of the module.cc file and press Return to open a new line.
Type enum state { and press Return. The closing curly bracket and the semi-colon are added automatically and the cursor is placed between the brackets.
Type invalid=0, success=1 to complete the enumeration.
On the line after the closing }; of the enumeration, type if (. The closing parenthesis is added automatically and the cursor is placed between the parentheses.
Type v==null. Then type i and newline after the right parenthesis. The closing bracket is added automatically.
Delete the code you have added.
The IDE provides advanced navigation features for viewing your source code. To explore these features, continue using the Quote_1 project.
The Classes window lets you see all of the classes in your project, and the members and fields for each class.
Click the Classes tab to display the Classes window.
Expand the Quote_1 node. All classes in the project are listed.
Expand the Customer class.
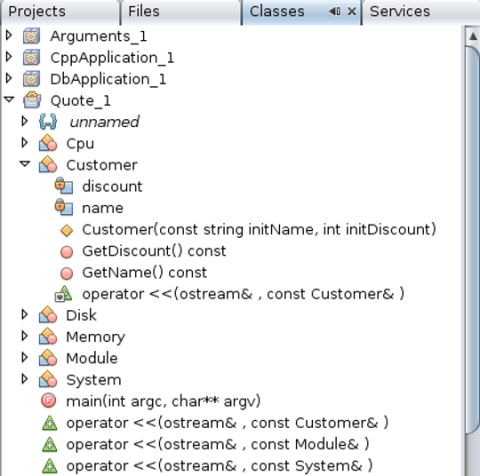
Double-click on the name variable to open the customer.h header file.
The Navigator window provides a compact view of the file that is currently selected, and simplifies navigation between different parts of the file. If the Navigator window is not open, choose Window > Navigating > Navigator to open it.
Click anywhere in the quote.cc file in the Editor. window.
A compact view of the file is displayed in the Navigator window. Click the node a the top of the window to expand the view.
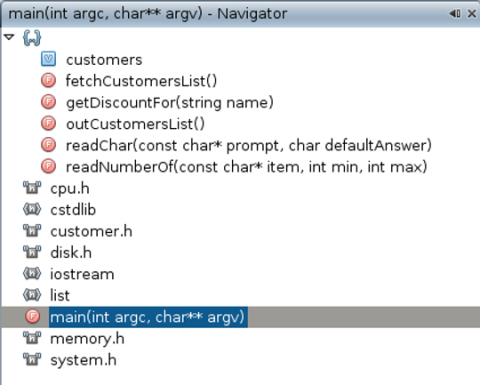
To navigate to an element of the file, double-click the element in the Navigator window and the cursor in the Editor window moves to that element.
Right-click in the Navigator window to see options for sorting the elements in the window, grouping the items, or filtering.
To see what the icons in the Navigator window represent, open the IDE online help by choosing Help > Help Contents. In the Help browser, click the Search tab and type navigator icons in the Find field.
You can use the Usages window to show you everywhere a class (structure), function, variable, macro, or file is used in your project's source code.
In the customer.cc file, right-click the Customer class on line 42, and choose Find Usages.
In the Find Usages dialog box, click Find.
The Usages window opens and displays all of the usages of the Customer class in the source files of the project.

The Call Graph window displays two views of the calling relationships between functions in the classes. A tree view shows the functions called from a selected function, or the functions that call that function. A graphical view shows the calling relationships using arrows between the called and calling functions.
In the quote.cc file, right-click on the main function and choose Show Call Graph.
The Call Graph window opens and displays a tree view and a graphical view of all of the functions called from the main function.

If you do not see all of the functions shown in the screen shot, click the third button on the left side of the Call Graph window to show who is called from this function.
Expand the end1 node to display the functions called by that function. Notice that the graph is updated to add the functions called by end1.
Select the end1 node and click the second button on the left side of the window to focus on the endl function, then click the fourth button to view all of the functions that call the end1 function.

Expand some of the nodes in the tree to see more functions.

Hyperlink navigation lets you jump from the invocation of a class, method, variable, or constant to its declaration, and from its declaration to its definition. Hyperlinks also let you jump from a method that is overridden to the method that overrides it, and the reverse.
In the cpu.cc file of the Quote_1 project, mouse over line 37 while pressing Ctrl. The ComputeSupportMetric function is highlighted and an annotation displays information about the function.

Click the hyperlink and the editor jumps to the definition of the function.
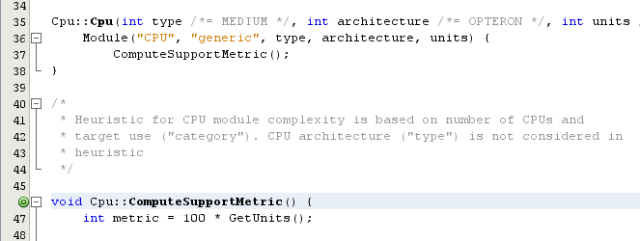
Mouse over the definition while pressing Ctrl, and click the hyperlink. The editor jumps to the declaration of the function in the cpu.h header file.
Click the left arrow in the editor tool bar and the editor jumps back to the definition in cpu.cc.
Hover the mouse cursor over the green circle ![]() in the left margin and see the annotation that indicates that this method overrides another method.
in the left margin and see the annotation that indicates that this method overrides another method.
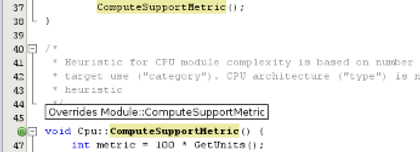
Click the green circle to go to the overridden method and the editor jumps to the module.h header file, which shows a gray circle in the margin to indicate the method is overridden.
Click the gray circle and the editor displays a list of methods that override this method.

Click the Cpu::ComputerSupportMetric item and the editor jumps back to the declaration of the method in the cpu.h header file.
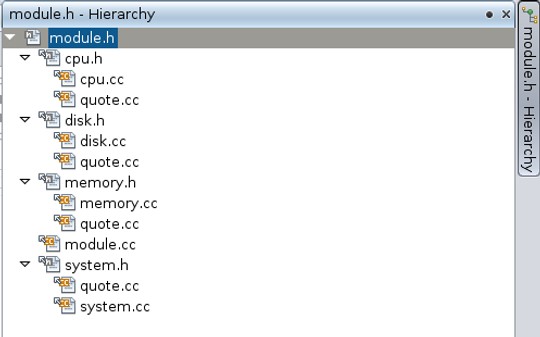
The Include Hierarchy window lets you inspect all header and source files that are directly or indirectly included in a source file, or all source and header files that directly or indirectly include a header file.
In the Quote_1 project, open the module.cc file in the Source Editor.
Right-click on the #include "module.h" line in the file and choose Navigate > View Includes Hierarchy.
By default, the Hierarchy window displays a plain list of files that directly include the header file. Click the right-most button at the bottom of the window to change the display to a tree view. Click the second button from the right to change the display to all files that include or are included. Expand the nodes in the tree view to see all of the source files that include the header file.
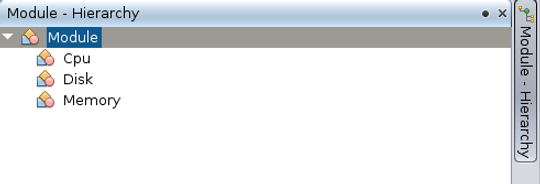
The Type Hierarchy window lets you inspect all subtypes or supertypes of a class.
In the Quote_1 project, open the module.h file.
Right-click on the declaration of the Module class and choose Navigate > View Type Hierarchy.
The Hierarchy window displays all of the subtypes of the Module class.
You can use the Memory Analysis Tool to find memory access errors in your project. The tool allows you to find these errors easily by pointing out exactly where the each error occurs in your source code.
The Memory Analysis tool catches and reports memory access errors dynamically during program execution, so if a portion of your code is not executed at run time, errors in that portion are not reported.
If you have not already done so, download the sample applications zip file from the Oracle Solaris Studio 12.3 Sample Applications web page at http://www.oracle.com/technetwork/server-storage/solarisstudio/downloads/solaris-studio-samples-1408618.html, and unzip the file in a location of your choice. The memorychecks application is located in the CodeAnalyzer subdirectory of the SolarisStudioSampleApplications directory.
Create a project from existing sources using the memorychecks application.
Right-click the project and choose Properties. In the Project Properties dialog box, select the Run node, and type Customer.db after the output path in the Run Command. Click OK.
Run the project.
Now build the project with instrumentation for memory analysis.
Make sure that your memorychecks project is set as the main project.
Click the down arrow next to the Profile Project button ![]() and select Profile Project to find Memory Access Errors from the drop-down list.
and select Profile Project to find Memory Access Errors from the drop-down list.
In the Select Analysis Type dialog box, select All Memory Access Errors from the drop-down list.
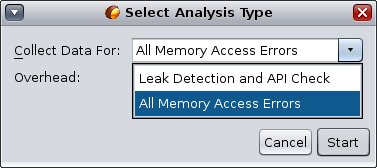
The Overhead field displays High or Moderate to indicate the load that will be placed on the system. The performance of other programs running on your system might be affected when the overhead is high, which is the case when you are detecting both data races and deadlocks.
Click Start.
The Run Memory Profile dialog box opens to let you know that your binary will be instrumented. Click OK.
The project is built and instrumented. The application starts running and the Memory Analysis window opens. When your project run is complete, the Memory Analysis window lists the memory access error types found in your project. The number of errors of each type is shown in parentheses after the error type.
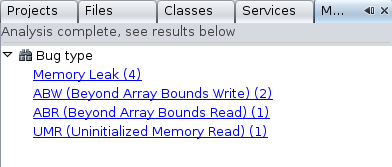
When you click on an error type, the errors of that type are displayed in the Memory Analysis Tool window.

By default, the errors are grouped by the source file in which they were found. When you click on an error, the call stack for that error is displayed. Double-click a function call in the stack to display the associated lines in the source file.
You can create and manipulate breakpoints in your code at any time.
In the Quote_1 project, open the quote.cc file.
Set a line breakpoint by clicking in the left margin of the Editor window next to line 171 (response = readChar("Enter disk module type: (S for single disks, R for RAID; Q - exit)", 'S');). The line is highlighted in red to indicate that the breakpoint is set.

You could remove the breakpoint by clicking on the icon in the left margin.
Choose Window > Debugging > Breakpoints to open the Breakpoints window. Your line breakpoint is listed in the window.

Choose Debug > New Breakpoint (Ctrl+Shift+f8) to open the New Breakpoint dialog box.
In the Breakpoint Type drop-down list, set the type to Function.
Type the function name Customer::GetDiscount in the Function text field. Click OK.
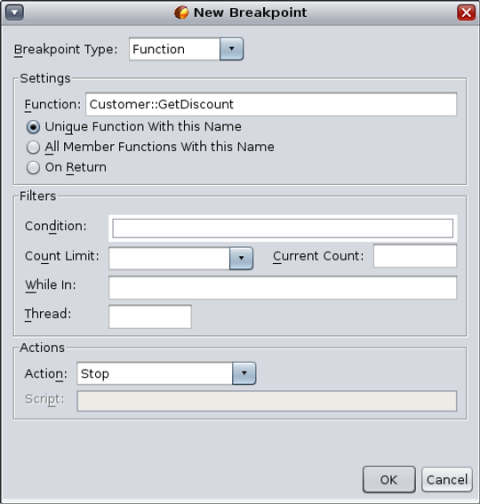
Your function breakpoint is set and is added to the list in the Breakpoints window.

When you start a debugging session, the IDE starts the debugger in the project's associated tool collection (by default, the dbx debugger), then runs the application inside the debugger. The IDE automatically opens debugger windows and prints debugger output to the Debugger Console window.
Start a debugging session for the Quote_1 project by right-clicking the project node and choosing Debug. The debugger starts and the application runs, and the Variables and Debugger Console windows open.

Open the Sessions window by choosing Window > Debugging > Sessions. The debugging session is shown in this window.

The Quote_1 application prompts you for input in the Output window.
Enter a customer name after the Enter customer name: prompt.
The application stops at the function breakpoint you set earlier. The Breakpoints window lists the two breakpoints you set earlier. The green program counter arrow appears on top of the breakpoint icon of the function breakpoint.

In the customer.cc file, the green program counter arrow appears on top of the breakpoint icon on the first line of the GetDiscount function.
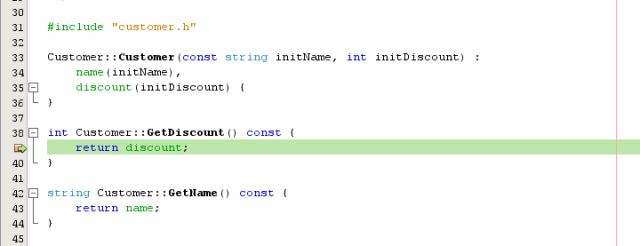
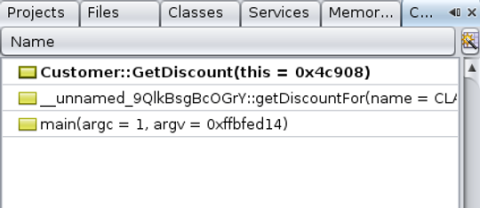
Open the Call Stack window. The call stack shows three frames.
Click the Variables window and note that one variable is displayed. Click the nodes to expand the structure.

Click the Continue button. The GetDiscount function is executed, printing the customer discount to the Output window. Then you are prompted for input.
Enter the input in response to the prompts. The program stops at the next breakpoint, the line breakpoint you set earlier. Click the Variables window and note the long list of local variables.

Look at the Call Stack window and note that there is only one frame in the stack.
Click Continue ![]() and continue entering input in response to the prompts in the Output window until the program is completed. When you enter the last input to the program, your debug session ends. To end the debug session before the execution of the program was complete, you could right-click the session in the Sessions window, and choose Finish.
and continue entering input in response to the prompts in the Output window until the program is completed. When you enter the last input to the program, your debug session ends. To end the debug session before the execution of the program was complete, you could right-click the session in the Sessions window, and choose Finish.
The debugger provides windows that let you debug your project at the machine-instruction level.
Right-click the Quote_1 project and choose Debug.
In the Output window, type a customer name in response to the prompt.
When the program pauses at the breakpoint on the GetDiscount function, choose Window > Debugging > Disassembly to open the Disassembly window as in the Editor window. The green program counter arrow appears on top of the breakpoint icon at the instruction on which the program is paused.
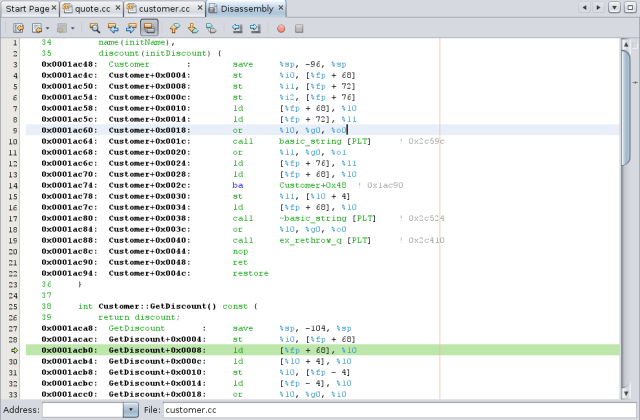
Choose Window > Debugging > Registers to open the Registers window, which displays the contents of the registers.

Choose Window > Debugging > Memory to open the Memory window, which displays the contents of memory currently used by your project At the bottom of the window, you can specify a memory address to browse, change the length of the memory browse, or change the format for memory information.

If you want to debug a program that is already running, you can attach the debugger to the appropriate process.
Choose File > New Project.
In the New Project wizard, expand the Samples node and select the C/C++ category.
Select the Freeway Simulator project. Click Next and then click Finish.
Right-click the Freeway_1 project you created and choose Run. The project builds and the Freeway application starts. In the Freeway GUI window, choose Actions > Start.
In the IDE, choose Debug > Attach Debugger.
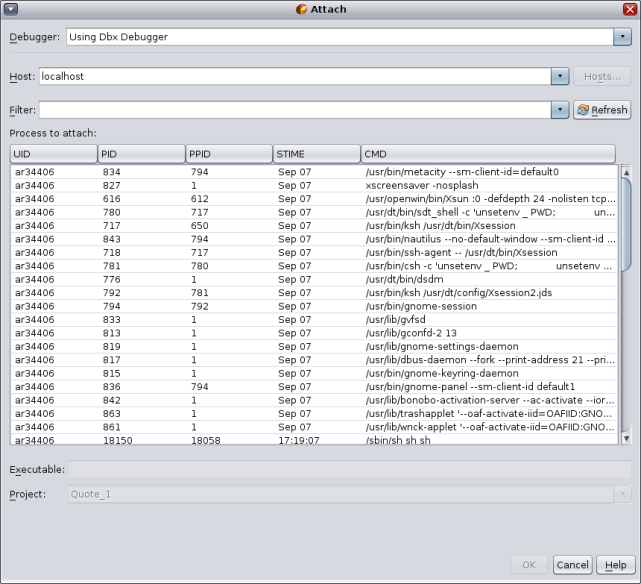
In the Attach dialog box, type Freeway in the Filter field to filter the list of processes.
Select the Freeway process from the filtered list.
Click OK.
A debugging session is started and execution of the Freeway process pauses at the point where the debugger attached to it.
Click Continue ![]() to continue execution of Freeway, which is now running under control of the debugger. If you click Pause
to continue execution of Freeway, which is now running under control of the debugger. If you click Pause ![]() , execution of Freeway pauses, and you can examine variables, the call stack, and such.
, execution of Freeway pauses, and you can examine variables, the call stack, and such.
Click Continue again and then click Finish Debugger Session ![]() . The debugger session ends, but the Freeway process continues executing. Choose File > Exit in the Freeway GUI to exit the application.
. The debugger session ends, but the Freeway process continues executing. Choose File > Exit in the Freeway GUI to exit the application.
If your program is crashing, you might want to debug the core file (the memory image of your program when it crashed). To load a core file into the debugger:
Choose Debug > Debug core file.
Type the full path to a core file in the Core File field or click Browse and navigate to your core file in the Select Core File dialog box.
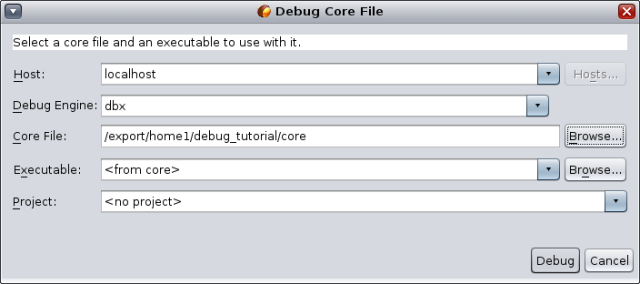
If the debugger cannot associate the core file you specified with an executable, it displays an error message. If this situation occurs, type the path name of the executable in the Executable text box, or click the Browse button and use the Executable dialog box to select the executable.
By default, the Project text field displays either <no project> or the name of an existing project that exactly matches the name of the executable. If you want a new project created for the executable, select <create new project>.
Click Debug.
For a more in-depth tutorial on debugging, see the Oracle Solaris Studio 12.3: dbxtool Tutorial.