| Skip Navigation Links | |
| Exit Print View | |

|
Oracle Solaris Studio 12.3 Code Analyzer User's Guide Oracle Solaris Studio 12.3 Information Library |
| Skip Navigation Links | |
| Exit Print View | |

|
Oracle Solaris Studio 12.3 Code Analyzer User's Guide Oracle Solaris Studio 12.3 Information Library |
2. Collecting Data And Starting the Code Analyzer
Collecting Dynamic Memory Access Data
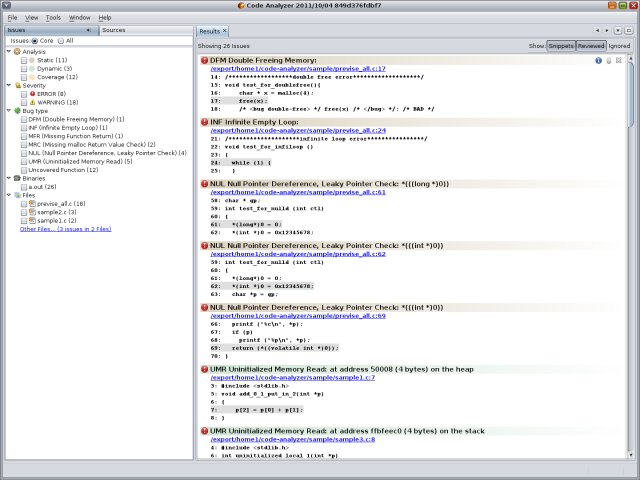
You can use the Code Analyzer GUI to analyze one, two, or all three types of data. To start the GUI, type the code-analyzer command and the path to the binary for which you want to analyze error data you have collected:
code-analyzer binary_name
The Code Analyzer GUI opens and displays the data in the binary_name.analyze directory.

When the Code Analyzer GUI is running, you can switch to displaying the data you have collected for a different binary by choosing Open > File and navigating to the binary.
The online help in the GUI describes how to use all of features to filter the displayed results, show or hide issues, and show more information about specific issues. The Oracle Solaris Studio 12.3 Code Analyzer Tutorial guides you through a complete scenario of data collection and analysis using a sample program.