8 Troubleshooting
This chapter provides troubleshooting tips and techniques for installing and configuring the Exadata Database Machine plug-in.
The following troubleshooting sections are provided:
8.1 Establish SSH Connectivity
For Release 12.1.0.1.0, the SSH key location is <ORACLE_HOME>/.ssh where ORACLE_HOME is the installation directory of the Enterprise Manager agent. For example:
/u01/app/oracle/product/gc12/agent/core/12.1.0.1.0
Note:
Some metric collection has a dependency on~/.ssh/known_hosts.For Release 12.1.0.2.0 or later, the SSH key location is $HOME/.ssh of the agent user.
To set up SSH connectivity between the computer where Agent is running and the Oracle Exadata Storage Server, as the Agent user:
-
Log in to the computer where the Enterprise Manager Agent is running, open a terminal, and run the following commands as the Agent user to generate a pair of the SSH private/public keys if they are not present:
-
For Release 12.1.0.1.0:
$ cd <ORACLE_HOME>/.ssh
$ ssh-keygen -t dsa -f id_dsa
Where
<ORACLE_HOME>is the installation directory of the Enterprise Manager Agent. -
For Release 12.1.0.2.0:
$ cd $HOME/.ssh
$ ssh-keygen -t dsa -f id_dsa
Where
$HOMEis the home directory of the Agent user.
-
-
Copy the public key (
id_dsa.pub) to the/tmpdirectory on the storage cell:$ scp id_dsa.pub root@<cell_ipaddress>:/tmp
-
Add the contents of the
id_dsa.pubfile to theauthorized_keysfile in the.sshdirectory within the home directory of the cellmonitor user:$ ssh -l root <cell_ipaddress> "cat /tmp/id_dsa.pub >> ~cellmonitor/.ssh/authorized_keys"
Note:
If theauthorized_keysfile does not exist, then create one by copying theid_dsa.pubfile to the.sshdirectory within the home directory of the user cellmonitor:$ ssh -l root <cell_ipaddress> "cp /tmp/id_dsa.pub ~cellmonitor/.ssh/authorized_keys; chown cellmonitor:cellmonitor ~cellmonitor/.ssh/authorized_keys"
-
Make sure that the
.sshdirectory andauthorized_keyshave the right file permission:# chmod 700 ~cellmonitor/.ssh # chmod 600 ~cellmonitor/.ssh/authorized_keys
8.2 Discovery Troubleshooting
Very often, the error message itself will include the cause for the error. Look for error messages in the OMS and agent logs (case insensitive search for dbmdiscovery) or in the Discovery window itself. Common error include:
8.2.1 Hardware Availability
All the hardware components must be "known" and reachable; otherwise, communication failures will occur. Use the ping command for each hardware component of the Exadata rack to make sure all names are resolved.
8.2.2 Compute Node Error Message
Problems with the compute node may generate the following error:
The selected compute node is not an existing host target managed by Enterprise Manager. Please add the compute node as managed target before you continue.
Possible causes for this error include:
-
The compute node was not added as an Enterprise Manager host target before the Exadata Database Machine discovery.
-
The host target name for compute node is an IP address. This problem can be an
/etc/hostsor DNS issue. -
The host target name is not fully qualified with domain name (for example, hostname.mycompany.com)
8.2.3 Cell is not Discovered
If the cell itself is not discovered, possible causes could be:
-
The installation of RDBMS Oracle Home Release 11.2 is incorrect.
-
The
/etc/oracle/cell/network-config/cellip.orafile on the compute node is missing or unreadable by the agent user or cell not listed in that file. -
The cell is not listed in the
/etc/oracle/cell/network-config/cellip.orafile. -
Management Server (MS) or cellsrv is down.
-
Cell management IP is changed improperly. Bouncing both cellsrv and MS may help.
-
To check that the cell is discovered with a valid management IP, run the following command on the compute node used for discovery:
$ORACLE_HOME/bin/kfod op=cellconfig
8.2.4 Compute Node or InfiniBand Switch is not Discovered
If there are problems with discovery of the compute node or the InfiniBand switch, possible causes could be:
-
The InfiniBand switch host name or
nm2userpassword is incorrect. -
The connection from the compute node to the InfiniBand switch through SSH is blocked by a firewall.
-
The InfiniBand switch is down or takes too long to respond to SSH.
To resolve problems with the compute node or InfiniBand switch discovery, try:
-
If the InfiniBand switch node is not discovered, the InfiniBand switch model or switch firmware may not be supported by EM Exadata. Run the
ibnetdiscovercommand. Output should look like:Switch 36 "S-002128469f47a0a0" # "Sun DCS 36 QDR switch myhost1.example.com" enhanced port 0 lid 1 lmc 0
-
To verify discovery of the compute node, run the following command on the compute node used for discovery:
# ssh <IB switch> -l nm2user ibnetdiscover
-
If the compute node is not discovered, run the
ibnetdiscovercommand. Output should look like:Ca 2 "H-00212800013e8f4a" # " myhost1 S 192.168.229.85 HCA-1”
A bug in the 11.2.2.2.2 compute node image shows ”S” and the InfiniBand IP as missing. Output would look like:
Ca 2 " H-00212800013e8f4a " # "xdb1db02 HCA-1”
A workaround for this problem is to run the following command as root on the compute nodes:
# /opt/oracle.cellos/ib_set_node_desc.sh
8.2.5 InfiniBand Network Performance Page Shows No Data
If the InfiniBand network performance page does not show data, double check that the files under the /opt/oracle.SupportTools/em/ directory on compute nodes should be publicly readable. Se Oracle Bug 13255511 for more information.
8.2.6 ILOM, PDU, KVM, or Cisco Switch is not Discovered
If the ILOM, PDU, KVM, or Cisco switch is not discovered, the most likely cause is that the Exadata Database Machine Schematic file cannot be read or has incorrect data. See Troubleshooting the Exadata Database Machine Schematic File.
8.2.7 Target Does not Appear in Selected Targets Page
Even though no error may appear during the Exadata Database Machine guided discovery, the target does not appear on the Select Components page. Possible causes and solutions include:
-
Check the All Targets page to make sure that the target has not been added as an Enterprise Manager target already:
-
Log in to Enterprise Manager.
-
Select Targets, then All Targets.
-
On the All Targets page, check to see if the Oracle Exadata target appears in the list.
-
-
A target that is added manually may not be connected to the Exadata Database Machine system target through association. To correct this problem:
-
Delete these targets before initiating the Exadata Database Machine guided discovery.
-
Alternatively, use the
emclicommand to add these targets to the appropriate system target as members.
-
8.2.8 Target is Down or Metric Collection Error After Discovery
After the Exadata Database Machine guided discovery, an error that the target is down or that there is a problem with the metric collection may display. Possible causes and recommended solutions include:
-
For the cell or InfiniBand switch, the setup of SSH may not be configured properly. To troubleshoot and resolve this problem:
-
The agent's SSH public key in the
<AGENT_INST>/.ssh/id_dsa.pubfile is not in theauthorized_keysfile of$HOME/.sshfor cellmonitor or nm2user. -
Verify permissions. The permission settings for
.sshandauthorized_keysshould be:drwx------ 2 cellmonitor cellmonitor 4096 Oct 13 07:06 .ssh -rw-r--r-- 1 cellmonitor cellmonitor 441842 Nov 10 20:03 authorized_keys
-
Resolve a
PerformOperationExceptionerror. See Troubleshooting the Exadata Database Machine Schematic File for more information.
-
-
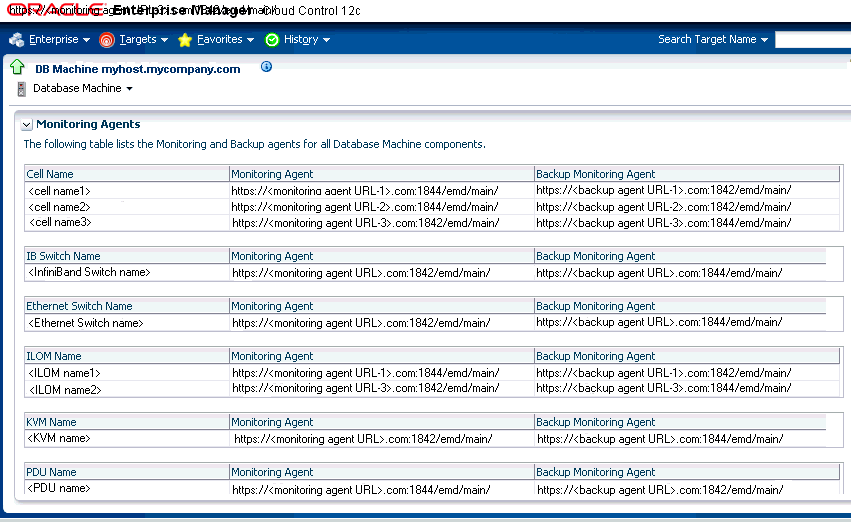
If the SSH setup is confirmed to be properly configured, but the target status is still down, then check to make sure there are valid monitoring and backup agents assigned to monitor the target. To confirm, click the Database Machine menu and select Monitoring Agent. Figure 8-1 shows an example of the monitoring agents:
-
For the ILOM, PDU, KVM, or Cisco switch, possible causes include:
-
The Exadata Database Machine Schematic Diagram file has the wrong IP address.
-
Monitoring Credentials is not set or incorrect. To verify:
-
Log in to Enterprise Manager.
-
Click Setup, then Security, and finally Monitoring Credentials.
-
On the Monitoring Credentials page, click the Oracle Exadata target type. Then set the monitoring credentials.
-
8.2.9 Troubleshooting the Exadata Database Machine Schematic File
The Exadata Database Machine Schematic file version 503 is required as a prerequisite for guided discovery. As part of any discovery troubleshooting, possible causes and recommended resolution with the schematic file can include:
-
The schematic file on the compute node is missing or is not readable by the agent user.
-
For Exadata Release 11.2.3.2 and later, the schematic file is:
/opt/oracle.SupportTools/onecommand/catalog.xml
-
For Exadata Release 11.2.3.1 and earlier, the schematic file is:
/opt/oracle.SupportTools/onecommand/databasemachine.xml
-
-
If a
PerformOperationExceptionerror appears, the agent NMO is not configured forsetuid-root:-
From the OMS log:
2011-11-08 12:28:12,910 [[ACTIVE] ExecuteThread: '6' for queue: 'weblogic.kernel.Default (self-tuning)']
ERROR model.DiscoveredTarget logp.251 -
ERROR: NMO not setuid-root (Unix only) oracle.sysman.emSDK.agent.client.exception.PerformOperationException:
-
As root, run:
# <AGENT_INST>/root.sh
-
-
In the
/etc/pam.dfile,pam_ldap.sois used instead ofpam_unix.soon compute nodes.-
Even though the agent user and password are correct, this errors appears in the agent log:
oracle.sysman.emSDK.agent.client.exception.PerformOperationException:
ERROR: Invalid username and/or password
-
-
Schematic file has error because of a known Exadata Database Machine configurator bug:
-
Verify that the Exadata Database Machine configurator is version 12.0
-
Verify that the schematic file is version 503
-
Older versions may or may not have the bug depending on the Exadata Database Machine rack type and partitioning.
-
8.3 Exadata Database Machine Management Troubleshooting
If data is missing in Resource Utilization graphs, then run a "view object" SQL query to find out what data is missing. Common problems include:
-
Schematic file is not loaded correctly.
-
Cluster, Database, and ASM are not added as Enterprise Manager targets.
-
Database or cell target is down or is returning metric collection errors.
-
Metric is collected in the Enterprise Manager repository, but has an
IS_CURRENT != Ysetting.
8.4 Exadata Derived Association Rules
Exadata derived association rules depend on Exadata and DB/ASM ECM data. This data may take up to 30 minutes to appear depending on metric collection schedule. To check for data availability:
-
From the Enterprise Manager Cloud Control console:
-
Click Targets, then All Targets.
-
On the All Targets page, click the Oracle Exadata target from the list.
-
Click Database System, then Configuration, and finally Last Collected.
-
On the Latest Configuration page, click Actions, then Refresh.
-
-
From the command line:
# emctl control agent runCollection
# target_name:target_type <collectionName>
Other troubleshooting tips include:
-
Verify that ECM data are collected and present in Enterprise Manager repository.
-
Verify that all data and conditions in query are met by running the query in SQL+.
-
Verify triggers by enabling debug logging to check for timing issues.
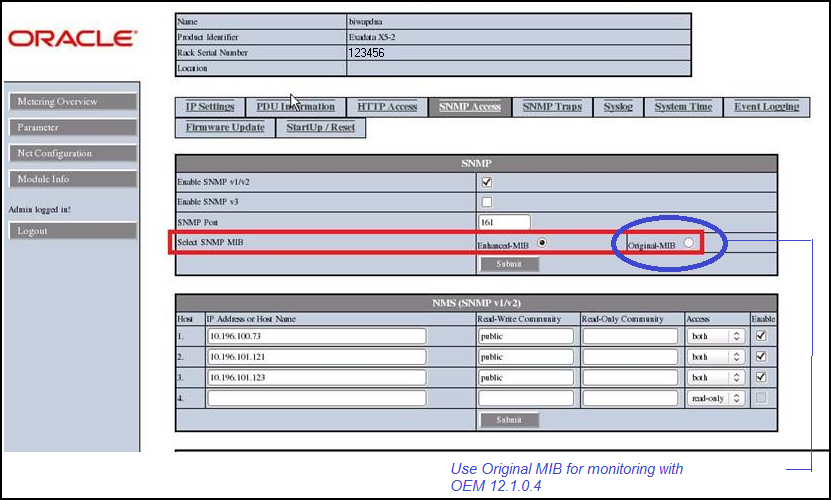
8.5 Enhanced MIB Incompatibility
With some shipments of the X4 series of Exadata and all later version of the hardware, the Exadata Database Machine contains an upgraded PDU that is running a newer version of firmware. This firmware ships with an enhanced Management Information Base (MIB) that is not compatible with the Exadata 12.1.x plug-in. In these cases, change the setting in the PDU to using the original MIB as illustrated Figure 8-2:

