
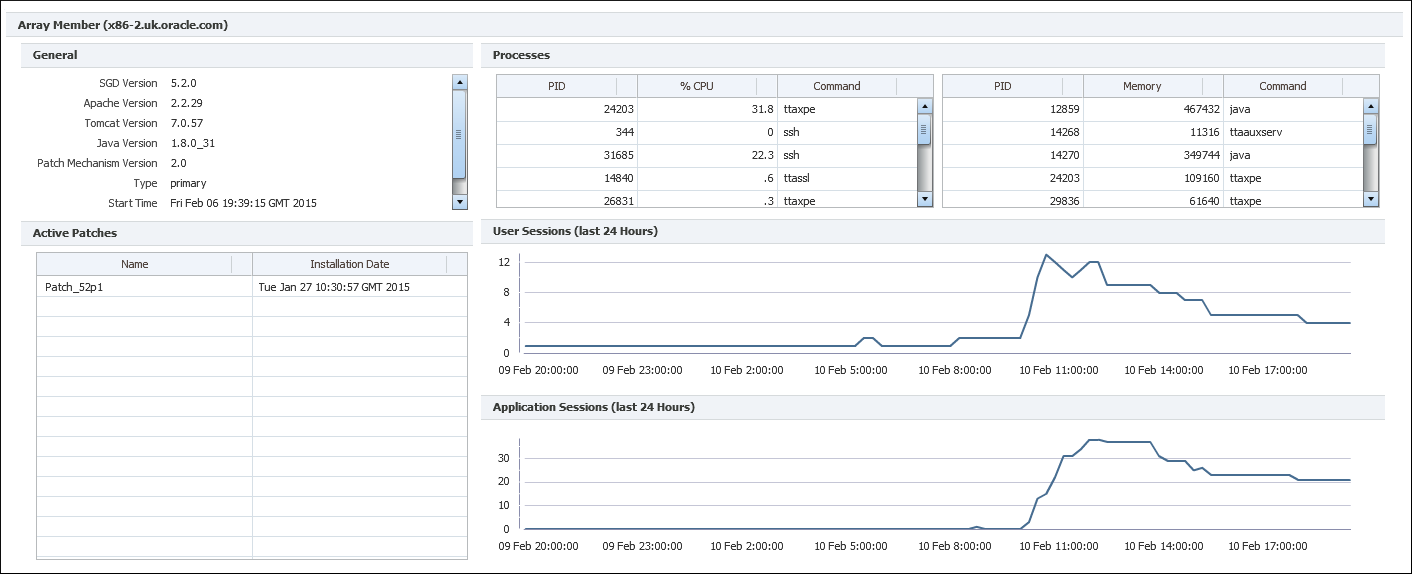
The Array Member monitoring page enables you to view monitoring data for a specific SGD server in an array. See Figure 3.2, “Array Member Monitoring Page”.
The Array Member monitoring page includes a series of panels, as described in Table 3.2, “Panels on the Array Member Monitoring Page”.
Table 3.2 Panels on the Array Member Monitoring Page
Panel | Description |
|---|---|
General | Shows software versions and status information for the array member. |
User Sessions (last 24 hours) | A line chart that shows the number of user sessions running on the array member. The chart shows the history of session statistics over the last 24 hours. |
Application Sessions (last 24 hours) | A line chart that shows the number of application sessions running on the array member. The chart shows the history of session statistics over the last 24 hours. |
Processes | A table that shows CPU and memory usage statistics for SGD processes running on the array member. The 10 processes with the highest CPU and memory usage are displayed. |
Active Patches | A table that shows details of the SGD software patches installed on the array member. |