21 Using JVM Diagnostics
This chapter describes the various tasks you can perform using JVM Diagnostics. In particular, it contains the following:
21.1 Installing JVM Diagnostics
The JVM Diagnostics Engine runs as an Enterprise JavaBeans (EJB) Technology on a WebLogic Server. The JVM Diagnostics Agent is deployed on the targeted JVM (the one running a production WebLogic Server). It collects real-time data and transmits it to the JVM Diagnostics Engine. This data is stored in the Management Repository, and the collected information is displayed on Enterprise Manager Cloud Control console for monitoring purposes. The communication between the JVM Diagnostics Engine and the JVM Diagnostics Agent can be a secure (SSL) or non-secure http connection.
The Application Performance Management Page is a GUI based screen that enables you to deploy and monitor the health of the JVM Diagnostics Engine in a reliable and an efficient manner. Using the Application Performance Management Page, you can achieve the following:
-
Deploy JVM Diagnostics Engine
-
Monitor the availability of all the JVM Diagnostics Engines
-
Access information about the JVM Diagnostics Engines like hosts to which the engines are deployed, the current status, the port on which they are running, version, and so on.
For more details on installing JVM Diagnostics, see Enterprise Manager Cloud Control Basic Installation Guide.
21.1.1 Monitoring a Standalone JVM
If you need to monitor a standalone JVM, you can manually deploy the JVM Diagnostics Agent by following these steps:
-
From the Setup menu, select Middleware Management, then select Application Performance Management. Check if the JVM Diagnostics Engine has been enabled. The JVM Diagnostics Engine is independent and will run in a WLS target in the same domain as the Cloud Control OMS server that is already running. This is essentially another WLS container in the same domain and is very lightweight, so it can run well on the same server as the Cloud Control OMS instances.
-
Select the JVM Diagnostics Engine row in the Application Performance Management Engines table and click Configure. In the JVM Diagnostics Setup page, click the JVMs and Pools tab and then click Downloads to download the
jamagent.warfile. -
Add the
jamagent.warto theCLASSPATHas follows:CLASSPATH=$CLASSPATH:/scratch/ssmith/jvmd/jamagent.warexport CLASSPATH -
Start JVM Diagnostics with the JVM Diagnostics Agent as follows:
$JAVA_HOME/bin/java -cp $CLASSPATH $JVM_OPT $SYS_OPT jamagent.jamrun [$JAMAGENT_PARAMS_LIST] $TARGET_CLASS $TARGET_CLASS_PARAMSwhere
-
[$JAMAGENT_PARAMS_LIST]refers to the JVM Diagnostics Agent parameters such as jamloglevel, jamconshost, jamconsport, jamconsretr, jamtimeout, and so on.Note:
Thejamisdameonoption is always enabled for the JVM Diagnostics Agent in the standalone JVM mode. This ensures that the parent and native Java threads will run as daemons irrespective of what is specified on the command line. -
$TARGET_CLASSis the executable (Main) class of the application. -
$TARGET_CLASS_PARAMSare the program arguments that are to be passed to the executable (Main) class.
If these parameters are not specified, they are picked up from the
jamagent.warfile.An example is given below:
CLASSPATH="$CLASSPATH:/scratch/ssmith/jamagent.war"
$JAVA_HOME/bin/java -cp $CLASSPATH $JVM_OPT $SYS_OPT jamagent.jamrun
jamconshost=10.229.187.109 jamconsport=3800
oracle.ad4j.groupidprop=MyJVMPool1/JVM50 mypackage.MyMainClass myarg1 myarg2
-
21.2 Setting Up JVM Diagnostics
Follow these steps to set up and configure JVM Diagnostics:
-
From the Setup menu, select Middleware Management, then select Application Performance Management. A list of Application Performance Management Engines are listed. Under the JVM Diagnostics Engines row, the following details are displayed when all the columns are selected:
-
Name: The name assigned to the JVM Diagnostics Engine. This ID identifies the JVM Diagnostics Engine in all the processes.
-
Type: The type of engine, in this case, JVM Diagnostics Engine.
-
Host: The machine on which the JVM Diagnostics Engine has been deployed.
-
Port: The port of the machine on which the JVM Diagnostics Engine has been deployed.
-
SSL Port: The SSL Port of the machine on which the JVM Diagnostics Engine has been deployed.
-
Availability: The availability, in percentage, of the JVM Diagnostics Engine.
-
Status: The status of the JVM Diagnostics Engine (Active/Inactive).
-
Server: The server on which the JVM Diagnostics Engine is located.
-
Version: The build version of this JVM Diagnostics Engine.

Select the JVM Diagnostics Engines row and click Configure to configure the JVM Diagnostics Engine parameters, JVMS and Pools, databases, and heap loader. The following tabs are displayed:
-
21.2.1 Configuring the JVM Diagnostics Engine
You can configure the JVM Diagnostics Engine and create new idle thread rules or delete existing ones.
-
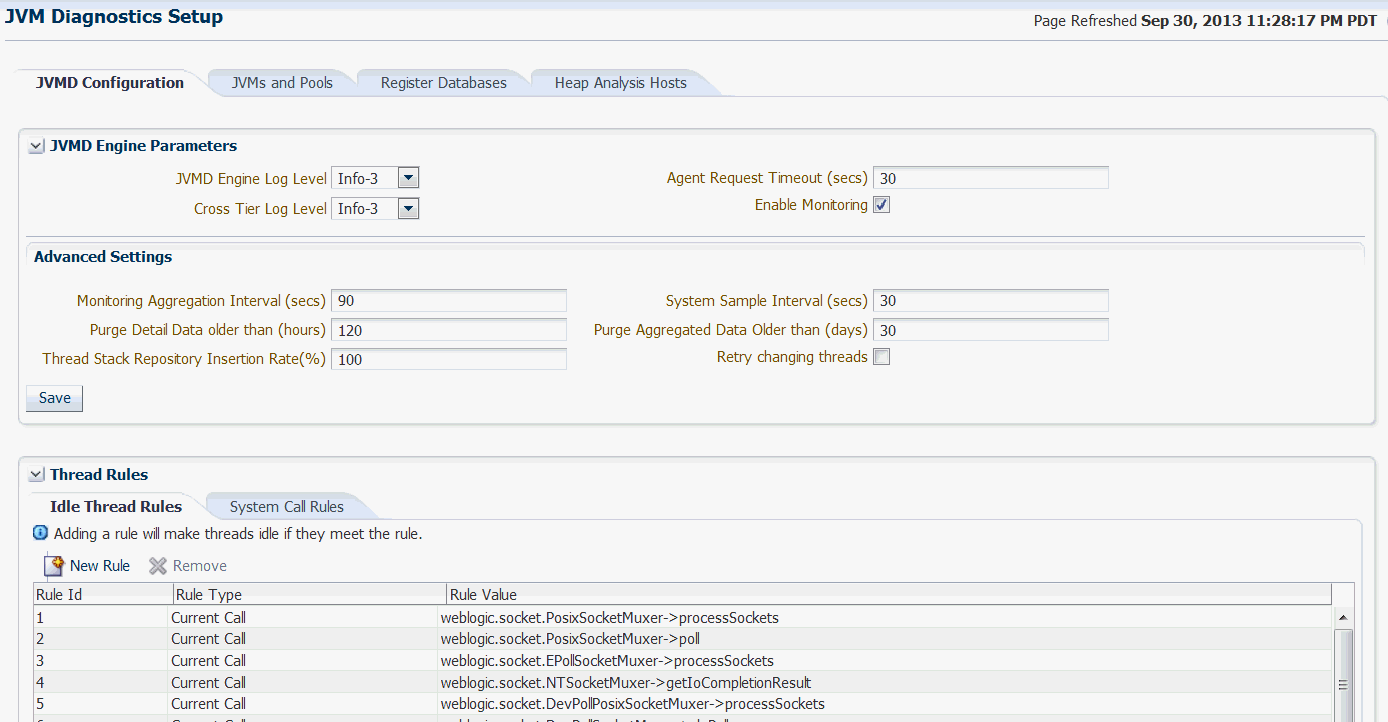
Click the JVMD Configuration tab. The following page appears.
-
You can modify the following details in the JVMD Engine Parameters region.
-
JVMD Manager Log Level: The log level for console diagnostics messages. Log levels 1 to 5 are supported where:
-
1 = Error
-
2 = Warning
-
3 = Info
-
4 = Debug
-
5 = Trace
The default log level is 3.
-
-
Cross Tier Log Level: The log level for cross-tier diagnostic messages. Log levels 1 to 5 are supported where:
-
1 = Error
-
2 = Warning
-
3 = Info
-
4 = Debug
-
5 = Trace
The default log level is 3.
-
-
Agent Request Timeout: The number of seconds that the JVM Diagnostics Engine waits for the JVM Diagnostics Agent to respond. You can increase this value if the monitored JVMs are extremely busy and the console times out and disconnects while waiting for a response.
-
Monitoring Aggregation Interval: The frequency at which the detailed monitoring samples should be aggregated into summary data.
-
System Sample Interval: The frequency at which system details (cumulative CPU counters, heap size, and number of GCs) should be collected in monitoring.
-
Purge Detail Data older than (hours): The period for which the detailed monitoring samples should be retained.
-
Purge Aggregated Data older than (days): The period for which the aggregated monitoring samples should be retained.
-
Enable Monitoring: Select this check box to start or stop monitoring.
-
Thread Stack Repository Insertion Rate (%): Enter a number between 1 and 100. The thread stacks will be stored in the repository at the specified rate.
-
Retry Changing Threads: If a thread stack changes during a sample (this can happen when a thread is using CPU), JVM Diagnostics will skip that thread for that sample. If you find missing samples, use this feature to retrace the changed stacks. This will retry (up to 5 times) threads with changing stacks. It will also make system calls to get the stack if possible.
Note:
This field is not applicable to the JVMTI (level 0) optimization.
Click Save to save the parameters.
-
-
In the Thread Rules region, you can define the following:
-
Idle Thread Rules: Mark a thread as idle by adding it to an Idle Thread Rule. All threads that have been marked as idle will not be monitored. Click New Rule to create a new Idle Thread Rule. In the Add Idle Thread Rule window, enter the following details:
-
Rule Type: The Rule Type can be:
Monitor (Waiting on Lock): Select this type if you want to ignore threads that are locked with a lock of the specified name.
Current Call: Select this type if you want to ignore all threads that have the specified (class + method) as the current call of the stack. The Current call of the stack is the first frame of the stack, traversing from top to bottom, such that the (class + method) is not a System call. System calls are assumed to be the calls which are not relevant to the user application like java.* etc. You can specify a wild card here, for example, if you specify weblogic.servlet.*, all the threads that meet this criteria will be ignored.
Thread Name: Select this type if you want to ignore all threads containing the specified thread name.
-
Rule Value: The Rule Value for Current Call should contain the fully qualified class name followed by the method name. An example of a Current Call is
weblogic.socket.PosixSocketMuxer->processSockets. An example of a Monitor (Waiting on Lock) isweblogic.socket.PosiSocketMuxer$1. -
Global Rule: Select this checkbox to apply the idle thread rule to all JVM Pool targets. If this box is unchecked, you must select one or more JVM Pools for which this rule will be applicable.
All threads that meet the criteria specified in the Idle Thread Rule will not appear in the View Active Threads screen.
-
-
System Call Rules: Mark a method as a system call by adding it to the System Call Rules. System calls are assumed to be the calls which are not relevant to the user application like java.* etc. Click New Rule to create a new system call and specify the matching pattern such as sun.*, java.* and so on.
Select the Global Rule checkbox if this System Call Rule is to be applicable to all JVM Pool targets. If this box is unselected, select one or more JVM Pools for which this rule is to be applied.
All methods that match the rules listed in the System Call Rules table are identified as system calls.
-
21.2.2 Configuring JVMs and Pools
You can group sets of JVMs into JVM pools that provide monitoring information across all related JVMs in a single view. You can view all the JVM pools in the WebLogic Domain, create a new JVM pool, and edit existing JVM pools.
-
From the Setup menu, select Middleware Management, then select Application Performance Management. Select the JVM Diagnostics Engine row in the Application Performance Management Engines table and click Configure.
-
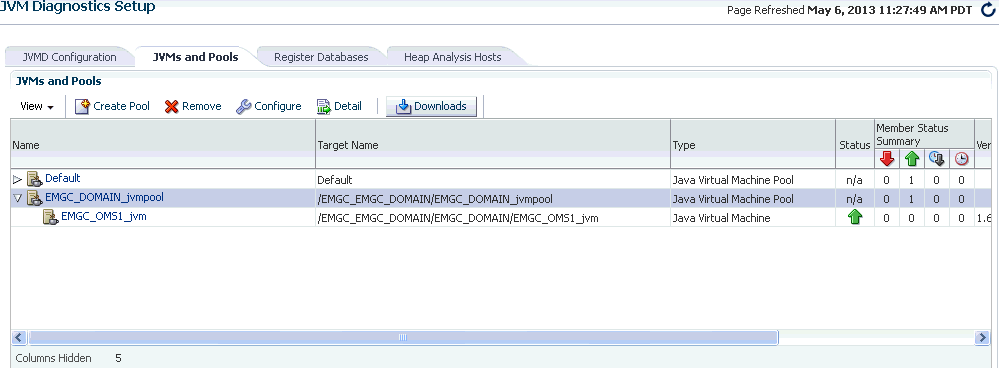
Click the JVMs and Pools tab. The list of all available JVM pools is displayed. For each pool, you can set the Poll Enabled flag and specify the Poll Interval. If the Polling Enabled flag is set to Y, JVMs belonging to this pool will be polled for active requests periodically based on the Poll Interval.
-
Click Create Pool to create a new pool.
-
In the Add JVM Pool Information page, enter the name and description of the JVM pool.
-
In the Poll Interval field, specify the sample interval for JVMs belonging to this pool when monitoring (polling) is enabled.
-
Check the Poll Enabled check box to poll the JVMs belonging to this pool.
-
Click Save to save the JVM Pool information.
-
-
To delete a pool, check the select check box and click the Remove icon.
-
Click Downloads to download JVM Diagnostics components. You can download the following components:
-
JVMD Agent: Contains JVM Diagnostics Agent binaries for all supported platforms.
-
LoadHeap: Contains scripts to upload heap snapshots to the repository.
-
JVMD Agent with MDA (WebLogic only): Contains JVM Diagnostics and MDA Agents for the Weblogic server on supported platforms.
-
DB Agent: Contains supported platforms executables for establishing cross tier analysis for legacy database versions.
-
JVMD Engine: Collects JVM metrics from JVM Diagnostics Agents for real time view and historical data.
-
-
Select a JVM Pool and click Configure. See Section 21.4.4, "Configuring a JVM Pool" for details.
-
Select a JVM and click Configure. See Section 21.5.10, "Configuring a JVM" for details.
21.2.3 Register Databases
Follow these steps to register the database:
-
From the Setup menu, select Middleware Management, then select Application Performance Management. Select the JVM Diagnostics Engine row in the Application Performance Management Engines table and click Configure.
-
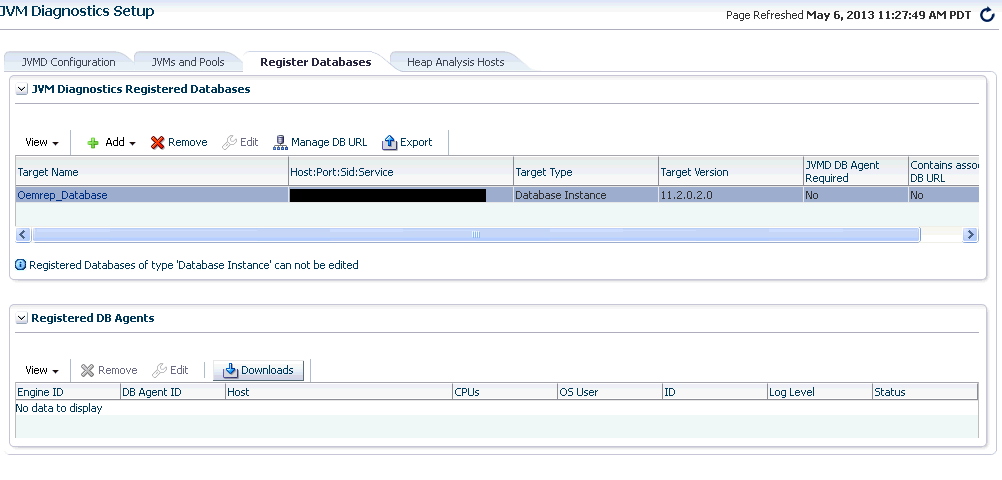
Click the Register Databases tab. The JVM Diagnostics Registered Databases page appears.
-
The list of registered databases is displayed. The database name, host, Oracle SID for the monitored database, and listener port number is displayed. You will also see a flag indicating whether the database agent is required.
-
You can do the following:
-
Add a Database Instance: From the Add menu, select Database Instance to register a single instance or Oracle RAC database target.
-
Add a Custom Database: From the Add menu, select Custom Database to register an external database target. Specify the Name, Host, Port, SID, Instance ID, Username, and Password and click Test Connection to validate the database details. After the validation, click OK to register the database.
-
Remove: Select a database from list and click Remove to remove a registered database.
-
Manage DB URL: Use this option to establish cross tier correlation between JVM Diagnostics and Database Diagnostics. Select a database and click Manage DB URL. In the Associate / Disassociate a Registered Database, select a Database URL and click Add and specify the URL of the database to be associated.
-
Edit: You cannot edit a Database Instance. Only custom databases can be edited. Select a custom database from the list and click Edit.
Note:
The DB User must have select privileges on theGV_$SESSION,GV_$SESSION_WAIT,GV_$PROCESS,GV_$SQLTEXT,GV_$SQLAREA,GV_$LOCK, andGV_$LATCHNAMEfixed views in the target database.To grant select privileges to a user such as jvmadmin, enter a command as follows:
SQL> grant select on SYS.GV_$LATCHNAME to jvmadmin
-
-
After the database has been registered, the JVM Diagnostics Engine will start monitoring the cross-tier JVM calls between applications being monitored for a particular JVM and the underlying database.
-
In the Registered DB Agents region, the following details are displayed:
-
Engine ID: The ID of the Manager to which this DB Agent is connected.
-
DB Agent ID: This is a unique ID given to the DB Agent and is used to identify the DB Agent in all the processes.
-
Host: The host on which the DB Agent is running.
-
CPUs: The number of CPUs.
-
OS User: The user who started the DB Agent.
-
ID: The port on which the DB Agent is running (Default is 5555).
-
Log Level: The log level of the DB Agent.
-
Status: The status of the DB Agent (active or inactive)
-
-
Check the Select check box and click the Edit icon to edit the DB Agent.
-
Click Downloads to manually download the various binaries such as JVM Diagnostics Agent, JVM Diagnostics Engine, Database Agent, Load Heap, and deploy them. You can download the following:
-
JVM Diagnostics Agent WAR File: The JVM Diagnostics Agent Parameters
web.xmlparameters window is displayed. From the Available Managers drop-down, you can select entries that are in the format <host>:<port> - for normal communication, <host>:<port>(secure communication) for communication over the SSL Port or you can select Other. If you select Other, you need to specify the Manager IP Address and the Manager Port to which the JVM Diagnostics Agent is connecting to. While downloading the JVM Diagnostics Agent, you can modify the following parameters:-
Tuning Timeouts Parameters: You can modify the Connection Retry Time, GC Wait Timeout, Long Request Timeout, and Idle Agent Timeout.
-
Target Association Parameters: If you select WebLogic Server, you can specify the Target Name, and Pool Name. If you select Other Server, you can specify the Group ID Property and Pool Name.
-
Logging Parameters: You can modify the Agent Log Level.
-
Optimization Level: You can modify the Optimization Level.
-
-
JVM Diagnostics Engine EAR File: You can open the jammanager.ear file or save it to a specified location.
-
Load Heap: The
loadheap.zipis saved to a specified location. -
DB Agent: Specify the DB Agent parameters. In the Available Engines drop-down, you can select entries that are in the format <host>:<port> - for normal communication, <host>:<port>(secure communication) for communication over the SSL Port, or you can select Other. If you select Other, you need to specify the Manager IP Address and the Manager Port to which the JVM Diagnostics Agent is connecting to. Specify the Agent Log Level in the Logging Parameters region and click Download.
-
21.2.4 Configuring the Heap Analysis Hosts
To configure the heap analysis hosts, follow these steps:
-
From the Setup menu, select Middleware Management, then select Application Performance Management. Select the JVM Diagnostics Engine row in the Application Performance Management Engines table and click Configure.
-
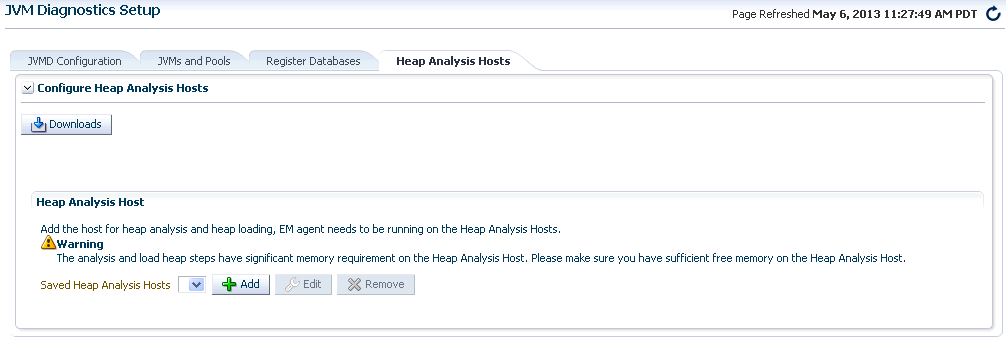
Click the Heap Analysis Hosts tab. The Configure Heap Analysis Hosts page appears.
-
Click Downloads and select Loadheap to download the
loadheap.zipfile. This file contains scripts that can be used to upload heap snapshots to the JVM Diagnostics repository. -
To configure a heap analysis host, click Add and enter the following details:
-
Alias: Enter an alias for the host.
-
Heap Analysis Host: The heap analysis host on which the Management Agent has been deployed.
-
-
Click Save to save the configuration.
21.2.5 Viewing Registered JVMs and Managers
Follow these steps to view a list of registered JVMs and JVM Managers:
-
From the Setup menu, select Middleware Management, then select Application Performance Management.
-
The list of registered JVM Diagnostics Engines are displayed.
-
Name: The name assigned to the JVM Diagnostics Engine. This ID identifies the JVM Diagnostics Engine in all the processes.
-
Type: The type of engine, in this case, JVM Diagnostics Engine.
-
Host: The machine on which the JVM Diagnostics Engine has been deployed.
-
Port: The port of the machine on which the JVM Diagnostics Engine has been deployed.
-
SSL Port: The SSL Port of the machine on which the JVM Diagnostics Engine has been deployed.
-
Availability (%): The availability, in percentage, of the JVM Diagnostics Engine.
-
Status: The status of the JVM Diagnostics Engine (Active/Inactive)
-
Server: The server on which the JVM Diagnostics Engine is located.
-
Version: The build version of this JVM Diagnostics Engine.
Select the JVM Diagnostics Engines row and click Configure to configure the JVM Diagnostics Engine parameters, JVMS and Pools, databases, and heap loader.
-
21.3 Accessing the JVM Diagnostics Pages
After you have deployed the JVM Diagnostics Engine and configured JVM Diagnostics, you can start using the features. From the Targets menu, select Middleware, and click on a JVM Pool or Java Virtual Machine target. The Home page for the target is displayed.
To start using JVM Diagnostics, select the appropriate option from the Java Virtual Machine Pool drop-down menu.
You can also access the JVM Diagnostics pages from the WebLogic Server, WebLogic Domain, JBoss Server, or Cluster target Home pages. To do so, click on a target to navigate to the Home page. From the Target menu, select Diagnostics, then select the appropriate JVM Diagnostics menu option.
21.4 Managing JVM Pools
You can group sets of JVMs into JVM pools that provide monitoring information across all related JVMs in a single view. You can monitor all the JVMs in a pool, view historical and real time data for the JVM pool, manage threads and heap snapshots, create a new pool, and edit an existing JVM pool. JVMs and JVM Pools are now targets in Enterprise Manager. You can do the following:
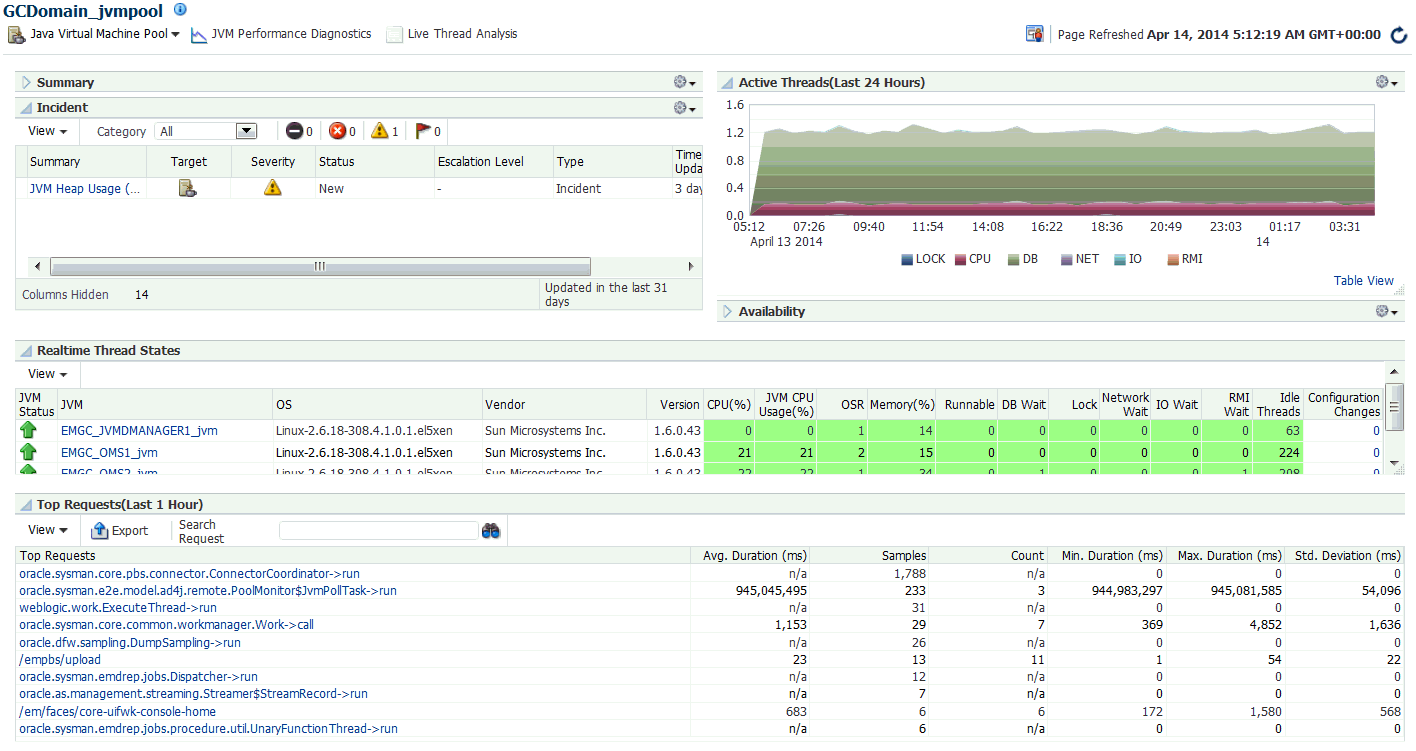
21.4.1 Viewing the JVM Pool Home Page
The JVM Pool Home page shows the details of all JVMs in the pool.
It shows the following details:
-
Summary: Shows whether polling is enabled and the Polling Interval.
-
Availability: This region shows the availability status of the members in the JVM Pool. Click on a Member link to drill down JVM Home Page.
-
Incident: This region shows any open incidents that have occurred, the type, and category of the incident. Click the Summary link to drill down to the Incident Details page. Incidents are displayed in this region only if JVM Diagnostics events have been promoted to incidents as described in Section 21.4.1.1, "Promoting JVM Diagnostics Events to Incidents".
-
Realtime Thread States: This region shows the realtime thread status for each JVM in the pool. The current activity of the JVM including CPU usage, memory, number of threads waiting for a database response, number of threads waiting for synchronization lock, and other details are displayed. If JVMs displayed are present in different WebLogic domains, you can view the WebLogic Domain and the host on which the JVM is running. Click on the JVM link to drill down to the JVM Performance Diagnostics page.
-
Top Requests (Last 1 hour): This region shows the top requests over the last 1 hour. The average duration of the request, number of monitoring samples, the arrival count, throughput or the number of requests completed per minute, the minimum and maximum duration required to complete the request, and the standard deviation taken for the request to be completed are displayed.
21.4.1.1 Promoting JVM Diagnostics Events to Incidents
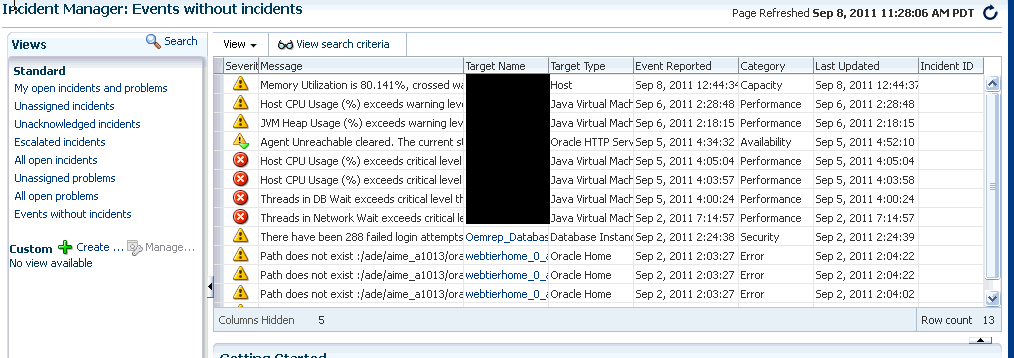
An event is a notable occurrence detected by Enterprise Manager that is related to target, job, monitoring template at a particular point in time, which may indicate normal or problematic behavior. Example for events – database target going down, performance threshold violation based on metrics, unauthorized change in the application configuration file changes, failure in job execution, and so on.
An incident is an event or set of closely correlated events that represent an observed issue requiring resolution, through (manual or automated) immediate action or root-cause problem resolution.
By default JVM Diagnostics events are not promoted to incidents and will not appear in the JVM Pool or JVM Home page. To promote events to incidents, follow these steps:
-
Log into Enterprise Manager.
-
From the Setup menu, select Incidents, then select Incident Rules.
-
Click Create Rule Set. In the Create Rule Set page, in the Targets region, select the All Targets of types option. Select Java Virtual Machine and Java Virtual Machine Pool target types.
-
Click Create in the Rules region and in the Select Type of Rule to Create window, choose Incoming events and updates to events option and click Continue. The Create New Rule: Select Events page appears. In the Type drop down, select JVM Diagnostics Threshold Violation.
-
Then select Specific events of type JVM Diagnostics Threshold Violation.
-
Click Add. The JVM Diagnostics Threshold Violation Rule window appears. Select the JVM Diagnostics metrics that will trigger threshold violation events. These events will be promoted to incidents. Click Next, review the rules, and click Continue to save the rule. All events that match the criteria will be promoted to incidents and will appear in the JVM Diagnostics Pool Home page.
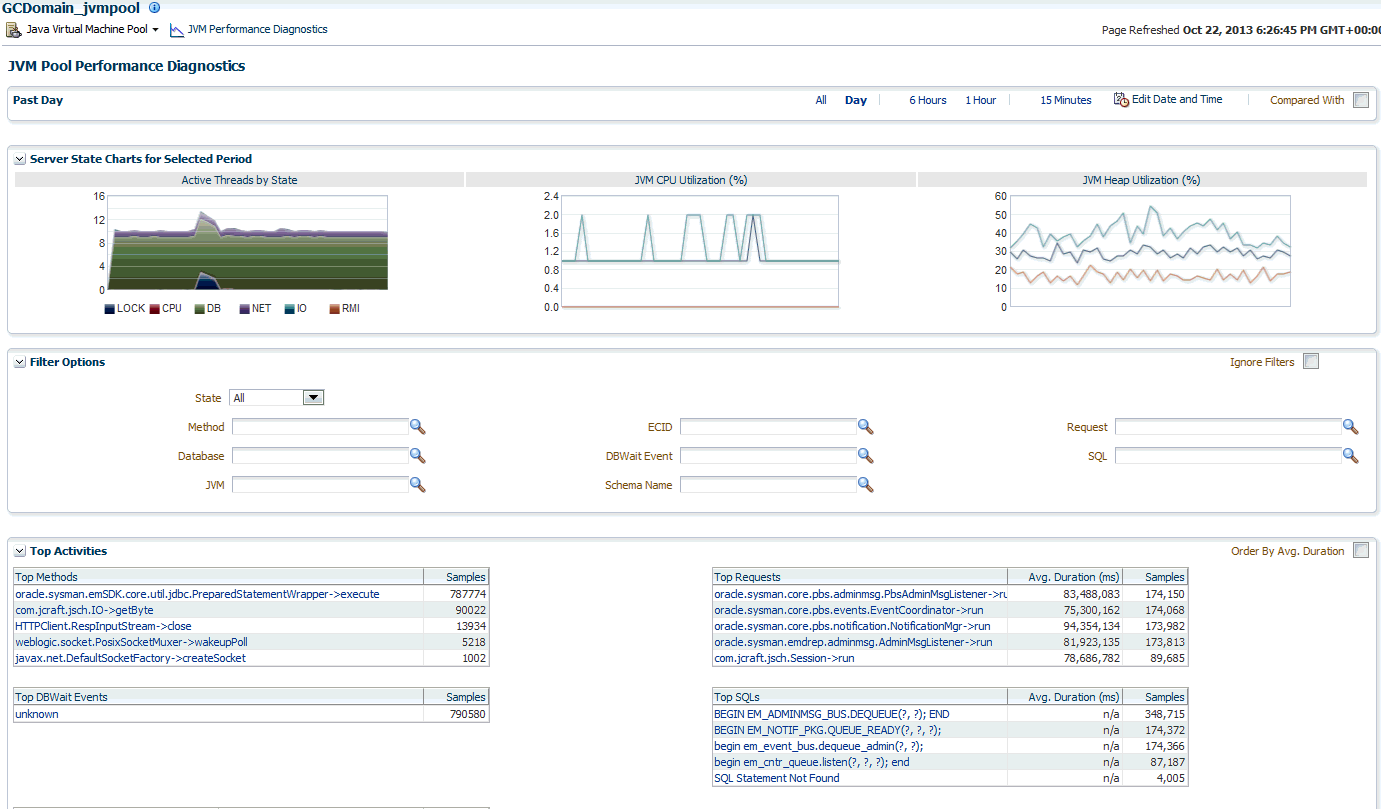
21.4.2 Viewing the JVM Pool Performance Diagnostics Page
You can view the summary and detailed information of the selected JVM Pool on this page. You can also compare the JVM pool data across two specific time periods. To view this page, select Middleware from the Targets menu and click on a JVM Pool target. Select the JVM Performance Diagnostics option from the Java Virtual Machine Pool menu or click on the JVM Performance Diagnostics link next to the Java Virtual Machine Pool menu.
This page shows the summary details of the JVM pools which include the Server State Charts, and a list of Top Methods and Top Requests. You can view the Server State Charts, list of Top Methods, Top Requests, Top DBStates, and Top SQLs.
You can filter the data that is displayed by specifying various criteria such as State, Method, Database, JVM, ECID, DBWait Event, Schema Name, Request, and SQL. If request names are not present, enter a '/' in the Request field. The Filter Menu for Request with a list of top requests is displayed. Select an entry from the table and click OK to set it as a filter.
You can also view server state charts for each JVM in the pool. Check the Ignore Filters checkbox if you want to ignore the specified filters.
In the Top Activities region, you can see the top methods, top requests, top DBWait events, top SQLs, and top databases in the JVM Pool. You can click on the link to drill down to the Details page.
You can compare data between two periods. Select the Compared With checkbox and specify the comparison period to view the comparison data.
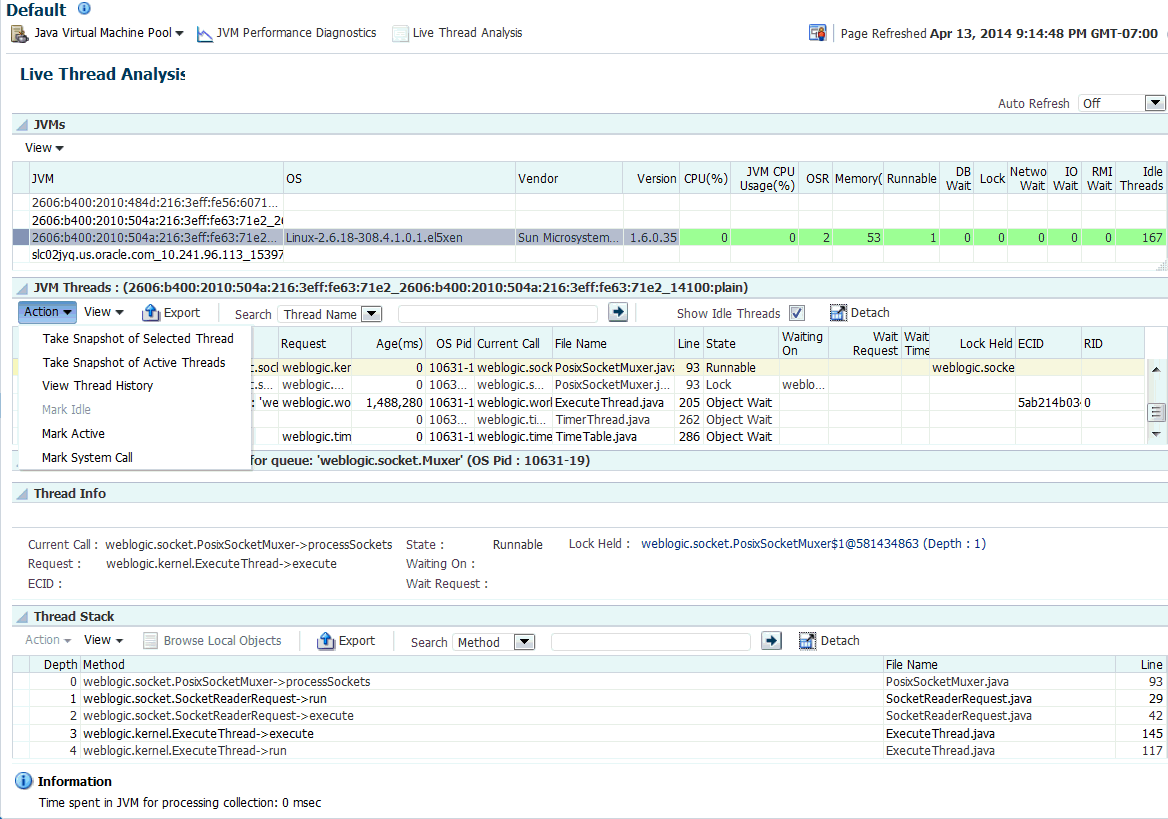
21.4.3 Viewing the JVM Pool Live Thread Analysis Page
This page shows the real-time data for all the JVMs in the selected pool. This data is useful in analyzing the various active and idle threads on the JVM. During analysis you can drill down from the thread level to methods used in the thread to local variables that are part of the method. From the Targets menu, select Middleware, and then click on a Java Virtual Machine Pool target. Select the Live Thread Analysis option from the Java Virtual Machine Pool menu. The JVM Pool Live Thread Analysis Page appears.
This page shows the following:
-
JVMs: This table shows the list of JVMs and the current status of each JVM. The current activity of the JVM including CPU usage, memory, number of threads waiting for a database response, number of threads waiting for synchronization lock, and other details are displayed
-
JVM Threads: This table shows a list of all the threads running in the selected JVM. For each thread, the following details are displayed:
-
Thread Name: Name of the thread. Click on the link to view the JVM Stack.
-
Request: Application request being processed by the thread.
-
OS PID: Operating system and Thread IDs for this thread.
-
Current Call: Current call of the thread.
-
File Name: Name of the file that contains the class and method for the current call.
-
Line: Line number in the method currently being executed.
-
State: The current state of the thread. This can be DB Wait, RMI Wait, or Network Wait. If the ADP, BTM, or DMS is configured, the Request Name and Request Age values are displayed. If a thread is in the DB Wait State, the Waiting On column displays the name of the database the thread is waiting on, and the time the thread has to wait is displayed in the Wait Time column.
Click on the link to view the database diagnostics details. See Section 21.5.4.1, "Cross Tier Analysis" for more details.You can track database issues and determine the application request responsible for the database activity. You can also view the complete call stack including the method and line number information.
Note:
To view the database diagnostics details, ensure that:-
The JVM Diagnostics Agent is running on the JVM that initiated the request.
-
The monitored database must be registered by the JVM Diagnostics Engine.
-
You can do the following:
-
Export: Select a thread and click Export to export the thread details along with thread stacks information to an Excel file.
-
Show Idle Threads: Select this check box to list all the Idle Threads in the JVM Threads table.
-
Take Snapshot of Selected Thread: Select a thread in the list, and from the Action menu, select Take Snapshot of Selected Thread. The Thread Snapshot page is displayed. You can configure the snapshot settings and click Take Thread Snapshot. A snapshot file with details of the selected thread is generated. From the Java Virtual Machine Pool menu, select Thread Snapshots to view additional details.
-
Take Snapshot of Active Threads: This option allows you to take a snapshot of all the active threads. From the Action menu, select Take Snapshot of Active Threads, the Thread Snapshot page is displayed. You can configure the snapshot settings and click Take Thread Snapshot. A snapshot file with details of all the active threads is generated. From the Java Virtual Machine Pool menu, select Thread Snapshots to view additional details.
-
View Thread History: Select a thread and from the Action menu, select View Thread History. The historical data for the thread for the last 30 minutes is displayed.
-
Mark Idle: Select a thread and from the Action menu, select Mark Idle. The selected thread will be marked as Idle as a new Idle Thread Rule will be added with current call as the current call of this thread.
-
Mark Active: Select an Idle thread and from the Action menu, select Mark Active to change the status to Active.
-
Mark System Call: Apart from the threads defined as System Calls in the JVMD Configuration page (see Section 21.2.1, "Configuring the JVM Diagnostics Engine"), you can mark specific threads as system calls. Select a thread from the JVM Threads table. From the Action menu, select Mark System Call to mark this thread as a System Call. All user calls that are marked in this manner will now be treated as System Calls. If you selected a marked call and click Unmark System Call, the thread will now be treated as a User Call.
-
-
Thread Info: This region shows the detailed information for a selected thread. Details of thread including Current Call, Request, ECID, State, Waiting On, and Wait Request are displayed. If the thread is in the DB Wait State, click on the link to drill down to the Database Home page
-
Thread Stack: The Thread Stack table shows the details of the selected thread such as the depth of the thread, methods used in the thread, file where the method is used, and the line number. You can drill down from the method level to a lower level. Select a method from the table and click Browse Local Objects. A popup window is displayed which shows the local variables, objects, their classes, and values. You can export these details to a file by clicking Export. You are prompted to specify the directory in which the file is to be stored. Enter the path and click Save to save file in .csv format.
You can refresh the data that is displayed by specifying the Auto Refresh period.
21.4.4 Configuring a JVM Pool
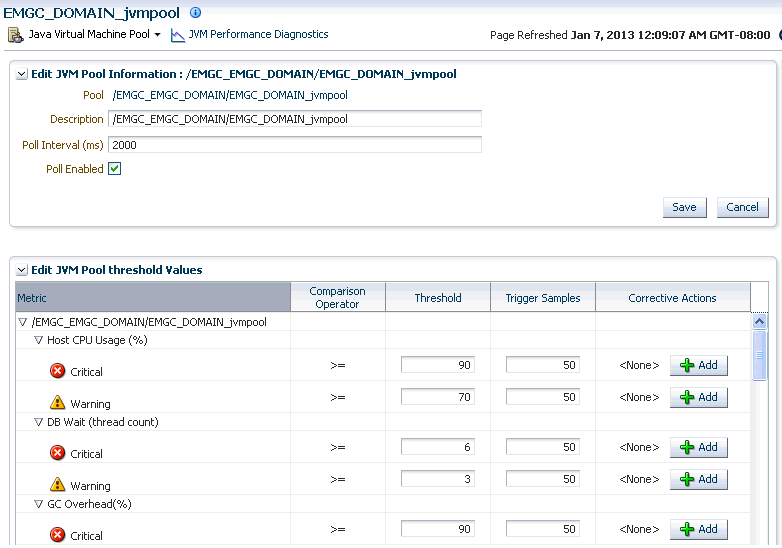
From the Targets menu, select Middleware, and then click on a Java Virtual Machine Pool target. Select the Configure JVM Pool option from the Java Virtual Machine Pool menu. You can do the following:
-
Modify the JVM pool details. You can enable or disable monitoring of pools or change their polling intervals by updating the pool properties. Click Save to save the changes.
-
Configure the JVM pool thresholds. See Section 21.4.4.1, "Updating Pool Thresholds".
21.4.4.1 Updating Pool Thresholds
Follow these steps to edit the pool thresholds on the Edit JVM Pool Information page (Figure 21-9):
-
In the Edit JVM Pool Threshold Values region, the following details are displayed:
-
Level: Thresholds violations can have a level of R (red) or Y (yellow).
-
Metric: The attribute or metric that is being monitored.
-
Threshold: The Critical and Warning threshold for the metric. A violation occurs when the threshold is exceeded after a minimum number of samples have been monitored.
-
-
Click Add to add a corrective action. Select a corrective action from the list and click OK. You can select:
-
No Action: No corrective is defined.
-
Trace Dump: Select this option to trace a particular thread, or all active threads in response to a threshold violation. You can define the following parameters:
-
Poll Interval: Interval after which snapshot should be repeated.
-
Poll Duration: Duration for which the snapshot should be taken.
-
Thread Details: You can specify if the thread details need be included in the snapshot.
-
Try Changing Threads: Sometimes the stack associated with the thread may change rapidly which makes taking the snapshot difficult. If you select this parameter, you can suspend the thread and take the snapshot.
-
Include Network Waits: Specify if network wait threads need to be included in the snapshot.
-
All Threads: Specify if all threads (active and idle) must be included in the snapshot.
-
Allow Trace Interrupt: Indicate whether the trace process can be interrupted.
-
-
Heap Dump: Select this option to generate a heap dump in response to a threshold violation. The Heap Snapshot Type can be:
-
Txt: Text (txt) for analysis in JVM Diagnostics.
-
HPROF: Binary format for analysis with external tools.
If a corrective action (trace dump or heap dump) is generated due to a threshold violation, the trace or heap dump files are displayed in the Event Details page. See Section 21.10, "Viewing JVM Diagnostics Threshold Violations".
-
-
-
Click Save to save the threshold values.
21.4.5 Removing a JVM Pool
You will see a warning message if you select the Remove Target option from the JVM Pool menu. The message displays the name of the target being deleted and that when a pool is deleted, all the JVM targets in the pool are also displayed. Click Yes to delete the JVM Pool or No to return to the JVM Pool Home page.
21.5 Managing JVMs
You can monitor a specific JVM in a pool, view historical and real time data, and so on. You can do the following:
21.5.1 Viewing the JVM Home Page
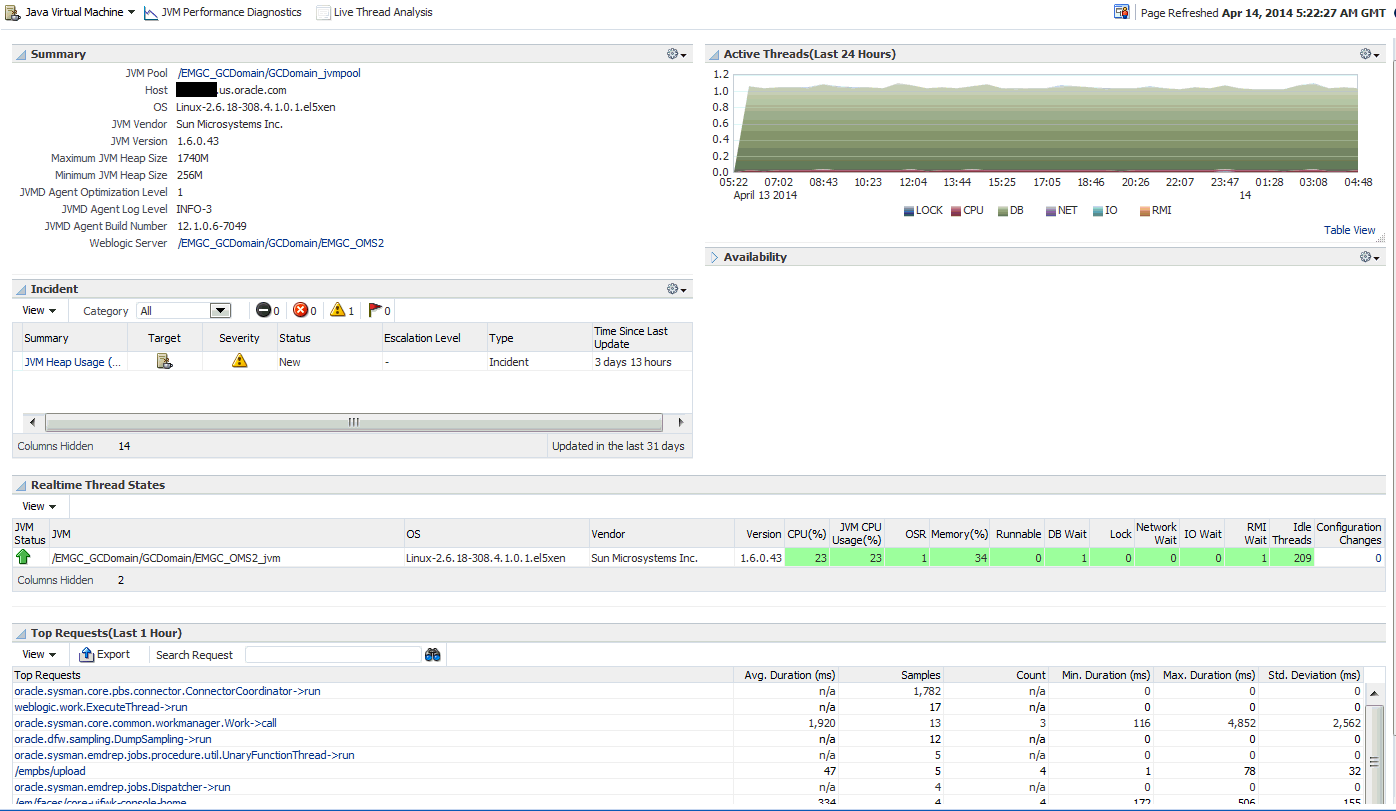
The JVM Home page shows the summary and configuration information of all the JVMs in the JVM pool. Follow these steps to view the JVM Home page:
-
From the Targets menu, select Middleware, then click on a Java Virtual Machine target.
-
The JVM Home page with the following details is displayed.
-
Summary: Shows details of the JVM such as the JVM Pool it belongs to, the host, Agent Optimization Level, Agent Log Level, JVM Version, and vendor details.
-
Incident: This region shows any open incidents that have occurred, the type, and category of the incident. Click on the Summary link to drill down to the Incident Details page.
-
Availability: The availability status of the JVM. Click on a Member link to drill down JVM Home Page.
-
Active Threads: The chart shows the number of active threads in the JVM in the last 24 hours.
-
Realtime Thread States: Shows the state of the various threads in the JVM in the color coded columns. The current activity of the JVM including CPU usage, memory, number of threads waiting for a database response, network response, or number of threads waiting for synchronization lock, idle threads, and configuration changes are displayed. Click on a JVM to view the list of threads in the JVM and the details of each thread.
-
Top Requests (Last 1 hour): This region shows the top requests over the last 1 hour. The average duration of the request, number of monitoring samples, the arrival count, throughput or the number of requests completed per minute, the minimum and maximum duration required to complete the request, and the standard deviation taken for the request to be completed are displayed.
-
21.5.2 Viewing the JVM Performance Diagnostics Page
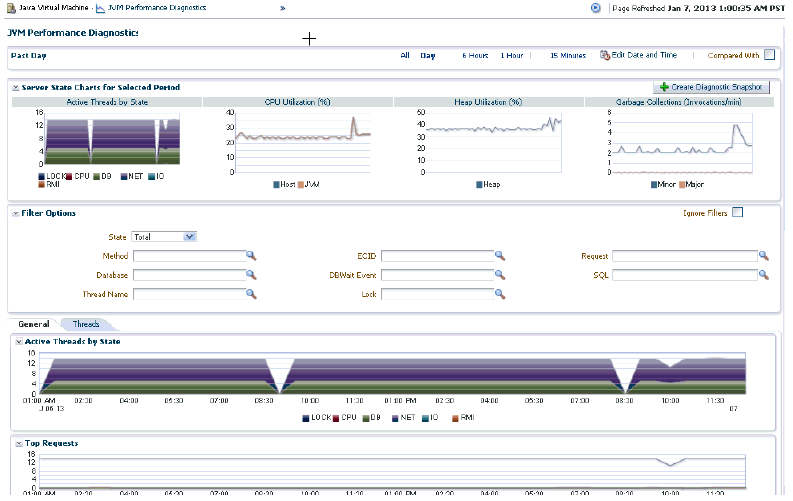
This page shows the summary and detailed information for a specific JVM. To view this page, select Middleware from the Targets menu and click on a Java Virtual Machine target. Select the JVM Performance Diagnostics option from the Java Virtual Machine menu.
This page shows the summary details of the JVM which include the Server State Charts, Active Threads by State, Top Methods, Top Requests, Top DBWait Events, Top SQLs, and Top Databases. You can filter the data that is displayed by specifying various criteria such as State, Method, Database, Thread Name, ECID, DBWait Event, Schema Name, Request Name, SQL, and Lock. If request names are not present, enter a '/' in the Request field. The Filter Menu for Request with a list of top requests is displayed. Select an entry from the table and click OK to set it as a filter.
Check the Ignore Filters checkbox if you want to ignore the specified filters. Select the Order by Duration checkbox in the Top Activities table to see the top 5 requests and SQLs by average duration.
Note:
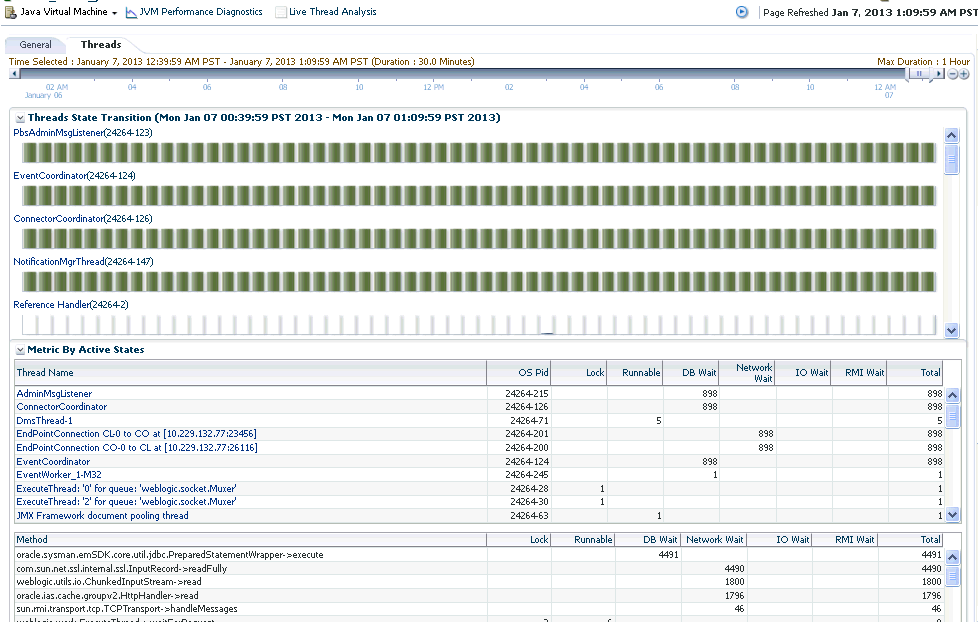
If you choose to filter the data based on Schema Name, you must ensure that the target or custom database has been registered and database cross tier correlation has been established.Click the Threads tab to view the Thread State Transition chart. This chart shows how the threads have transitioned from one state to the other in the selected period. You can change the time interval and move it to a different time period by using the quick time selection control at the top of the page. You can hover over the colored bars to see the transition changes from one state to the other, for example from Runnable to Not Active or to Runnable. The following server state charts are displayed:
-
Active Threads: This chart shows the status of all threads in the pool. The threads can be different states like RMI, IO, NET, DB, CPU and LOCK
-
CPU Utilization by JVM: This chart shows the CPU utilization for the JVM.
-
Heap Utilization by JVM: This chart shows the heap utilization for the JVM.
-
Garbage Collections: This chart shows the major and minor garbage collections for the JVM.
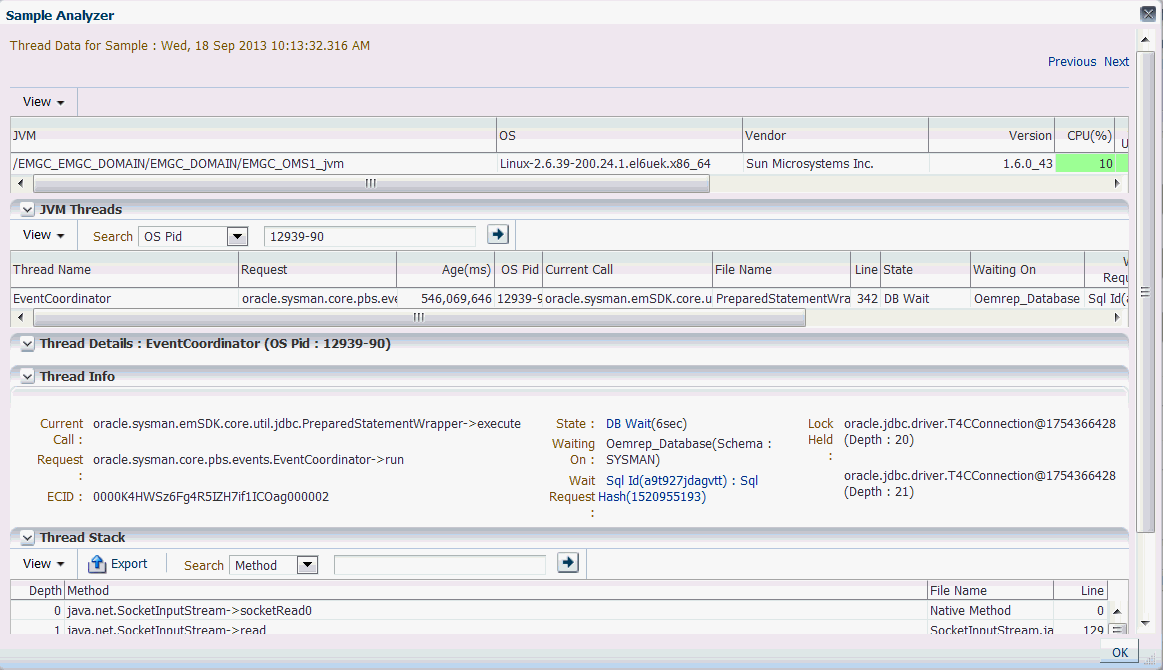
Click on a bar graph in the Thread State Transition chart to view the Sample Analyzer which provides a detailed analysis on the state of the thread. This feature allows you to analyze each sample (JVM snapshot at a specific time) in the monitored data.
In the JVM Performance Diagnostics page (Figure 21-11), you can do the following:
-
You can compare data between two periods. Select the Compared With checkbox and specify the comparison period. The data for the selected period and the current period is displayed.
-
Click the Create Diagnostics Snapshot link to collect diagnostic data for the JVM target for a specific period and analyze this data in offline. For more details, see Section 21.9, "JVM Offline Diagnostics"
21.5.3 Viewing the JVM Diagnostics Performance Summary
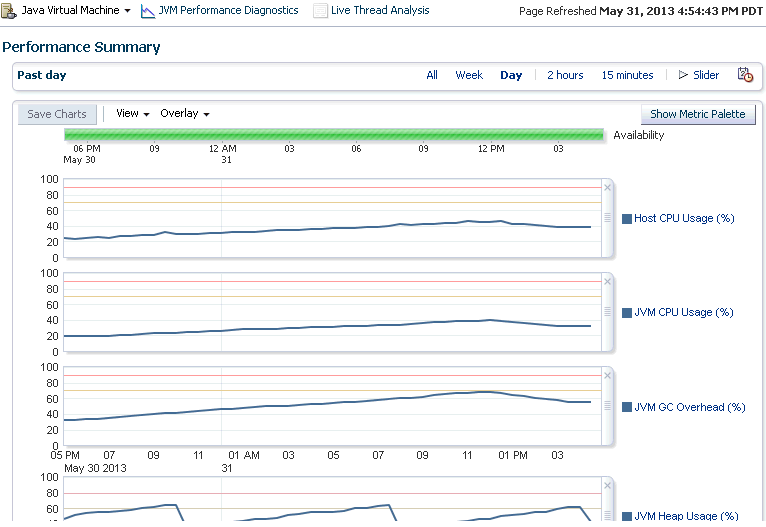
You can view the performance metrics (system and active threads) for a JVM target on the Performance Summary page. A set of charts is displayed on this page for the JVM target. To view the JVM performance metrics, follow these steps:
-
From the Targets menu, select Middleware, then click on a Java Virtual Machine target.
-
Select the Performance Summary option from the Java Virtual Machine menu. The following page appears:
-
A set of default charts that show the values of the JVM performance metrics over a period of time is displayed. Review the metrics for any periods of time where the Warning or Critical Thresholds were reached.
If any of the metrics exceed the Warning Thresholds or Critical Thresholds, it could indicate memory is a factor in the JVM performance and availability. It could mean there is a memory leak or that the JVM heap configuration is too small for the application load. If the heap configuration is correct, you must review the real time heap data. See Section 21.5.5, "Viewing the JVM Live Heap Analysis Page" for details. You can then create a snapshot that can be examined for leaks. See Section 21.5.7, "Taking a Heap Snapshot" for details.
-
Click the Show Metric Palette button. The metric palette has a folder for the current target (JVM) and the related targets. You can add or remove metric charts. Leaf nodes act as check boxes. Clicking a leaf node on causes a chart to be added. Clicking it off removes the metric. Dragging a leaf node from the palette to a chart or legend adds the metric to that chart.
21.5.4 Viewing the JVM Live Thread Analysis Page
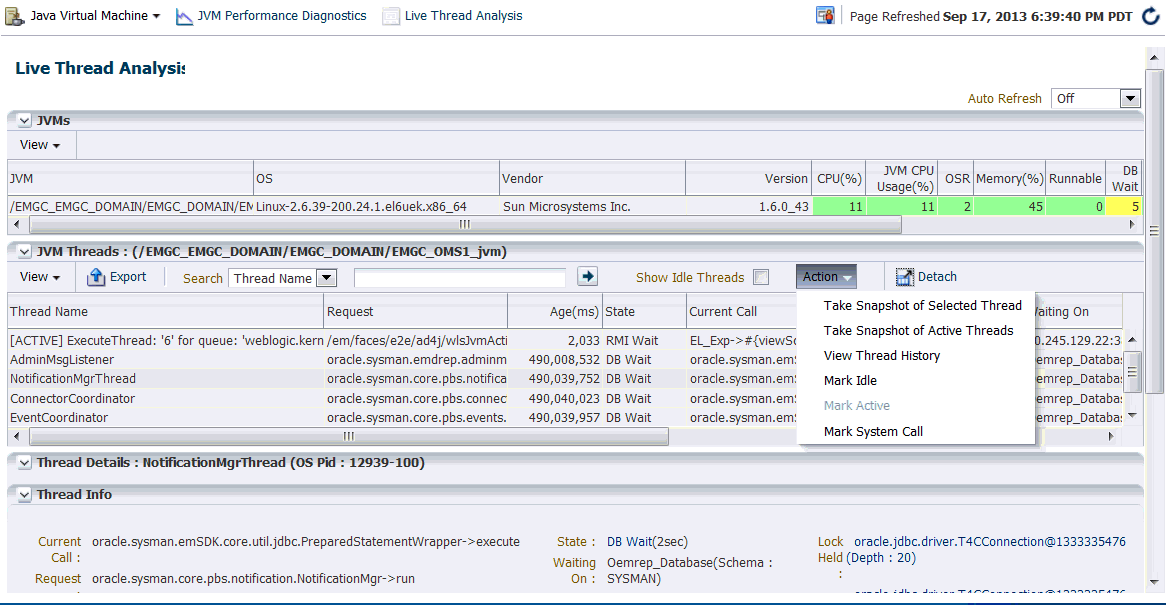
This page shows the real-time data for a selected JVM. This data is useful in analyzing the various active and idle threads on the JVM. During analysis you can drill down from the thread level to methods used in the thread, to local variables that are part of the method. To view this page, select Middleware from the Targets menu and click on a Java Virtual Machine target. Select the Live Thread Analysis option from the Java Virtual Machine menu.
You can also access this page by clicking the Live Thread Analysis link on top left corner of the page.
This page shows the following:
-
JVM Threads: This table shows a list of all the threads running in the JVM. Click on a thread to view the thread details in the Thread Info table. For each thread, the Thread Name, Request, Age, OS PID, Current Call, File Name, Line, State, Waiting On, Wait Time, Lock Held, ECID.
If the ADP or BTM Agent is running, the Request Name and Request Age is displayed. If a thread is in the DB Wait State, the Waiting On column displays the name of the database the thread is waiting on, and the time the thread has to wait is displayed in the Wait Time column. You can click on the link in the DB Wait column to view the database diagnostics details. This is helpful in tracking database issues and determining the application request responsible for the database activity.
Note:
You can view the database diagnostics details if:-
The JVM Diagnostics Agent is running on the JVM that initiated the request.
-
The monitored database must be registered by the JVM Diagnostics Engine.
You can perform the following actions:
-
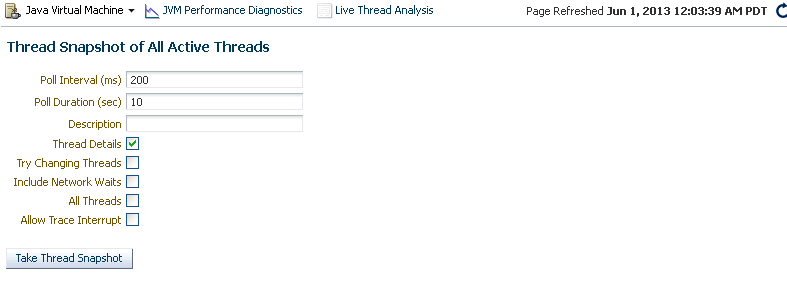
Take a Snapshot of a Selected Thread or Active Threads: Select a thread from the list and choose the Take Snapshot of a Selected Thread option from the Actions menu. The Thread Snapshot page is displayed where you take a snapshot. If you select the Take Snapshot of Active Threads option, you can take a snapshot of all active threads running on this JVM. You can specify the following parameters for each snapshot:
-
Poll Interval: Interval after which snapshot should be repeated.
-
Poll Duration: Duration for which the snapshot should be taken.
-
Thread Details: You can specify if the thread details need be included in the snapshot.
-
Try Changing Threads: Sometimes the stack associated with the thread may change rapidly which makes taking the snapshot difficult. If you select this parameter, you can suspend the thread and take the snapshot.
-
Include Network Waits: Specify if network wait threads need to be included in the snapshot.
-
All Threads: Specify if all threads (active and idle) must be included in the snapshot.
-
Allow Trace Interrupt: Indicate whether the trace process can be interrupted.
A snapshot file with details of the selected thread or active threads (depending on your selection) is generated. From the Java Virtual Machine Pool menu, select Thread Snapshots to view additional details.
-
-
Mark Idle: Select a thread from the list and from the Action menu, select Mark Idle to mark a thread as idle.
-
Mark Active: If you selected the Show Idle Threads check box, a list of idle threads is displayed. Select a thread and from the Action menu, select Mark Active to mark it as an active thread.
-
View Thread History: Select a thread and from the Action menu, select View Thread History. The historical data for the thread for the last 30 minutes is displayed.
-
Mark System Call: Apart from the threads defined as System Calls in the JVMD Configuration page (see Section 21.2.1, "Configuring the JVM Diagnostics Engine"), you can mark specific threads as system calls. Select a thread from the JVM Threads table. From the Action menu, select Mark System Call to mark this thread as a System Call. All user calls that are marked in this manner will now be treated as System Calls. If you selected a marked call and click Unmark System Call, the thread will now be treated as a User Call.
-
Show Idle Threads: Select this check box to list only the idle threads in the JVM Threads table.
-
-
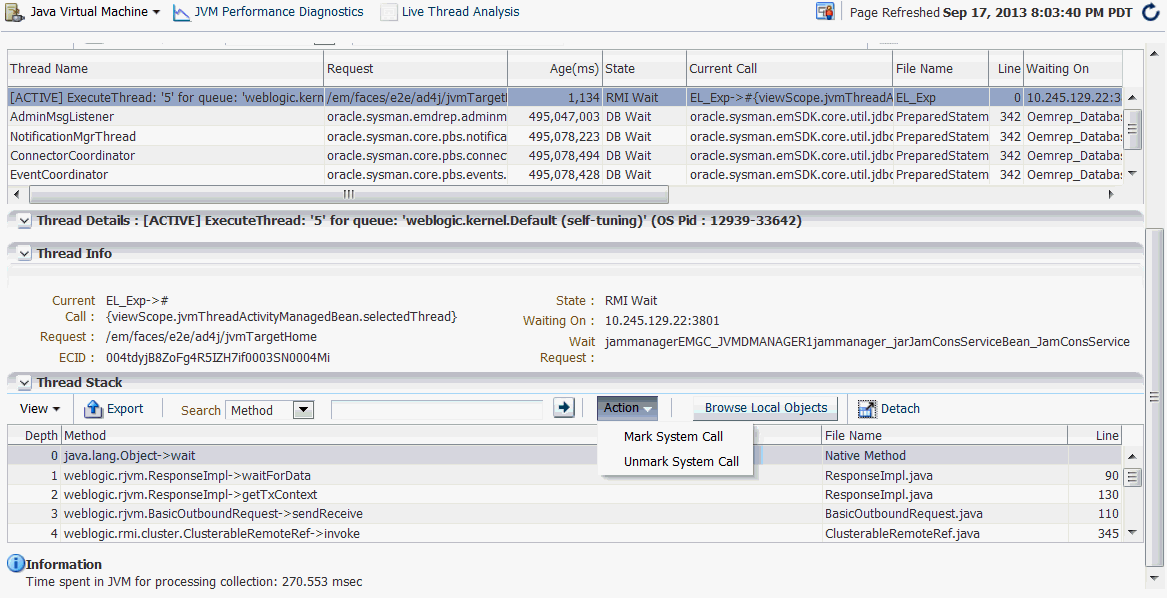
Thread Info: This section shows the detailed information for a selected thread. Details of thread including Current Call, Request, ECID, State, Waiting On, and Wait Request are displayed. If the thread is in the DB Wait State, click on the link to drill down to the Database Home page. See Section 21.5.4.1, "Cross Tier Analysis" for more details.
-
Thread Stack: The Thread Stack table shows the details of the selected thread such as the depth of the thread, methods used in the thread, file where the method is used, and the line number. You can drill down from the method level to a lower level. You can do the following:
-
Browse Local Objects: Select a method from the table and click Browse Local Objects. A popup window is displayed which shows the local variables, objects, their classes, and values.
-
Export: You can export the details of a selected thread to a file by clicking Export. You are prompted to specify the directory in which the file is to be stored. Enter the path and click Save to save the file in .csv format.
-
Mark / Unmark System Call: You can mark a selected method as a system call. Select a method from the Thread Stack table and from the Action menu, select Mark System Call. All methods marked in this manner will be treated as system calls. If you select a marked call and click Unmark System Call, the method will now be treated as a user call.
-
-
Auto Refresh: You can refresh the data that is displayed by specifying the Auto Refresh period.
21.5.4.1 Cross Tier Analysis
You can trace any JVM activity from the JVM thread to the database. You can view cross tier correlation for live threads and historical monitored data.
Before you establish cross tier correlation, ensure that the database is an Enterprise Manager target and has been registered with JVM Diagnostics. To register the database, select the Application Performance Management option from the Setup menu, then click Setup JVM Diagnostics in the Application Performance Management page. Click on the Register Databases tab. The list of registered database targets is displayed.
If the JVMD Agent Required field has a No value, you can proceed with the cross tier analysis. If the field has a Yes value, you must ensure that the root user or the same OS user who started the database must be running the JVM Diagnostics Database Agent on the target database machine. If the JVMD Agent Required field has a Status Unavailable value, you cannot perform cross tier analysis as the JDBC connection to the database cannot be established.
To view the cross tier correlation for live threads, follow these steps:
-
From the Targets menu, select Middleware, then click on a Java Virtual Machine target. Select the Live Thread Analysis option from the Java Virtual Machine menu. See Figure 21-8.
-
In the JVM Threads column, select a thread with a DB Wait State.
-
The thread details are displayed in the Thread Info section. If cross tier correlation has been established, you can see
SID=<value>"SERIALNUM=<value>when you hover over the State field. Click the DB Wait link. -
The Database Details popup is displayed which shows the host, port, SID, user, and JDBC URL for the target database. Click the Register All DB Targets link to register all database targets with JVM Diagnostics and refresh the Live Thread Analysis page.
Oracle Database 11g Release 2 supports special cross tier requirements for JVM Diagnostics and cross tier correlation is automatically established when you click the Register All DB Targets link. If you are using an earlier Oracle Database version, the registration process prompts you to run the JVM Diagnostics Agent on the host machine.
-
Click View Register Databases to navigate to the Registered Databases page where you can manually register the database target with JVM Diagnostics and check the value in the DB Agent Required column. Click Add, to add a database instance or a custom database. If you register a database as a custom database, the DB Name is displayed in the Waiting field in the Threads Info section but the cross tier correlation cannot be established.
To view the cross tier correlation for historical monitored data, follow these steps:
-
From the Targets menu, select Middleware, then click on a Java Virtual Machine target. Select the JVM Performance Diagnostics option from the Java Virtual Machine menu.
-
The three tables Top Databases, Top SQLS, and Top DBWait Events related to the cross tier are displayed. The Top Databases table shows the top databases in which JVM or JVMs in the pool have activities. The Top DBWait Events table shows the top DB Wait events caused by the JVM threads in the database. The Top SQLs table shows the list of SQL calls sorted by the number of samples. Click a SQL call to view the charts for that call. Click the top field of a table to launch a popup which shows the names of the database on which activity was performed.
-
Click the Database Name link to drill down to the Database Diagnostics page which shows the corresponding database activity.
-
Click the Top SQLs and Top DBWait Events links to navigate to the SQL Details page and the ASH Viewer page of database diagnostics.
If cross tier correlation has been established, you can view JVM Diagnostics activities for a database (drilling up from Database Diagnostics to JVM Diagnostics). Click the JVM Diagnostics link in the Performance page to drill up to the JVM Performance Diagnostics page. Data relevant to the time interval, database and other filters is displayed.
21.5.4.2 JVM Diagnostics - Oracle Real Application Cluster Drill-Down
Oracle Real Application Cluster (Oracle RAC) databases have a complex configuration of database instances and listeners. User applications use Oracle RAC services to connect to the database instead of SIDs that are used for single instance databases. User applications can connect to Oracle RAC listeners that are listening on different machines than the actual database instances. For cross tier correlation to be established, all the listener and database instances must be discovered targets in Enterprise Manager. Cross tier correlation can be established by using either of the following options:
-
If all the database instances in the Oracle RAC have been discovered in Enterprise Manager, follow these steps to establish cross tier correlation:
-
For every database instance in the Oracle RAC, add details of all the listeners servicing that database instance by specifying the
jvmd_db_listeners_additional_infoproperty whose value must be in the format"<listener name:listener host:listener IP:listener port,..."For instance, if the Oracle RAC has two database instances, l1 and l2 which are served by listeners L1 and L2 where L1 is listening on hostname H1, ip IP1 and port PORT1 and L2 is listening on hostname H2, ip IP2, and port PORT2, the value for the
jvmd_db_listeners_additional_infoproperty must be specified as 'L1:H1:IP1:PORT1,L2:H2:IP2:PORT2". Thejvmd_db_listeners_additional_infoproperty is used to ensure that host name and port number used in the JDBC URL in the application running on the server monitored by JVM Diagnostics matches the right database instance.For example, if the JDBC URL is "
jdbc:oracle:thin:@xxxx.oracle.com:1521:sid", the ”jvmd_db_listeners_additional_info'” property for all the database instances in the Oracle RAC, to which this URL is connecting must be ”LISTENER: xxxx.oracle.com:IP:1521” -
To add the
jvmd_db_listeners_additional_infotarget property to the database instance, follow these steps for each database instance:-
Enter the following command:
insert into mgmt_target_properties (TARGET_GUID, PROPERTY_NAME, PROPERTY_VALUE) values((select target_guid from mgmt_targets where target_name='<DB Instance Name>' and target_type='<oracle_database>'), ’jvmd_db_listeners_additional_info','LISTENER_<host1>:<host2>:<IP_add1>:<Service1>,LISTENER_<host3>:<host4>:<IP_add2>:<Service2>') -
Restart the JVM Diagnostics Engine.
-
Remove (if already registered) and re-register the database instance target (member of Oracle RAC) with JVM Diagnostics.
-
Ensure that this database instance is not registered as a custom database with JVM Diagnostics.
-
-
-
If all the database instances in the Oracle RAC have not been discovered in Enterprise Manager:
-
Register the database instances with JVM Diagnostics as custom databases. To register the custom databases, use the same hostname, IP address, and port number, as specified in the JDBC URL (in the application running on the server monitored by JVM Diagnostics).
-
21.5.5 Viewing the JVM Live Heap Analysis Page
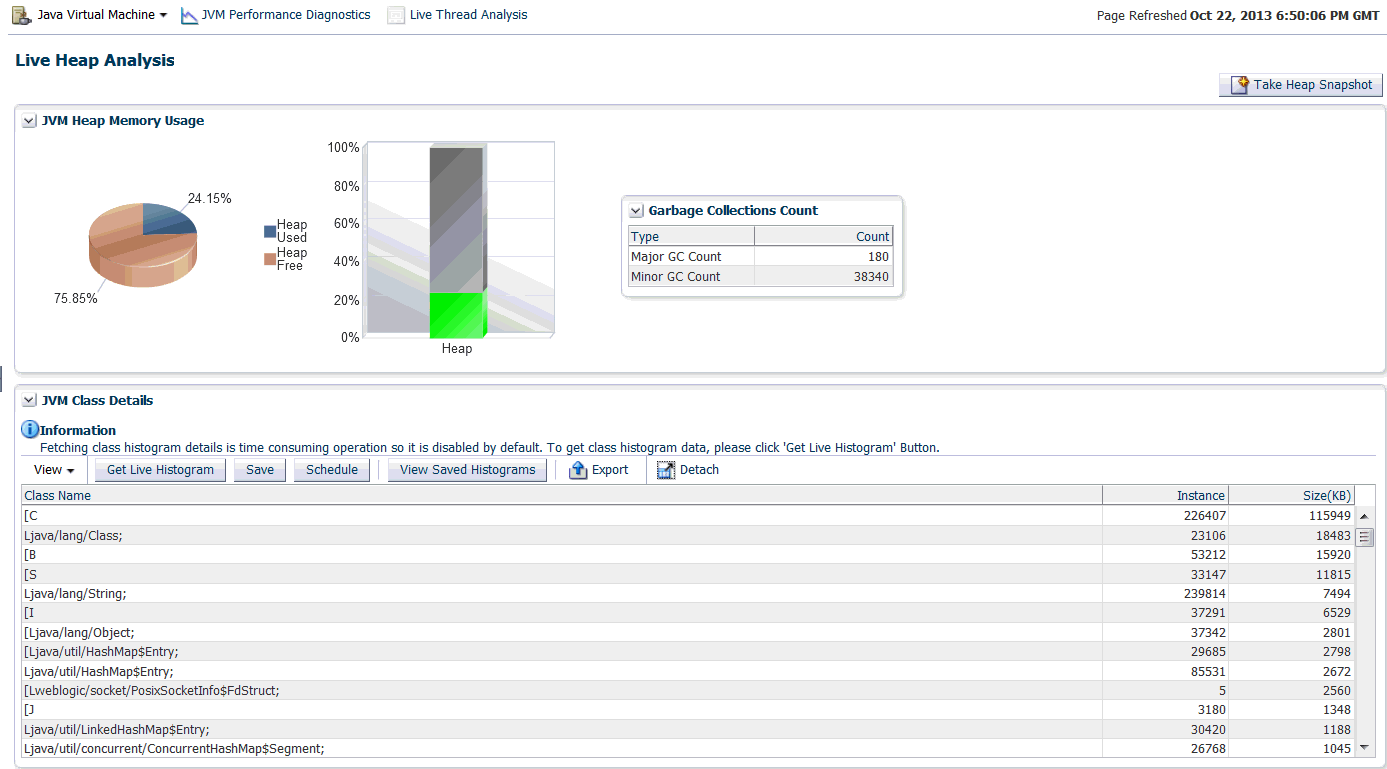
This page shows the real time organization of all objects in the JVM Heap. To view this page, select Middleware from the Targets menu and click on a JVM Pool target. Select the Live Heap Analysis option from the Java Virtual Machine menu.
If the JVM is running at Optimization Level 0, the following details are displayed:
-
Pie Charts and Bar Charts that show the percentage utilization of the entire heap (free versus used)
-
Major and Minor Garbage Collections Count
-
Options to take snapshots of active threads or a specific thread.
-
JVM Class Details table that displays all the classes in the JVM Heap in decreasing order of their size (in KB). You can export this data to an .xls file using the Export option.
Note:
For JVMs running at optimization level, the following details are displayed:-
JVM Heap Memory Usage table where the usage (in KB) in various heap spaces.
-
JVM Heap Number of Objects table which displays the number of objects in various heap spaces.
-
The following details are displayed:
-
Garbage Collections: The number of objects that have been added to the garbage collection. The type of garbage collection i.e. minor or major, and the number of garbage collections of a particular type is displayed.
-
JVM Class Details: A summary of the heap usage by different types of objects in the heap.
-
Class Name: The name of the space within the JVM heap.
-
Instance: The number of heap objects for number of instances of classes in a heap space.
-
Size: The size of the JVM heap.
-
You can do the following:
-
Take Heap Snapshot: Click Take Heap Snapshot to take a heap snapshot. See Section 21.5.7, "Taking a Heap Snapshot" for details.
-
Manage Class Histograms: A class histogram is displayed in the form of a table when the optimization level of the jamagent is 0. The histogram displays the top 300 data rows sorted by the size. You can perform several operations with histograms. For more details, see Section 21.5.6, "Working with Class Histograms".
21.5.6 Working with Class Histograms
A class histogram is displayed in the form of a table when the optimization level of the jamagent is 0. The histogram displays the top 300 data rows sorted by the size. You can perform various operations on class histograms. This section describes the following:
21.5.6.1 Saving a Class Histogram
To save a class histogram, follow these steps:
-
From the Targets menu, select Middleware, then click on a Java Virtual Machine target. Select the Live Heap Analysis option from the Java Virtual Machine menu.
-
In the Live Heap Analysis page, scroll down to the JVM Class Details table. Click Save.
-
In the Save Class Histogram window, enter a name for the snapshot and a description and click OK.
21.5.6.2 Viewing Saved Histograms
To view saved histograms, follow these steps:
-
From the Targets menu, select Middleware, then click on a Java Virtual Machine target. Select the Live Heap Analysis option from the Java Virtual Machine menu.
-
In the Live Heap Analysis page, scroll down to the JVM Class Details table. Click View Saved Histograms. The Available Heap Snapshots page appears.
-
Scroll down to the Available Class Histograms table to view a list of saved class histograms.
21.5.6.3 Scheduling a Histogram Job
Scheduling will allow you to insert JVM Class Histogram data into the repository by running the job at the defined time. To schedule a class histogram job, follow these steps:
-
From the Targets menu, select Middleware, then click on a Java Virtual Machine target. Select the Live Heap Analysis option from the Java Virtual Machine menu.
-
In the Live Heap Analysis page, scroll down to the JVM Class Details table. Click Schedule. The Schedule Settings job appears.
-
Enter a name and description for the job to be scheduled.
-
Specify the schedule as Immediate or Later. If you select Later, you can specify if the job needs to be run only once or repeated at specified intervals.
-
Select the frequency at which you want to repeat the job from the Repeat drop-down list.
-
Select the option for the Grace Period. If you select the grace period, the job will remain active and run within the specified grace period.
-
Click OK to schedule the histogram job. A confirmation window appears indicating that the job has successfully submitted.
To view the job status, from the Enterprise menu, select Job, then select Activity. Select the Job Type as All, and Target Type as Targetless to see the histogram job.
21.5.6.4 Comparing Class Histograms
The compare functionality allows you to compare any two class histogram snapshots listed in the table. To compare class histograms, follow these steps:
-
From the Targets menu, select Middleware, then click on a Java Virtual Machine target. Select the Live Heap Analysis option from the Java Virtual Machine menu.
-
In the Live Heap Analysis page, scroll down to the JVM Class Details table. Click View Saved Histograms. The Available Heap Snapshots page appears.
-
Scroll down to the Available Class Histograms table to view a list of saved class histograms. Select any two class histograms and click Compare. The Compare Class Histograms page appears. The Class Name, Instance Size (size of each snapshot), and Number of Instances (for each snapshot) are displayed.
21.5.6.5 Deleting Class Histograms
To delete class histograms, follow these steps:
-
From the Targets menu, select Middleware, then click on a Java Virtual Machine target. Select the Live Heap Analysis option from the Java Virtual Machine menu.
-
In the Live Heap Analysis page, scroll down to the JVM Class Details table. Click View Saved Histograms. The Available Heap Snapshots page appears.
-
Scroll down to the Available Class Histograms table to view a list of saved class histograms. Select the class histogram you want to delete and click Remove. A confirmation message is displayed. Click OK to delete the class histogram.
21.5.7 Taking a Heap Snapshot
A heap snapshot is a snapshot of JVM memory. It shows a view of all objects in the JVM along with the references between those objects. It can be used to study memory usage patterns and detect possible memory leaks. To take a heap snapshot, follow these steps:
-
From the Targets menu, select Middleware, then click on a JVM target. The JVM Home page is displayed.
-
Select Live Heap Analysis from the Java Virtual Machine menu.
-
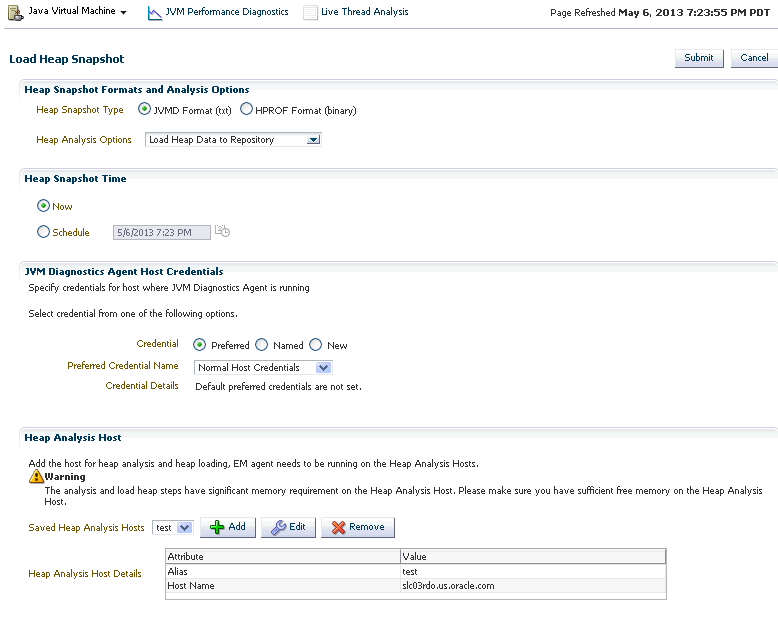
Click Take Heap Snapshot. The Load Heap Snapshot page appears.
-
Specify the Heap Snapshot Type. This can be:
-
JVMD Format (txt) for analysis in JVM Diagnostics.
-
HPROF Format (binary) for analysis with external tools.
-
-
In the Heap Analysis Options field, select the required option from the drop down menu.
-
Take a Heap Snapshot Only: If you want to take a heap snapshot and load it to the repository at a later date, you must leave this field blank. Specify the schedule and click Submit. The heap snapshot is generated and the file name in which it is stored is displayed. You can upload the heap snapshot and analyze it using appropriate options from the Heap Snapshots menu.
-
Load Heap Data to Repository: Select this option to take a heap snapshot and automatically load it to the repository. If you select this option, you must ensure that the following prerequisites are met:
-
The Management Agent must be deployed on the host machine on which the JVM target is running.
-
The Heap Loader Host is a standalone machine (with high CPU and Memory) on which the Management Agent has been deployed.
-
DB Client Home which is the location of ORACLE_HOME where sqlldr & sqllplus are present.
-
There should be sufficient disk space in the system temp directory.
-
A JVM Diagnostics DB User must have been created using the
create_jvm_diagnostic_db_userscript.
-
-
Generate Memory Leak Report: Select this option to generate a memory leak report. The memory leak report tab shows the potential memory leak sources by identifying frequent patterns in the heap graph.
-
Generate Anti-pattern Report: Select this option to generate an anti-pattern report. This report shows the summary or one kind of anti-pattern issue. This option is available only if the Heap Snapshot Type is HPROF (binary).
-
-
In the Heap Snapshot Time field, specify whether the heap snapshot is taken immediately or at a later date.
-
Specify the credentials for the host on which the JVM Diagnostics Agent is running.
-
If the Heap Loader Host has not been configured, click Add. Provide an Alias for the host and select the host (Heap Analysis Host) target on which the Management Agent is running. Click Save.
-
If the Heap Loader Host has already been configured, the Available Heap Loaders are displayed. Select a heap loader from the list and enter the credentials for the Heap Loader host.
Note:
-
If preferred credentials for JVM Target & Heap Loader host are set, then the Enter Credentials region will not be displayed.
-
If the Named Credentials for the JVM Diagnostics DB User is set, the Enter Credentials region will not be displayed.
-
-
Click Submit to submit the heap snapshot job. A confirmation message is displayed. Click Yes to continue. The job details are displayed in the Heap Analysis Job page. Click on the link to view the job status.
21.5.8 Analyzing Heap Snapshots
The JVM Diagnostics memory analysis feature allows you to not only find the objects responsible for the growth but also track their reachability from the root-set. With this feature, you can find the dangling reference responsible for memory leaks. To find a memory leak, you take snapshots of the JVM heap at different points in time. Between the snapshots, your JVM and Java applications continue running at full speed with zero overhead.
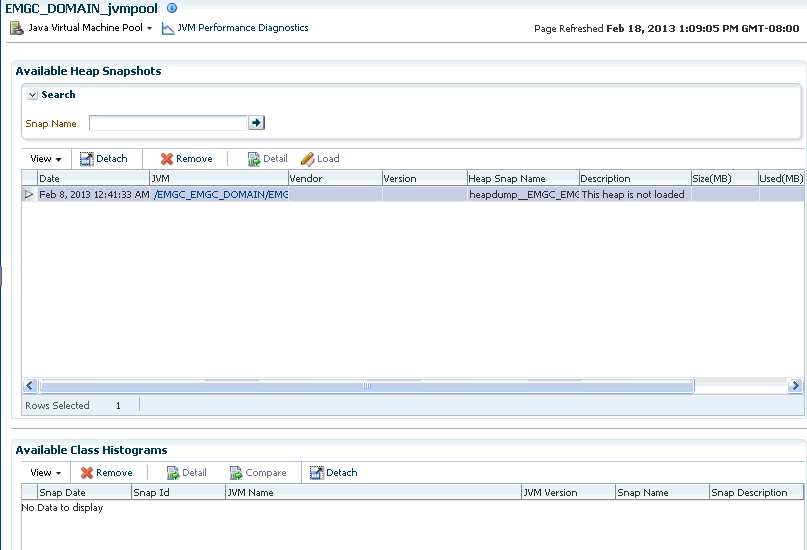
A heap snapshot is a snapshot of JVM memory. Each snapshot stores information about the objects in the heap, their relationships and root-set reachability. You can load the snapshots into the repository, and compare them to see where the memory growth has occurred. Click Heap Snapshots and Class Histograms from the menu in the JVM Pool or JVM Home page. The following page appears:
This page contains the following regions:
-
Available Heap Snapshots: You can specify the Target Name and Target Type to filter the heap snapshots that are displayed. You can also specify the Heap ID in the Snap Name field to search for specific heap snapshots and display them. The following details is displayed:
-
Heap ID: The identification number for the heap snapshot.
-
Date: The date on which the heap snapshot was taken.
-
JVM Name: The server on which the JVM is running.
-
Vendor: The name of the JVM Vendor.
-
Size: The total size of the Java heap. An adequate heap size helps improve the performance of the application.
-
Used: The amount of heap that has already been used.
Note:
If the heap snapshot was taken in HPROF format, the value in the Size and Used fields will be 0. -
Used(%): The percentage of heap used.
You can do the following:
-
Click Create to take a heap snapshot. See Taking a Heap Snapshot.
-
Select a heap snapshot and click the Detail link to drill down to the Roots page. See Viewing Heap Usage by Roots.
-
Select a heap snapshot and click Load to load the heap snapshot to the repository. See Uploading Heap Snapshots.
-
Select a heap snapshot and click Reports to download heap reports to the local host. These reports must have been generated and loaded to the repository for the selected heap snapshot. You can download the Memory Leak Report and the Antipattern Report.
-
-
Available Class Histograms: The list of saved histograms with details such as date on which the snapshot was taken, Snap ID, Timestamp, JVM Name and Version, Description are displayed. See Section 15.5.6, "Working with Class Histograms" for more details.
21.5.8.1 Viewing Heap Usage by Roots
To view the heap usage by each class of root, follow these steps:
-
From the Targets menu, select Middleware, then click on a Java Virtual Machine or a Java Virtual Machine Pool target.
-
Select Heap Snapshots and Class Histograms from the Java Virtual Machine or Java Virtual Machine Pool target.
-
The list of available heaps is displayed. Select a heap snapshot and click Details to view the number of objects and memory reachable from each root. Click on the Root tab to view the objects directly reachable from the root. The following details are displayed:
Click on the Root link to view the objects directly reachable from the root. The following details are displayed:
-
Root: The name of the root is displayed here. Click on the name to drill down to the Top 40 Objects page.
-
Object: The total number of objects reachable from this root.
-
KB: The total amount of memory reachable from this root.
-
Adj: The adjusted memory reachable from this root. This parameter is useful in tracking the memory leak hot-spots.
-
Retained Memory: The total size of all objects that would be removed when garbage collection is performed on this node.
Click Compare with to compare the heap snapshot with another one. See Comparing Heap Snapshots for details.
-
21.5.8.1.1 Top 40 Objects
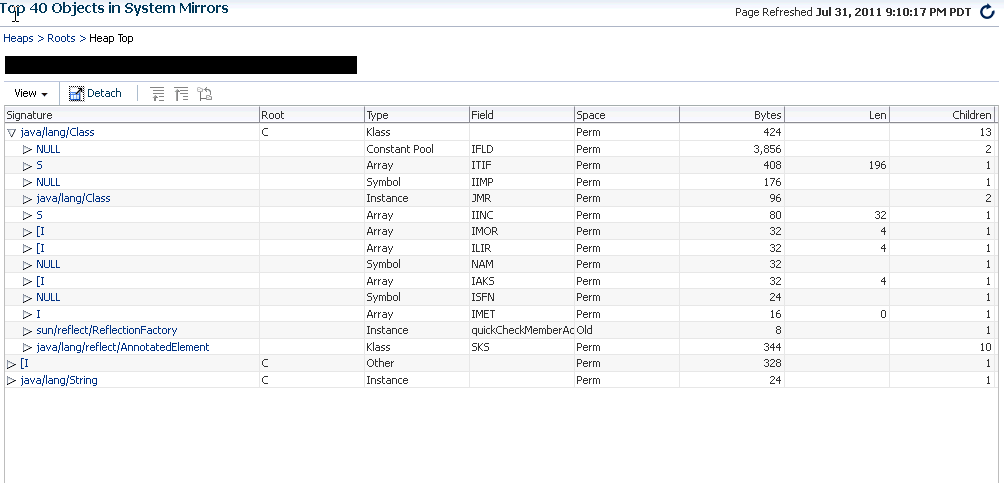
This page shows the top 40 objects reachable from a root. The objects are sorted in descending order by the ascending memory reachable from the object (or the difference of the adjusted memory reachable when comparing two heaps). This view provides a lot of rich detailed information like the amount of memory used by an object, amount of memory reachable by an object (total memory used by all the children), and number of objects reachable from a given object.
The following details are displayed:
-
Signature: The signature of the object. Click on the link to drill down to the Heap Object Information page.
-
Root: The internal root identifier.
-
Type: The type of the object which can be Klass, Instance, Method, and so on.
-
Space: The heap space in which the object is present.
-
Bytes: The amount of space used by the object.
-
Len: If the object is an array, the length of the array is displayed here.
-
Children: The number of descendants reachable from the object.
-
Adj: Adjusted memory reachable from this object.
-
Retained Memory: The total size of all objects that would be removed when garbage collection is performed on this node.
-
Depth: Indicates how far this object is from the root.
21.5.8.1.2 Heap Object Information
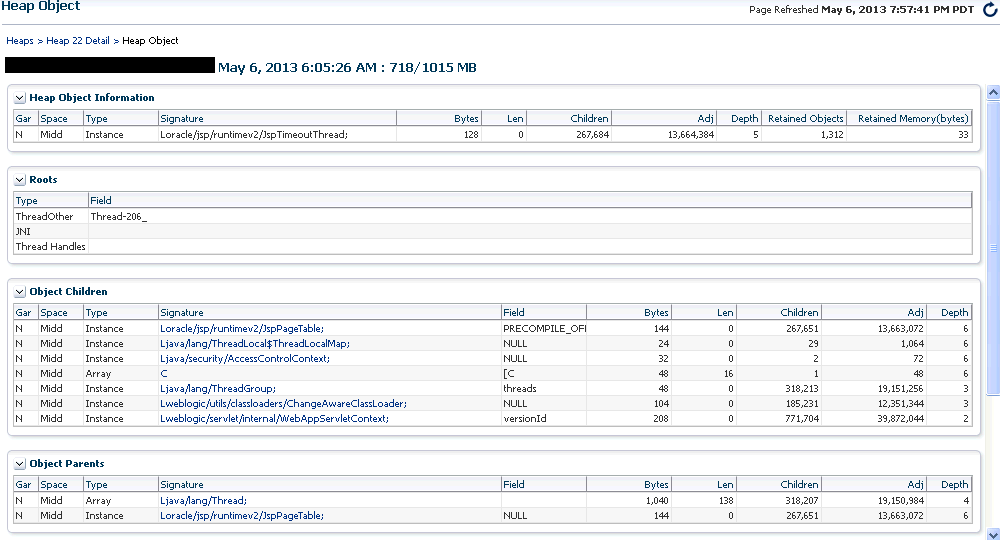
This page shows information about a specific object in the heap snapshot. The following details are displayed:
-
Heap Object Information
-
Gar: Indicates whether this object is garbage or reachable from the root.
-
Space: The heap space in which the object is present.
-
Type: The type of the object which can be Klass, Instance, Method, and so on.
-
Signature: The signature of the object.
-
Bytes: The amount of space used by the object.
-
Len: If the object is an array, the length of the array is displayed here.
-
Children: The number of descendants reachable from the object.
-
Adj: Adjusted memory reachable from this object.
-
Depth: Indicates how far this object is from the root.
-
-
Roots
-
Type: The type of root which can be Klass, Instance, Method, and so on.
-
Field: If the root is a local thread, this field contains information about the thread and method.
-
-
Object Children
-
Gar: Indicates whether this child is garbage or reachable from the root.
-
Space: The heap space in which the child is present.
-
Type: The type of the child which can be Klass, Instance, Method, and so on.
-
Signature: The signature of the child. Click on the link to drill down to the Details page.
-
Bytes: The amount of space used by the child.
-
Len: If the child is an array, the length of the array is displayed here.
-
Children: The number of descendants reachable from the child.
-
Adj: Adjusted memory reachable from this child.
-
Depth: Indicates how far this child is from the root.
-
-
Object Parents
-
Gar: Indicates whether this parent is garbage or reachable from the root.
-
Space: The heap space in which the parent is present.
-
Type: The type of the parent which can be Klass, Instance, Method, and so on.
-
Signature: The signature of the parent. Click on the link to drill down to the Details page.
-
Bytes: The amount of space used by the parent.
-
Len: If the parent is an array, the length of the array is displayed here.
-
Children: The number of descendants reachable from the parent.
-
Adj: Adjusted memory reachable from this parent.
-
Depth: How far this parent is from the root.
-
21.5.8.1.3 Comparing Heap Snapshots
To find a memory leak, you can take snapshots of the JVM Heap at different points in time. Each snapshot stores information about the objects in the heap, their relationships and root-set reachability. You can compare two heap snapshots to see where the memory growth has occurred.
-
From the Targets menu, select Middleware, then click on a JVM or JVM Pool target.
-
Select Heap Snapshots option from the Java Virtual Machine or Java Virtual Machine Pool menu.
-
The list of available heaps is displayed. Click the Compare Heaps tab. The first heap in the list is selected for comparison and you are prompted to select the second heap.
-
The two heaps are compared and a comparison table is displayed in the Diff Heaps page. The details of each heap with the following details are displayed:
-
Objects: The total number of objects reachable from the root.
-
KB: The total amount of memory reachable from the root.
-
Adj: The adjusted memory reachable from this root. This parameter is useful in tracking the memory leak hot-spots. It provides a better representation of the memory used by an object by ignoring backwards pointing references from child objects to their respective parent object.
-
Delta: The difference in the total memory and adjusted reachable memory of the two heaps that are being compared.
-
-
Click on the root-set with the most growth to diagnose the memory leak.
-
Click the View Summary button to see a bottom up view of memory reachable by class of objects.
21.5.8.2 Viewing Heap Usage by Objects
Click the Usage tab to view the heap usage by objects. The following details are displayed:
-
Object Type: The type of object, Instance, Array, Klass, and so on.
-
Garbage: Indicates if this is garbage or reachable from root.
-
Objects: The total number of objects.
-
Total Memory: The total amount of memory reachable by root.
Click Compare with to compare the heap snapshot with another one. See Comparing Heap Snapshots for details.
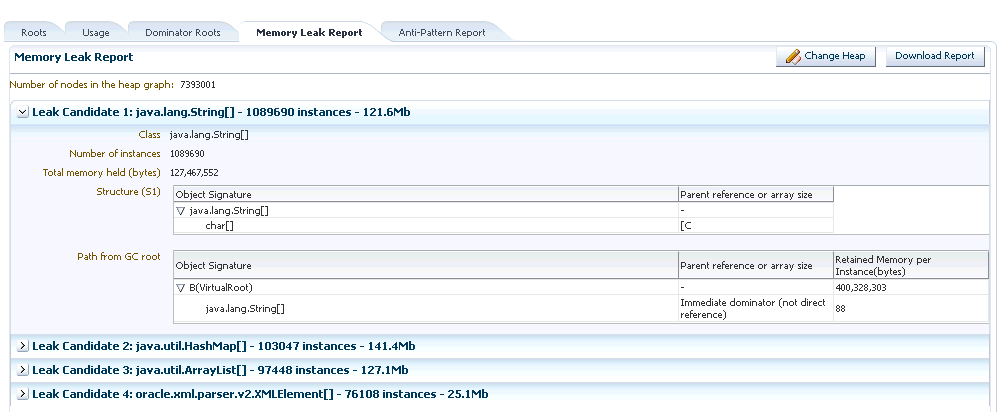
21.5.8.3 Memory Leak Report
Click the Memory Leak Report tab to view the memory leak report.
The memory leak report shows the potential memory leak sources by finding frequent patterns in the heap graph. This tab shows a list of memory leak candidates which contain the most frequent patterns in a heap and could represent potential memory leak sources. Click Download Report to download the memory leak report in .txt format.
21.5.8.4 Anti-Pattern Report
Click the Anti-Pattern Report tab. The Anti-Pattern report is divided to different sections. Each section either shows the summary or one kind of anti-pattern issue. The first section contains a summary of the most acute problems detected by JOverflow. The second section contains the total number of Java classes and Java objects. It also contains a histogram for top memory usage objects grouped by the Class. The third section shows the reference chains for high memory consumers. Each anti-pattern section calculates the overhead that shows the amount of memory that could be saved if the problem is eliminated.
21.5.9 Managing JFR Snapshots
Note:
This section assumes that Enterprise Manager is running on JRockit VM.JRockit Flight Recorder (JFR) provides a wealth of information on the inner workings of the JVM as well as on the Java program running in the JVM. You can use this information for profiling and for root cause analysis of problems. Furthermore, JRockit Flight Recorder can be enabled at all times, without causing performance overhead—even in heavily loaded, live production environments.
You can create JFR snapshots that include thread samples, which show where the program spends its time, as well as lock profiles and garbage collection details. To create a JFR snapshot, follow these steps:
-
From the Targets menu, select Middleware, then click on a JVM target.
-
From the Java Virtual Machine menu, select JFR Snapshots.
-
Click Create. In the Create JFR Snapshot window, enter a description and click Create. The newly created snapshot appears in the JFR Snapshots page.
Downloading a JFR Snapshot
Select the JFR snapshot to be downloaded and click Download. You are prompted for the host credentials. Enter the credentials and click Download and specify the location on which the snapshot is to be saved. You can analyze this snapshot using JRockit Mission Control (JRMC).
Note:
You can download the JFR snapshot only if the JVM target is running on an Enterprise Manager monitored host.21.5.10 Configuring a JVM
From the Targets menu, select Middleware, and then click on a Java Virtual Machine target. Select the Configure JVM Target option from the Java Virtual Machine menu. The Edit JVM Information page is displayed. You can change the JVM Pool, location of the Heap Dump Directory, and the Log Level. Click Save to save the changes.
21.5.11 Removing a JVM
You will see a warning message if you select the Remove Target option from the JVM menu. The message displays the name of the target being deleted. Click Yes to delete the JVM or No to return to the JVM Home page.
21.6 Managing Thread Snapshots
If a particular request is slow or hanging or if the entire application is slow, you can run the real-time transaction trace to view current Java application activity. You can look at the offending threads and their execution stack and analyze how much time a thread spent in waiting for DB wait or wait on a lock. Complex problems such as activity in one thread (or request) affecting the activity in the other thread or rest of the JVM can be found very quickly.
You can trace all active threads and generate a trace file that contains details such as resource usage, thread states, call stack information, and so on. During tracing, the state and stack of the target thread is sampled at set intervals for the desired duration. Follow these steps to trace active threads:
-
From the Targets menu, select Middleware, then select a Java Virtual Machine target.
-
Select the Thread Snapshots option from the Java Virtual Machine menu. The Thread Snapshots page appears.
All the traces that have been loaded into the repository using the Trace Active Threads option are displayed here. For each thread, the Thread Snapshot ID, the date, JVM Name, Thread Name, Duration, and the number of samples taken during the trace is displayed. The Thread column indicates if all threads or only active threads have been traced.
-
Click Create to take a thread snapshot of all active threads in the JVM. The Thread Snapshot of All Active Threads page appears where you can trace the active threads. See Section 21.6.1, "Tracing Active Threads" for details.
-
Select a thread and click the Details link to drill down to the Diagnostic Image Analysis page.
-
Select a thread snapshot and click Import to upload a thread snapshot from your local machine. The Import Thread Snapshot dialog box is displayed. Click Browse and select the thread snapshot to be imported and click OK.
21.6.1 Tracing Active Threads
To trace active threads, follow these steps:
-
Click Create in the Thread Snapshots page. The Thread Snapshot of All Active Threads page appears.
-
Specify the following details:
-
Poll Interval (ms): The time interval between successive samples. The default value is 200 ms but can be changed.
-
Poll Duration (sec): The duration for which the thread snapshot should be taken.
-
Trace Thread Details: If this box is unchecked, only the last user call for the active thread will be stored. If the box is checked, all calls for the active thread will be stored, so you can view the call stack. Checking the box increases the overhead and space requirements
-
Try Changing Threads: If a thread stack changes during a sample (this can happen when a thread is using CPU), JVM Diagnostics will skip that thread for that sample. If you find missing samples, use this feature to retrace the changed stacks. This will retry (up to 5 times) threads with changing stacks. It will also make system calls to get the stack if possible.
-
Include Network Waits: Most JVMs have large number of idle threads waiting for network events. If you leave this check box unchecked, idle threads will not be included in the trace. Checking this box increases the overhead and space requirements.
-
Trace All Threads: Check this box if both idle and active threads will be included in the trace.
-
Allow Trace Interrupt: Allows you to interrupt the trace process.
-
-
Click Take Thread Snapshot and click OK to generate the trace file. When the trace has been completed successfully, click here link to view the trace data in the Diagnostics Image Analysis page.
21.7 Analyzing Trace Diagnostic Images
A trace diagnostic image contains details such as resource usage, thread states, call stack information etc. The trace diagnostic image captures thread data at short intervals. If an application is hanging or is slow, you can analyze these threads and find out the application tier that causing the delay.
On the Diagnostic Image Analysis page, you can:
-
Click Description to view details of the thread snapshot being analyzed. The following Server State charts are displayed:
-
Active Threads by State: This chart shows the status of all threads in the JVM. The threads can be in different states like RMI, IO, NET, DB, CPU, and LOCK.
-
CPU Utilization by JVM: This chart shows the CPU utilization in the JVM.
-
Heap Utilization by JVM: This chart shows the heap utilization in the JVM.
-
-
You can filter the data that is displayed by specifying various criteria such as Method Name, JVM Name, Thread State, DBState, and so on. Check the Ignore Filters check box if you want to ignore the specified filters. The Active Threads by State, Top Requests, Top Methods, Top SQLs, Top DBWait Events, and Top Databases charts are displayed.
-
Click on the Threads tab to view the Thread State Transition, Metric By Active States, and Method data.
21.8 Viewing the Heap Snapshots and Class Histograms
The JVM Diagnostics memory analysis feature allows you to not only find the objects responsible for the growth but also track their reachability from the root-set. With this feature, you can find the dangling reference responsible for memory leaks.To find a memory leak, you take snapshots of the JVM heap at different points in time. Between the snapshots, your JVM and Java applications continue running at full speed with zero overhead.
To view and analyze the heap usage, select Heap Snapshots and Class Histograms from the Java Virtual Machine Pool or Java Virtual Machine menu. The following regions are displayed:
-
Available Heap Snapshots: You can specify the Target Name and Target Type to filter the heap snapshots that are displayed. You can also specify the Heap ID in the Snap Name field to search for specific heap snapshots and display them. The following details is displayed:
-
Heap ID: The identification number for the heap snapshot.
-
Date: The date on which the heap snapshot was taken.
-
JVM Name: The server on which the JVM is running.
-
Size: The total size of the Java heap. An adequate heap size helps improve the performance of the application.
-
Used: The amount of heap that has already been used.
-
Used(%): The percentage of heap used.
You can do the following:
-
Select a heap snapshot and click the Detail link to drill down to the Roots page. See Section 21.5.8.1, "Viewing Heap Usage by Roots".
-
Select a heap snapshot and click Load to load the heap snapshot to the repository.
-
Select a heap snapshot and click Reports to download heap reports to the local host. These reports must have been generated and loaded to the repository for the selected heap snapshot. You can download the Memory Leak Report and the Antipattern Report.
-
-
Available Class Histograms: The list of saved histograms with details such as date on which the snapshot was taken, Snap ID, Timestamp, JVM Name and Version, Description are displayed. The following options are available:
-
Details: Click this option to drill down to a detailed view of the heap.
-
Compare: Select two rows and click Compare. The Class Name, Instance Size (size of each snapshot), and Number of Instances (for each snapshot) are displayed.
-
21.9 JVM Offline Diagnostics
Diagnostic data for one or more JVM targets can be collected for a specific period and analyzed in an offline mode. This section describes the various options that are available to collect live JVM data and analyze it in offline mode. It contains the following sections:
21.9.1 Creating a Diagnostic Snapshot
You can create diagnostic snapshots for one or more JVM targets for a specified period. To create a diagnostic snapshot, specify the following:
-
From the Targets menu, select Middleware.
-
Select the Diagnostic Snapshots option from the Middleware Features menu.
The Create Diagnostic Snapshot option is also available in the JVM Performance Diagnostics page. Navigate the Performance Diagnostics page for a JVM, specify the time range for which you want to create the collection and click Create Diagnostic Snapshot.
-
Click Create in the Diagnostic Snapshots page. You can navigate to this page by clicking Offline Diagnostics on the Diagnostic Image Analysis page.
-
Enter a name and description for the diagnostic snapshot.
-
Specify the duration for the diagnostic snapshot.
-
Click Add. Select one or more JVM targets for which the diagnostic data is to be collected.
Note:
The JVM targets that you select must belong to the same JVM Pool. -
Select the diagnostic types for the selected target and click OK. You will see a pop-up window that indicates that the diagnostic snapshot is being created. Click Close after the diagnostic snapshot has been created. You will return to the Diagnostic Snapshots page.
21.9.2 Using the Diagnostic Snapshots Page
You can collect diagnostic data for one or more JVM targets and analyze them in an offline mode. This page shows the list of diagnostic snapshots that have been created. You can specify search criteria to retrieve a specific snapshot. You can do the following:
-
Create: Click Create to create diagnostic snapshots for one or more JVMs. The Create Diagnostic Snapshot page is displayed.
-
Export: Select a file and click Export to export the diagnostic data to a file. Enter the location in which the file is to be stored. You can review and analyze the saved file in an offline mode on the same or a different host machine.
-
Import: Click Import to import an exported file with diagnostic data for a particular collection object. Specify the name of the file and upload the file from your system. You can analyze the exported file and view a summary of the diagnostic snapshot.
-
Analyze: Select a file and click Analyze. The Analyze Diagnostic Snapshot page is displayed.
-
Delete: Select a diagnostic snapshot from the list and click Delete. A confirmation message is displayed. Click OK to delete the diagnostic snapshot.
-
View: Select a file and click View. The View Diagnostic Snapshot page is displayed.
21.9.3 Analyzing a Diagnostic Snapshot
This page displays the summary details of the diagnostic snapshot and a summary of all the diagnostic types of the diagnostic snapshot. You can view the thread stack, thread states, CPU Utilization, Heap Utilization, Active Threads Graphs, and Garbage Collections.
To analyze a diagnostic snapshot, follow these steps:
-
From the Targets menu, select Middleware.
-
Select the Manage Diagnostic Snapshots option from the Middleware Features menu.
-
In the Diagnostic Snapshots page, select a snapshot from the list and click Analyze.
-
You can analyze details for each JVM for the specified time interval. Click More Details to view detailed diagnostics information for the JVM. The Diagnostic Image Analysis page is displayed.
21.9.4 Viewing a Diagnostic Snapshot
This page displays the summary of the targets, target types and the diagnostic information collected.
-
From the Targets menu, select Middleware.
-
Select the Manage Diagnostic Snapshots option from the Middleware Features menu.
-
In the Diagnostic Snapshots page, select a snapshot from the list and click View.
-
The summary details for the selected JVM target, target types, and the diagnostic information collected for the JVM is displayed.
21.10 Viewing JVM Diagnostics Threshold Violations
An event is a discrete occurrence detected by Enterprise Manager related to one or more managed entities at a particular point in time which may indicate normal or problematic behavior. Examples of events include: a database target going down, performance threshold violation, change in application configuration files, successful completion of job, or job failure.
JVM Diagnostics threshold violations are now integrated with the Enterprise Manager Event subsystem. When a threshold violation occurs, an Enterprise Manager event is generated. To view the event, follow these steps:
-
From the Enterprise menu, select Monitoring, then select Incident Manager.
-
In the View panel, click Events without Incidents. The JVM Diagnostics events are displayed if there are any outstanding JVMD threshold violations.
-
Click on the link in the Target Name column of a JVM Diagnostics Event.
The JVMD threshold violations will show up in the Incidents table of the JVM or JVM Pool Home page only if the events have been promoted to incidents. For more information on promoting events to incidents, see the Enterprise Manager Cloud Control Administrator's Guide.
21.11 Viewing the Request Instance Diagnostics
The Request Instance Diagnostics page provides a detailed view of the JVMs, Requests, and Request Thread Instances that have participated in the execution of the selected Execution Context ID (ECID). It also provides an overview of system metrics for the JVMs and aggregated metrics for the requests.
To view the Request Instance Diagnostics page, follow these steps:
-
Log into Enterprise Manager Cloud Control.
-
Select Middleware from the Targets menu. On the Middleware page, select Request Instance Diagnostics from the Middleware Features menu.
-
The Request Instance Diagnostics page appears.
-
Click Select ECID to navigate to the ECID page. Enter the following details and click Search.
-
ECID: The Execution Context ID (ECID) is a unique identifier for each root task and is shared across the tree of tasks associated with the root task.
-
User Name: The user who initiated the request.
-
Request Name: The request that is being executed.
-
Start and End Time: The start and end time for the request.
-
Session: The Session ID of the request.
-
Duration: The duration of the request.
Note:
-
If you have upgraded the JVM Diagnostics Engine to 12.1.0.4, the JVM Diagnostics Agent must also be upgraded to ensure that the Start Time and Duration is displayed correctly.
-
If you are using JVM Diagnostics with BTM/ADP integration where the JVM Diagnostics Engine is 12.1.0.4 and the JVM Diagnostics Agent is an earlier version, the Start Time and Duration will be displayed incorrectly. To view the correct date and duration, you must upgrade the JVM Diagnostics Agent to 12.1.0.4.
-
-
-
A list of ECIDs that meet the search criteria is displayed. Select an ECID from the list and click Select. You will return to the Request Instance Diagnostics page.
-
In the Targets section, you can see a list of targets that match the search criteria. You can choose to view the details of each target or an aggregate view of each target type by selecting / unselecting the Group By Target checkbox.
-
If the Group By Target checkbox is unselected, you will see the instance level details for each target. For each JVM instance, you will see the following details:
-
Target: The JVM instance on which the request was executed.
-
RID: The Relationship ID (RID) is an ordered set of numbers that describes the location of each task in the tree of tasks. The leading number is usually a zero. A leading number of 1 indicates that it has not been possible to track the location of the sub-task within the overall sub-task tree.
-
Start Time: The start time for the request.
-
Duration: The duration of the request.
-
Step Name: The individual steps in the request. For example, the first step could be jsp and the second one could be EJB and third could be DB.
-
CPU: The CPU utilization on the JVM instance.
-
Memory: The memory utilized by the JVM instance.
-
GC Major / Minor: The number of objects added to the major and minor garbage collections.
You can do the following:
-
Select a JVM from the list. A bar graph is displayed in the Instance Samples section. This bar graph shows the thread state in each JVM snapshot taken within the duration of the request. Each color represents different thread state like Runnable, Lock, IO wait, DB Wait, NW wait and RMI Wait. You can hover over the graph to get an in-depth view of the thread or click on a sample to analyze the details of the sample in the Sample Analyzer.
-
Click on a JVM target to drill down to the Performance Diagnostics page.
-
Click on the Thread Samples Inspector link to drill down to the Details page which shows the thread data for the selected sample.
-
-
If you select the Group By Target checkbox, an aggregate view of each target type is displayed. The aggregate view helps identify the target causing the delay while executing the selected ECID. For each JVM target, the following details are displayed.
-
Target: The JVM target on which the request was executed.
-
Total Steps: The total number of steps involved in the request.
-
DB Wait Duration: The amount of time spent in the DB Wait status.
-
Network Wait Duration: The amount of time spent in the Network Wait status.
-
Lock Duration: The amount of time spent waiting for lock.
-
RMI Wait Duration: The amount of time spent in the RMI Wait status.
-
Duration in IO: The amount of time spent in IO operations.
-
Duration in CPU: The amount of CPU processing time.
-
Exclusive Duration: The amount of time spent in Runnable, IO and Lock state. Click on the link to see the aggregated stack for all the samples in exclusive state.
-
Total Duration: The total amount of time spent on the request.
-
Select a JVM target. The aggregate JVM Metrics and Application Metrics charts for the target are displayed in the bottom region.
21.12 Using emctl to Manage the JVM Diagnostics Engine
You can use emctl commands to start, stop, and list the JVM Diagnostics Engines. The details and usage patterns of these commands are explained in the table below.
Note:
To run the emctl commands, you must navigate to theORACLE_HOME/bin directory of the OMS.Table 21-1 Extended JVMD emctl Commands
