8 Understanding BI Publisher Report Guidelines
This chapter contains the following topics:
-
Section 8.1, "BI Publisher for JD Edwards EnterpriseOne Overview"
-
Section 8.2, "JD Edwards EnterpriseOne UBE and Report Definition Guidelines"
8.1 BI Publisher for JD Edwards EnterpriseOne Overview
JD Edwards EnterpriseOne has three integrations with Oracle Business Intelligence (BI) Publisher:
-
Embedded BI Publisher for JD Edwards EnterpriseOne: Transforms the output from a UBE into customer facing documents (Pixel Perfect). Common use cases for Embedded BI Publisher with JD Edwards EnterpriseOne are invoices, statements, pick slips, and checks.
See the JD Edwards EnterpriseOne Tools BI Publisher for JD Edwards EnterpriseOne Guide for more information.
-
One View Reporting: Enables end users to create and run their personalized reports directly from JD Edwards EnterpriseOne interactive applications. These reports are typically specific to the user or role and are those that users will run on a daily, weekly, or other periodic basis as part of their normal activities. Users require a high degree of personalization regarding data selection, sequencing, data columns included, and data visualization (charts, tables, graphs) with this type of report. These end user reports improve user productivity by providing users with better visibility into operational data as part of their standard day-to-day business process. One View Reporting enables users to select data fields and perform specific data selection from within JD Edwards EnterpriseOne applications and leverage the layout capabilities within BI Publisher to define the report output formatting. Common use cases might be sales reports, customer reports, supplier reports, and employee reports.
See the JD Edwards EnterpriseOne Applications One View Reporting User Guide for more information.
-
Ad Hoc Reporting: Allows power users and IT staff to build powerful queries to interrogate data on an ad hoc basis. This type of report is typically created to meet a specific business requirement outside of the normal business process, and it is only run once or twice. These reports typically require users to create a SQL statement to retrieve the data (query builder). The query is usually created by the IT department or a power user who understands the JD Edwards EnterpriseOne data schema. After building the query, IT or a power user will create a report layout with tables and charts to display the data (template builder). This integration leverages the JD Edwards EnterpriseOne JDBC Driver and Oracle BI Publisher Enterprise Edition. This integration has commonly been called "interactive reporting." By definition, there are no common use cases.
8.2 JD Edwards EnterpriseOne UBE and Report Definition Guidelines
Each JD Edwards EnterpriseOne Embedded BI Publisher report requires a template, a UBE, and a report definition. The template is used to define the report layout. The UBE is a Report Design Aid (RDA) report template that is used to generate data for the report defintion.The template and UBE are associated with the report definition, which specifies the information that BI Publisher requires to process and deliver BI Publisher output.
See the JD Edwards EnterpriseOne Tools BI Publisher for JD Edwards EnterpriseOne Guide for more information.
8.2.1 UBEs for JD Edwards EnterpriseOne Report Definitions
Use these guidelines when designing a JD Edwards EnterpriseOne report to use as the batch application (UBE) for a JD Edwards EnterpriseOne report definition. Use the JD Edwards EnterpriseOne Report Design Aid to create the UBE.
-
Report Constants
Avoid including any report constants in the UBE layout, unless the constant is used in the BI Publisher report layout.
-
Report Variables
Report variable names act as a root element data tag in the resulting XML file. Make the report variable name as representative as possible. The data dictionary alias, type and length should be included in the report variable name. Report variables must be unique in the report design.
-
Section Names
Section names act as group element data tag in the resulting XML file. Make the section name as representative as possible.
-
Level Breaks
Level breaks represent the grouping in the XML structure. Include as many level breaks as the number of groups you will have in the BI Publisher layout. It is preferable to have level break footer totals processed by the UBE to avoid calculation during BI Publisher processing.
-
Sorting
Sort the data in the UBE design as you want it to appear in the BI Publisher report. Sorting in the BI Publisher template will affect performance and should be avoided.
-
Page Related Data
Headers, Footers, Brought Forward and Carried Forward sections should be avoided. Any data related to a page should not be included in the UBE design. The UBE used in a BI Publisher report definition does not generate pages as the output, it generates an XML file without pages. Any page related information loses context when the XML file is generated.
-
Conditional Sections
Group similar information in conditional sections. For example, Address Book information could be in an AddressBookInformation Section called from the Customer or from the Supplier sections.
-
Data Formatting
Ensure the data is formatted properly in the UBE. BI Publisher does not have access to user preferences, so the date format and the amount decimal separator must be handled by the UBE engine.
8.2.2 Report Definition Guidelines
Use these guidelines when designing a JD Edwards EnterpriseOne report definition.
-
Output Types
All the possible output types should be selected when generating a report definition.
-
Default Output Types
PDF output type should be the default output type.
-
Default Language
User Preference Language should be selected.
8.3 Oracle BI Publisher Layout Editor Guidelines
Use the following guidelines for Oracle's BI Publisher Layout Editor when designing BI Publisher reports for JD Edwards EnterpriseOne.
8.3.1 Report Layout Types
Use these guidelines when designing BI Publisher report layouts.
-
Listing Report
This is the most common type of report. These reports are intended to present information that is useful for performing a specific business function. Developers creating this kind of report should comply with the standards listed in this document.
-
Letter
This format is used to communicate information in a more personal letter format. Standards described in this document shall be used as guidelines for this kind of report
-
Fixed Form Reports
These reports include both pre-printed and application-printed forms, such as pre-printed forms for government and business forms such as1099s,W-2s, and mailing labels. These reports have their own formatting standard as defined by the requirements of the form.
-
Batch Update UBEs
BI Publisher is not intended for simple error reports or UBEs that do not produce any output.
-
Customer Facing Documents
These are documents that are highly customized and might include barcodes, repeating headers, page totals, and so forth. Purchase orders and invoices are examples of this type of report. Standards described in this document should be used as guidelines for this type of report.
8.3.2 Page Attributes
Use these guidelines when designing page attributes.
-
Page Size
Use the standard Letter (8 ½ x 11inches) size for reports. Most reports are destined to be printed. Consequently, using custom paper sizes is not acceptable. For those customers where the standard paper size is A4, the rendering engine will scale the report up to the A4 size.
-
Orientation
Standard report layouts should be defined as landscape or portrait. Landscape should be used as the default for most reports. Considerations for using a portrait layout include the width of data to be printed (for example, table data is 7 inches wide or less), industry standards, or common business practice. For example, customer invoices are customarily portrait orientation, thus the report layout is set up to print using portrait.
-
Page Margins
Margins for the top and bottom of the page shall not exceed 0.5 inches.
The minimum margins are:
Page Margin Minimums Size Top .03 inches Bottom .03 inches Left .03 inches Right .03 inches
For reports that contain data in table format, left and right page margins should be set to match the margins shown when the table is centered. Report header and footer contents should align with the same margins as the displayed table data.
For additional alignment standards, see Multiple Row Tables - Position and Alignment Between Report Data Objects.
8.3.3 Page Header and Footer
Use these guidelines when designing the page header and footer in the Oracle BI Publisher Layout Editor.
8.3.3.1 General Guidelines
The report template should contain a report header and footer unless it is a legal requirement to exclude them, or it is a report type (such as a letter or invoice) that does not require a header.
The use of tables to organize information (including header information) on a report is required. This is necessary because of the way the XML is formatted and for translations. The table borders should be turned off for the table in the header so that they do not appear in the final output document.
Important!:
Do not use Microsoft Word's built in features for page headers and footers, because they cause performance issues with Oracle BI Publisher. Use <?start:body?> <?end body?>. Everything above <?start:body?> is interpreted as page header information by the BI Publisher engine, and everything below <?end body?> is interpreted as footer information.Include a page header on every page of a report and span the entire page width. Include the following information in the page header:
| Feature | Position | Comment |
|---|---|---|
| Report Title | Centered in the page header | |
| Report Version Description or Subtitle | Upper-centered under Report Title | Optional |
| Company Logo | Upper-left page corner | |
| Report Date and Time | Upper-right page corner | Report time is optional |
| Page Number | Upper-right page corner under the Report Date | Use "Page x of x" format |
This is an example of a correctly designed page header:
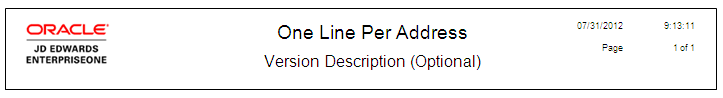
Description of the illustration report_header.png
Include a page footer on every page of a report and span the entire page width. Include the following information in the page footer:
| Feature | Position | Comment |
|---|---|---|
| Report ID/Version ID/Template Name | Lower-left page corner | |
| Confidential Label | Centered in the page footer | Optional |
This is an example of a correctly designed page footer:
Description of the illustration report_footer.png
8.3.3.2 Company Logo
The standard for Oracle JD Edwards EnterpriseOne developers is to hardcode the Oracle JD Edwards EnterpriseOne logo into the template. The logo should be used at its original size.
JD Edwards EnterpriseOne customers may or may not use logos on their custom BI Publisher reports, according to their preferences.
8.3.3.3 Report Title
Include a report title for each page header. Format the title as follows:
Note:
These font, size, color, and format standards apply to the reports that JD Edwards EnterpriseOne ships with its software. Custom reports may use other standards for these attributes.| Format | Value |
|---|---|
| Font | Arial |
| Size | 14 point |
| Color | Black |
| Text format | Bold |
| Position | Centered |
Map the report title to the UBE title <Title> from the XML properties group.
Following is an example of the XML <Title> value (Business Unit Report in this example), which would be used as the BI Publisher report title:
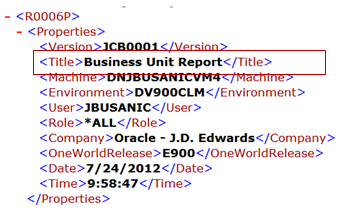
Description of the illustration xml_report_title.png
8.3.3.4 Report Subtitles
Report subtitles should be centered below the report title in another row of the table. The subtitle should be the version description or a user-defined subtitle. Using a version subtitle is optional. Format the subtitle as follows:
Note:
These font, size, color, and format standards apply to the reports that JD Edwards EnterpriseOne ships with its software. Custom reports may use other standards for these attributes.| Format | Value |
|---|---|
| Font | Arial |
| Size | 12 point |
| Color | Black |
| Text format | Bold |
| Position | Centered |
8.3.3.5 Report Date and Time
Place the report date in the top right corner of the report. The report date is the date the report is generated. Format the date as follows:
Note:
These font, size, and color standards apply to the reports that JD Edwards EnterpriseOne ships with its software. Custom reports may use other standards for these attributes.| Format | Value |
|---|---|
| Font | Arial |
| Size | 7 point |
| Color | Black |
Do not format the date value. Map the BI Publisher report date and time to the UBE report date <Date> and time <Time> from the XML properties group:
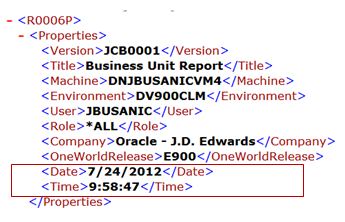
Description of the illustration xml_date_and_time.png
8.3.3.6 Page Numbering
Display the page number in the top right corner of the report under the report date. Format the page numbers as follows:
Note:
These font, size, and color standards apply to the reports that JD Edwards EnterpriseOne ships with its software. Custom reports may use other standards for these attributes.| Format | Value |
|---|---|
| Font | Arial |
| Size | 7 point |
| Color | Black |
Use two cells, one for the word "Page" and the other for the page numbers. Use the following format for page numbers:
Page 1 of 10
For reports with a large amount of data, including the total number of pages can cause performance issues. In this case, simply print the word "Page" in one cell and the page number in a second cell as shown in this example:
Page 1
If you do not include the total number of pages in the page numbering format, display a notice at the end of the report that the last page has been reached.
8.3.3.7 Report Name / Version ID / Template Name
Display the report name, version ID, and template name in the page lower left corner. Use the following format:
Note:
These font, size, and color standards apply to the reports that JD Edwards EnterpriseOne ships with its software. Custom reports may use other standards for these attributes.| Format | Value |
|---|---|
| Font | Arial |
| Size | 7 point |
| Color | Black |
Map the version name to the UBE <Version> value (JCB0001 in the example below) from the XML properties group.
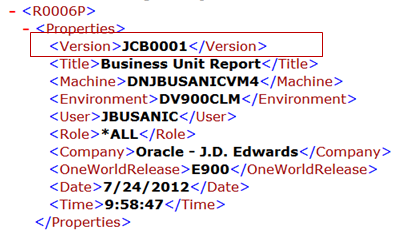
Description of the illustration xml_report_version.png
8.3.3.8 Labeling Confidential Reports
Because they are not translatable, do not use Microsoft Word hard-coded watermark strings to indicate that a report is confidential. To indicate confidentiality, add a subtitle in the page footer. Center the confidential subtitle in the center of the page footer. Format the confidential subtitle as follows:
Note:
These font, size, color, and format standards apply to the reports that JD Edwards EnterpriseOne ships with its software. Custom reports may use other standards for these attributes.Default Formatting for Confidential Subtitle
| Format | Value |
|---|---|
| Font | Arial |
| Size | 7 point |
| Color | Black |
| Text format | Bold |
| Position | Centered in footer |
Maximum Formatting Options for Confidential Subtitle
| Format | Value |
|---|---|
| Font | Arial |
| Size | 9 point |
| Color | Black |
| Text format | Bold |
| Position | Centered in footer |
8.3.3.9 Page Header and Footer Example
Following is an example of a correctly formatted header and footer for a JD Edwards EnterpriseOne BI Publisher report.
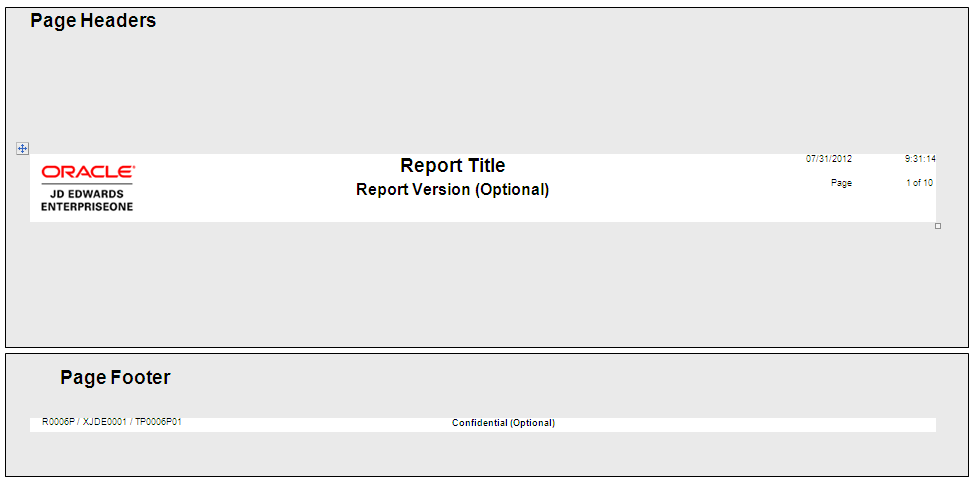
Description of the illustration header_footer_format.png
8.3.4 Report Data
Use the following guidelines for displaying data in a BI Publisher report.
8.3.4.1 Font
In general, for the reports that JD Edwards EnterpriseOne ships with its software, use Arial 7 point font for all text on the report. If the report does not have much information on it, Arial 9 point font is acceptable as the maximum font size. Custom reports may use other fonts.
8.3.4.2 Table Use
Because the RTF template facilitates the use of tables to organize the data in a report, Oracle recommends that you use the RTF format.
Use a Microsoft Word table for single data items, labels, and data tables in a BI Publisher report. The header, tables, footers, and any object must be contained in a Microsoft Word table cell.
8.3.4.3 Single Data Field
Single field values must be displayed with a left-aligned, Arial, 7 point, bold label and left-aligned 7 point values. Do not use a colon after the label. These standards apply to the reports that JD Edwards EnterpriseOne ships with its software.
-
Display single field labels as left-aligned, Arial, 7 point, bold formatting.
-
The field labels should have the first letter of each word in upper case.
-
Do not separate the field label and the field value with a colon.
-
The field values should be left-aligned, Arial, 7 point.
-
Use a 15% border table border for the table.
-
A single data label and single data value should have a 15% grey border for separation.
-
A single data value and single data description should not have any separation.
This is an example of single data field formatting:
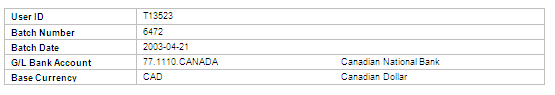
Description of the illustration single_data_field.png
8.3.4.4 Multiple Row Tables
In general, a table with multiple rows should consist of a header that is shaded for clarity and data rows with alternate 15% grey shading, as this example illustrates:
Note:
These color standards apply to the reports that JD Edwards EnterpriseOne ships with its software. Custom reports may use other colors for these rows.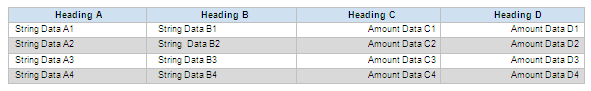
Description of the illustration multiple_row_tables.png
8.3.4.5 Multiple Row Tables - Header Alignment
All table headers should be centered unless the header is used for wide column. In this case, the table header for that column can be left-aligned.
8.3.4.6 Multiple Row Tables - Header Color
For multiple row table headers, set the header background shading to (Red, Green, Blue) (207, 224, 241).
8.3.4.7 Multiple Row Tables - Alternate Row Shading
Data table rows should be alternately shaded with a 15% grey shade, as this example illustrates:
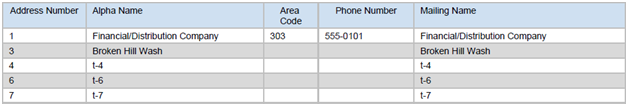
Description of the illustration alt_multiple_row_shading.png
Note:
To achieve alternate grey shading, the next conditional formatting must be included after the for-each sentence:<?if@row: position()mod 2 = 0?> <xsl:attribute name="background-color" xdofo:ctx="incontext">#d9d9d9</xsl:attribute>
<?end if?>
8.3.4.8 Multiple Row Tables - Totals Shading
Reports with multiple child levels should use the following shading for separating totaling levels.
| Level | Background Color(Red, Green, Blue) |
|---|---|
| 1 | (207, 224, 241) |
| 2 | (185, 209, 227) |
| 3 | (165, 195, 219) |
| 4 | (145, 181, 211) |
| 5 | (114, 161, 200) |
These colors were designed to work well on both monitors and the printed page. You should use these shading levels to help distinguish between levels of a report.
In order to use the different styles of shading, each shaded row requires its own table, as shown in this example:
Description of the illustration shading_styles.png
8.3.4.9 Multiple Row Tables - Position
The default position for multiple row tables is the center of the page. If the table is narrow, left alignment is acceptable.
To set the table alignment and preferred width, select Table Properties.
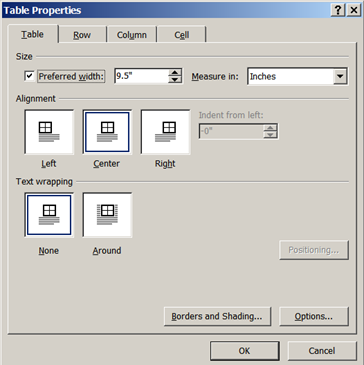
Description of the illustration table_properties.png
Note:
Although it is optional, setting the preferred width will help when aligning the different report objects in the layout. Set the preferred width to display the data properly in the report layout.8.3.4.10 Table Cell Margin
Set table cell margins as shown in the following illustration:
Description of the illustration default_cell_margins.gif
Cell margin values apply to single data tables, multiple row tables, and totals tables.
8.3.4.11 Table Borders
The entire table should have solid, 1/2 point lines, and the table border color should be 25% grey, as shown in the following illustration:
Description of the illustration borders_and_shading.gif
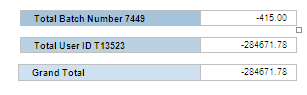
8.3.4.12 Alignment Between Report Data Objects
Use the following guidelines for alignment between report data objects:
-
Single data tables should be left-aligned with the associated multiple row tables.
-
Totals should be right-aligned with the multiple row tables.
This example shows a left-aligned single data table, with right-aligned total row tables:
Description of the illustration table_positioning2.png
You may display data in more than one table on a report. For reports with more than one table, set the margins so that the widest table is centered on the page. By doing so, the margins will be set according to the widest table, and the remaining tables will then be aligned to the left side of the widest table.
An exception to multiple table alignment is when tables and their related graphs display on the same page. For reports containing graphs and their related tables, center each table with its graph. For any other tables on a report containing graphs, the widest table standard applies. Use page breaks to separate tables that are related to graphs and non-related tables.
8.3.4.13 Paragraph Setting
Use table cells and margins to lay out the data in the report. Do not use special paragraph settings when creating the report template. Use the paragraph settings shown in the following illustration: 
Description of the illustration para_settings_rtf_tmplt.gif
8.3.4.14 Tab Use
Do not use tab characters in the report. Tab characters might cause problems when the template is translated. In place of tabs, use tables without borders to organize objects in the report layout.
8.3.4.15 End of a Report Indication
If you do not show the total number of pages in the page header, print the phrase "End of Report" centered on the last page. Center the phrase on the last page that contains a report body and place it inside a single-celled table after the end of the template content.
Format the "End of Report" phrase as follows:
| Format | Value |
|---|---|
| Font | Arial |
| Size | 7 point |
| Color | Black |
| Text format | Bold |
| Position | Centered on last page that contains a report body |
8.3.4.16 No Data Indication
To indicate that no data was found, print the title, page headings and column headings followed by the centered phrase "No Data Selected." Place the phrase inside a single-celled table after the end of the template content. Use an If condition for the data generated by the JD Edwards EnterpriseOne UBE XML to determine whether the phrase should appear on the report.
Format the "No Data Selected" phrase as follows:
| Format | Value |
|---|---|
| Font | Arial |
| Size | 7 point |
| Color | Black |
| Text format | Bold |
| Position | Centered after the end of the template content |
Note:
The following condition must be included before the "No Data Selected" message:<?if:ErrorMessage_ID0='No Data Selected'?> No data Selected <?end if?>
8.3.4.17 Page Break
To avoid an extra blank page at the end of the report, do not use the native Microsoft Word page break.
Use <?split-by-page-break:?> syntax immediately before the <?end for-each?> instead.
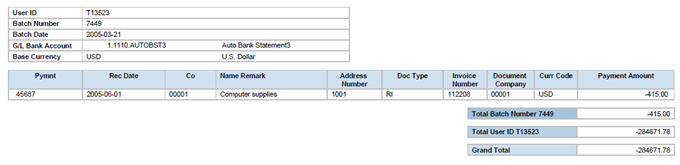
8.3.4.18 BI Publisher Report Example
The following example shows a BI Publisher report with these options correctly formatted:
-
Single Data Labels
Align right; in their own cell; Arial, 7 point, black, bold font.
-
Single Data Values
Align left; in their own cell; Arial, 7 point, black font.
-
Column Headers
Centered; in their own cell; Arial, 7 point, black, bold, font.
-
Column Data
Align left or right, depending on data; in their own cell; Arial, 7 point, black font.
-
Multiple Data Row Shading
Alternate 15% grey shading.
-
Report Total Labels
Match background color to the level they represent; Arial, 7 point, black, bold font.
-
Report Totals
Embed column value within label text.
-
Report Total Data
Align right; in their own cell; Arial, 7 point, black, bold font.
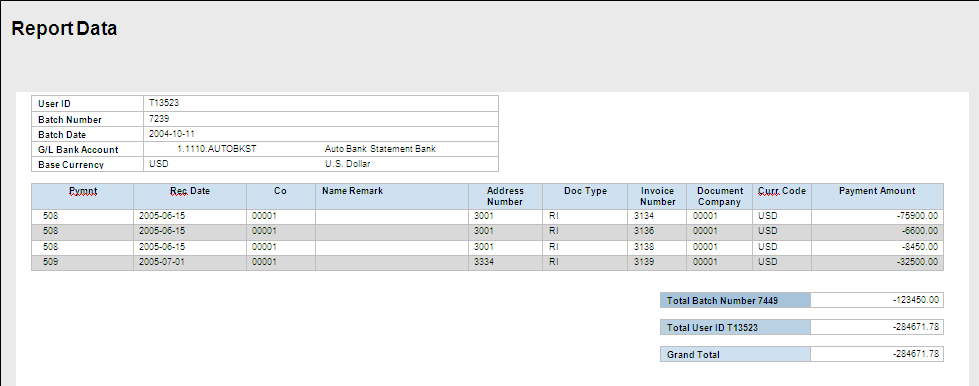
Description of the illustration rpt_data_layout.png
8.4 Translation Guidelines
Language translation of reports can be a particularly time-consuming and expensive endeavor. To facilitate report translation, follow these guidelines for spacing and anchoring all boilerplate text. Oracle recommends that you allow 30% for text expansion.
-
Do not format the document by using characters. For example the following string is not acceptable:
Description of the illustration translation_example1.png
Instead, it is recommended that you use a 2-celled table and bold the text, as shown in this example:

Description of the illustration translation_example2.png
-
Do not use consecutive symbols in a translatable string, for example, By: ________. If you need to create this type of text along with consecutive underscores to indicate a line, use a 2-celled, borderless table with the text in the left column (such as the word "By" in the previous example). Then use the lower border of the second cell to achieve the line.
-
Do not use words connected with underscores, for example, ACCOUNTING_SEQUENCE_NAME. This type of string will not be translated.
-
Do not concatenate a variable string with a static string at runtime to create a string. There are several translatability issues with this approach. The translator will not be able to determine the variable string value.
-
Do not use incorrect spelling in templates. Use a spell checker to ensure that the words are spelled correctly.
8.5 XPath Usage
Oracle BI Publisher uses XPath to access data elements. The following example shows a typical hierarchy tree of data elements:
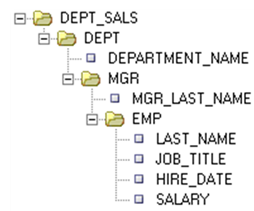
Description of the illustration xpath_usage.png
The XPath search procedure for DEPARTMENT_NAME in the example above is as follows:
-
DEPARTMENT_NAME is inserted as
<?DEPARTMENT_NAME?> -
<?DEPARTMENT_NAME?>is translated to the XPath.//DEPARTMENT_NAME -
.//DEPARTMENT_NAMEsearches for DEPARTMENT_NAME in the complete sub-tree, starting from the current context. That is, it searches for any element with the name field in the correct context. With large data sets, this search procedure can affect system performance.
For small documents, search time is negligible, but with large data sets use the full relative path to improve performance. For example, in the hierarchy tree above:
-
Instead of
<?for-each:DEPT?>use<?for-each:/DEPT_SALS/DEPT?> -
Instead of
<?DEPARTMENT_NAME?>use<?./DEPARTMENT_NAME?>
Additionally, large documents might not fit into memory, thereby requiring disk access for searches. By using the full relative path, full tree searches are avoided, resulting in large performance improvements.