29 View Runtime Metrics for a Managed Instance
The runtime metrics provide operational information about insight to the EnterpriseOne servers. Runtime metrics are only available when the server is running.
This chapter discusses:
-
Section 29.2, "EnterpriseOne Web-based Servers Runtime Metrics"
-
Section 29.3, "Application Interface Services Server Runtime Metrics (Release 9.1 Update 5)"
29.1 Enterprise Server Runtime Metrics
A Runtime Metrics information summary and links to detailed information are available for each Enterprise Server that is running. Metrics are provided by an embedded variant of the management agent built into each EnterpriseOne server. A new kernel definition, the management kernel, was added in 8.97. A single management kernel process is created when the enterprise server is started. The management kernel is responsible for securely networking between the enterprise server and the server manager management console while providing the runtime details of the enterprise server.
The following runtime metrics are available for a running enterprise server:
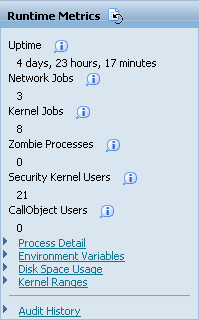
29.1.1 General
Runtime Metrics will display runtime information for these parameters:
-
Uptime
The amount of time the Enterprise Server has been running.
-
Network Jobs
The number of network listener processes (jdenet_n) that are currently running.
-
Kernel Jobs
The total number of kernel processes (jdenet_k) that are currently running.
-
Zombie Processes
Zombie status refers to an Enterprise Server process that has unexpectedly terminated without properly cleaning ups its resources. This value will display the total number of zombie processes that are tracked in the enterprise server shared memory segment.
-
Security Kernel Users
The number of EnterpriseOne users that have a currently active security server connection to the Enterprise Server.
-
Call Object Users
The number of EnterpriseOne users that have a currently active CallObject (business function) connection to the Enterprise Server.
29.1.2 Process Detail
Information about all of the running network, kernel, and other enterprise server processes can be viewed by selecting the Process Detail hyperlink from the Runtime Metrics pane. The management kernel process will periodically query the enterprise server to retrieve the runtime information. This polling will occur approximately every thirty seconds; therefore it is possible that the information displayed through the server manager process detail pages may be up to 30 seconds old.
The process detail page includes:
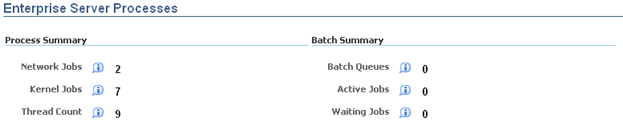
The top of the page includes a Process Summary section providing a quick reference to the number of active enterprise server processes and provides a Batch Summary that displays the running batch queues, active batch jobs, and pending batch jobs.
29.1.2.1 A Process Summary
The status information fields for Process Summary are:
-
Network Jobs
The total number of network listener jobs active on the Enterprise Server.
-
Kernel Jobs
The total number of kernel jobs active on the Enterprise Server.
-
Thread Count
The total number of threads active on the Enterprise Server.
29.1.2.2 A Batch Summary
The status information fields for Batch Summary are:
-
Batch Queues
The number of batch queues that are managed by the queue kernel process on the Enterprise Server.
-
Active Jobs
The number of jobs that are currently being processed (running) in the batch queues.
-
Waiting Jobs
The number of jobs that are currently in the queue awaiting processing.
29.1.2.3 A Process Table
The process table contains a row for each EnterpriseOne server process contained within the shared memory segment. The shared memory segment is created by the first server process created during server startup. Each additional server process will register itself within that shared memory segment. Server Manager uses this shared memory to identify and display all the running server processes.
The process table lists each of the processes found. Each process is displayed along with some key columns. The table also provides links to directly view the associated JDE and JDEDEBUG log files.
Selecting the process name will display more detailed information.
This section describes:
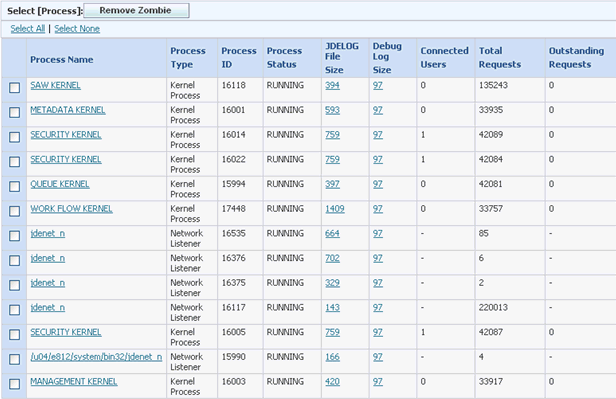
29.1.2.3.1 Remove Zombie
A zombie process is an enterprise server process registers itself within the shared memory segment then terminates without removing its registration information shared memory. The most likely cause of a zombie process is a process that performs an illegal operation and is terminated by the host operating system.
Zombie process may have their information removed from the shared memory segment. Removing the zombie process will prevent it from showing up in the process table. To remove a zombie process select the check box next to a process in the zombie state and click the Remove Zombie button. Selecting and attempting to remove a process that is not in the zombie state will have no effect.
29.1.2.3.2 Process Detail
Selecting the process name in the process table section will display additional information about that process.
The additional detail includes:

When an individual process is selected for viewing, a process detail screen will be displayed with the Process ID number in the heading of the page. The General Information section is always displayed followed by additional relevant sections. Hyperlinks will appear below the Process ID that will link to the additional sections.
29.1.2.3.3 General Information
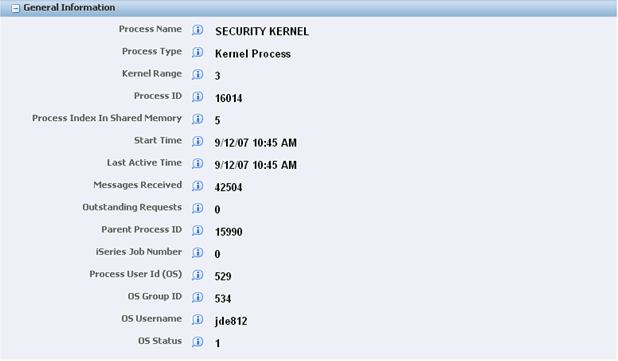
The General Information section will provide information for these parameters:
-
Process Name
The name of the kernel process. The name indicates which kernel definition the kernel belongs to.
-
Process Type
The description of the Enterprise Server process type.
-
Kernel Range
The kernel definition index. The Enterprise Server is composed of kernels that process messages from other servers and clients. There are more than thirty different types of kernels. The range index indicates which kernel group this kernel belongs to.
-
Process ID
The operating system assigned process identifier for the kernel process.
-
Process Index In Shared Memory
An internal identifier used to locate the process position in the shared memory resources that track kernel and network processes.
-
Start Time
The time the process was created.
-
Last Active Time
The last time the kernel performed any activity such as processing incoming JDENET messages.
-
Messages Received
The total number of messages (requests) that have been processed by the kernel process.
-
Outstanding Requests
The number or requests that are queued and awaiting processing by the kernel process.
-
Parent Process ID
The operating system assigned process identifier of the parent process.
-
IBM i Job Number
The job number of the process, valid on the IBM i platform only.
-
Process User ID (OS)
The operating system user id under which the process is running.
-
OS Group ID
The group identifier of the os user running the process; valid only on unix based platforms.
-
OS Username
The operating system user name under which the process is running.
-
OS Status
The status of the process as reported by the operating system:
0 = Sleeping
1 = Running
2 = Stopped
3 = Zombie
4 = Other
29.1.2.3.4 Connected Users
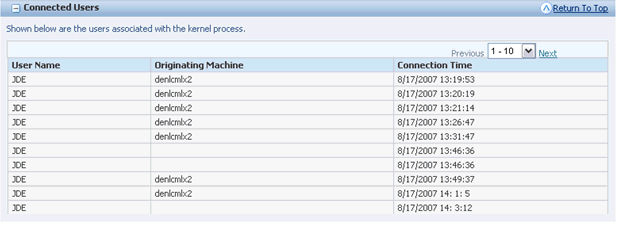
Security and CallObject kernel processes have active users associated with the process. The page will display a section containing the names, originating machine, and connection time of each remote user that is active on the kernel process.
29.1.2.3.5 Log File Configuration
Logging may be dynamically enabled or disabled for an individual process.
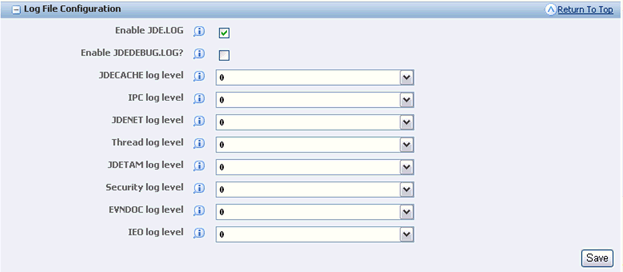
The Log File Configuration section will contain up to three segments. The first segment allows for configuration enablement of the JDE.LOG and the JDEDEBUG.LOG, and for setting the log levels for different log files.
The parameters available to change log files are:
-
Enable JDE.LOG
This setting controls whether error and other significant messages are written to the jde.log. It is highly recommended this logging type always be enabled.
-
Enable JDEDEBUG.LOG
This setting controls whether debug and trace messages are written to the jdedebug.log. These messages are very useful when troubleshooting an Enterprise Server; however, enabling debug logging will impact performance.
-
JDECACHE log level
Configures the level of logging generated by the cache manager. This setting will have no effect if JDEDEBUG logging is disabled.
-
IPC log level
Configures the level of logging generated by the interprocess communication (IPC) related functionality. This setting will have no effect if JDEDEBUG logging is disabled.
-
JDENET log level
Configures the level of logging generated by the JDENET network related functionality. This setting will have no effect if JDEDEBUG logging is disabled.
-
Thread log level
Configures the level of logging generated by the thread handling functionality. This setting will have no effect if JDEDEBUG logging is disabled.
-
JDETAM log level
Configures the level of logging generated by the TAM specification access routines. This setting will have no effect if JDEDEBUG logging is disabled.
-
Security log level
Configures the level of logging generated by the security related functionality. This setting will have no effect if JDEDEBUG logging is disabled.
-
ENVDOC log level
Configures the level of logging generated by the EVNDOC (Interop) functionality. This setting will have no effect if JDEDEBUG logging is disabled.
-
IEO log level
Configures the level of logging generated by the IEO (Interop) functionality. This setting will have no effect if JDEDEBUG logging is disabled.
Click the Save button to save any changes made to the parameters.
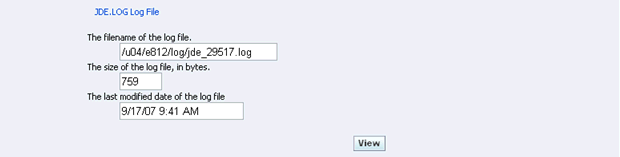
The second segment will display the filename, size, and last modified date of the JDE.LOG file. Select the View button to retrieve and view the log file contents using the integrated log file viewer.
See Log File Viewer
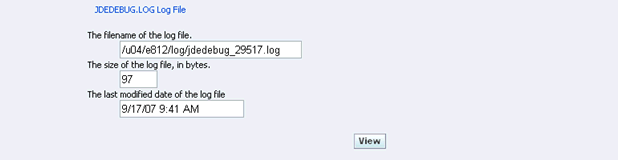
The third segment will display the filename, size, and last modified date of the JDEDEBUG.LOG file. Select the View button to retrieve and view the log file contents using the integrated log file viewer.
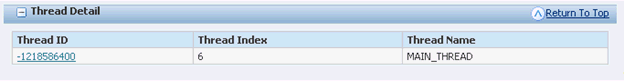
29.1.2.3.6 Thread Detail
The active threads for the Enterprise Server process are displayed in the Thread Detail section. Each thread is displayed along with its thread identifier, index in shared memory, and thread name. If thread metrics are enabled selecting a thread identifier will display additional thread related metrics.
If Thread metrics has been enabled, then when the hyperlink for a Thread ID is clicked, then a Thread metrics screen will appear with additional information for the Thread ID. If Thread metrics has not been enabled, then this screen will appear:
29.1.3 Environment Variables
The Environment Variables hyperlink, when selected, will display the environment variables that are active on the selected Enterprise Server. The displayed environment variables are those that were used to create the server process. Changes made after the kernel process was started will not be reflected.

29.1.4 Disk Space Usage
The Disk Space Usage hyperlink, when selected, displays this information on the disks that make up the Enterprise Server that you are monitoring.
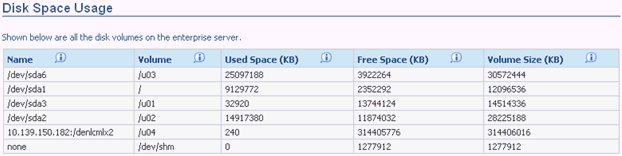
The information available on the Disk Space Usage screen is:
-
Name
The name of the physical disk.
-
Volume
The volume, or mount point, of the disk.
-
Used Space (KB)
The amount of space that is currently in use on the disk, in kilobytes.
-
Free Space (KB)
The amount of space that is available on the disk, in kilobytes.
-
Volume Size (KB)
The total amount of space available on the disk, in kilobytes.
29.1.5 Kernel Ranges
Selecting the Kernel Ranges hyperlink will link to the Kernel Ranges screen. This screen has two sections:
29.1.5.1 Network Listener Jobs (JDENET_N)
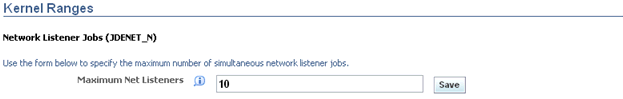
The first section of this screen is for Network Listener Jobs (JDENET_N). The maximum number of simultaneous network listener jobs can be designated by entering a number into the Maximum Net Listeners field.
-
Maximum Net Listeners
The maximum number of network listener jobs (jdenet_n) that may be active at any given time.
29.1.5.2 Kernel Process Jobs (JDENET_K)
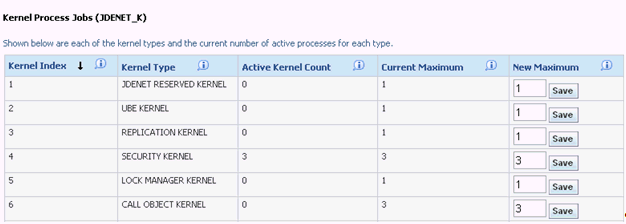
This section will list each of the kernel types and the current number of processes for each type. The information in this section includes:
-
Kernel Index
The kernel definition index. Each kernel type has a distinct value, which corresponds to the JDENET_KERNEL_DEF## section in the JDE.INI where ## represents the kernel index value.
-
Kernel Type
A textual description to the kernel process type.
-
Active Kernel Count
The number of kernel processes of the specified type that is running.
-
Current Maximum
The current maximum number of processes of the specified type that may simultaneously exist. This value is an in-memory value only; if the Enterprise Server is restarted the maximum processes will be reloaded from the INI configuration file.
-
New Maximum
You may specify a new maximum number of simultaneous processes for a particular kernel. The value must be equal to or greater than the current number of processes of the specified kernel type.
If the New Maximum has been changed, click the Save button next to the changed number to save the change.
29.1.6 Audit History
You may view the configuration changes that have occurred over time by selecting the audit history link. Each configuration item that has changed will be listed in chronological order. You may also use the filter criteria to narrow down the results returned. Audit history will also contain a record for each start and stop of the server that was performed using server manager. This screen has three sections:
29.1.6.1 Report Configuration
The Report Configuration section will display all of the timestamps in which audit events have been recorded.
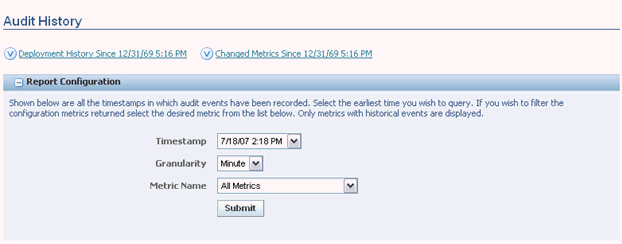
The fields and values that are reported are:
-
Timestamp
This field will have values that can be selected from a dropdown box in the format of date, then time.
-
Granularity
-
This field allow you to choose:
Minute
Hour
Day
-
Metric Name
This field permits narrowing down the returned results to specific configuration topics.
After selecting the values for these parameters, click the Submit button to process your selection.
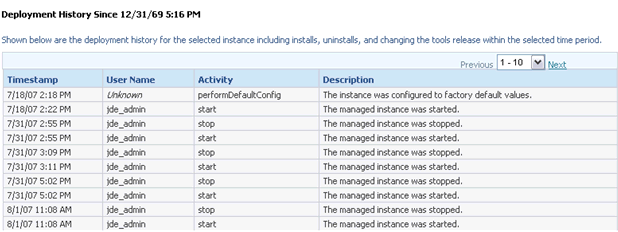
29.1.6.2 Deployment History
Deployment History will provide information for the selected instance including installs, uninstalls, and changes to the tools release within the selected time period.
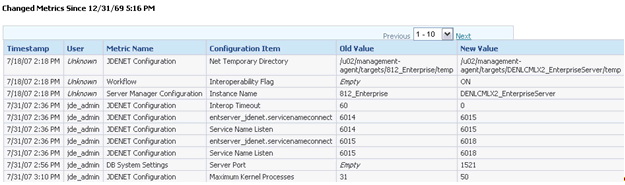
29.1.6.3 Changed Metrics
Changed Metrics will display all the configuration metric changes within the selected time period.
29.2 EnterpriseOne Web-based Servers Runtime Metrics
Runtime Metrics for EnterpriseOne web products provides metric information for:
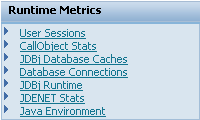
29.2.1 User Sessions (HTML Server Only)
Active user sessions may be viewed for a single HTML server instance or across all instances you are authorized to view.
This section describes:
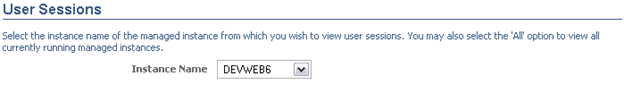
In the Instance Name field, select the instance name of the managed instance from which you wish to view user sessions, or select ALL to view all instances.
-
Instance Name
The name of the instance. The selections available are:
ALL
individual instance name
home
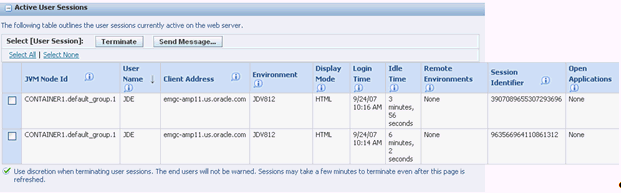
Active User Sessions information includes:
-
JVM Node Id
An identifier that uniquely identifies a singe JVM.
-
User Name
The user name that created the HTML server session.
-
Client Address
The name of the remote machine used to create the user session. This may be returned as the machine name or IP address. If proxy servers are used the machine name may be that of the proxy server and not the actual remote client.
-
Environment
The name of the user's sign in environment.
-
Display Mode
This value indicates the type of user session: 'HTML' for HTML server session, 'Data Browser', or 'Portal'.
-
Login Time
The time the user session was created.
-
Idle Time
The amount of time, in seconds, that the user has been idle.
-
Remote Environments
Each remote environment represents a call object kernel session that has been created for the user. The format is host:port PID:pid, where host indicates the name of the enterprise server, port indicates the JDENET port of the enterprise server, and pid indicates the process id of the corresponding call object kernel process.
-
Session Identifier
A unique identifier for each user session.
-
Open Applications
Each application stack currently active for the user session will be listed.
29.2.1.1 Terminate
The Terminate button is available to terminate user sessions. You may terminate a user session along with any applications that are running. Use caution because the user will not be informed of this action and any work in progress may be lost. Select a check box for the user session that needs termination, and then click the Terminate button. A management console user must posses the userSession permission granted for the managed instance on which the user is active in order to terminate the session.
29.2.1.2 Send Message
The Send Message button is available to send messages to the applications active within a user session. You may select users and send a message. Messages will be received only by users who have an application running, and only when they perform an activity within the application such as pressing Find on the toolbar.
29.2.2 CallObject Stats
The CallObject statistics detail the business functions that have been invoked by a web product. Each business function that is called is recorded and displayed along with timing, invocation counts, and error counts.
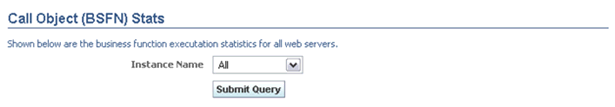
Business function invocations and related statistics may be viewed for a single instance or multiple instances In the Instance Name field, select the instance name of the managed instance from which you wish to view user sessions, or select ALL to view all instances you are authorized to view. After making the selection, click the Submit Query button to refresh the results.
-
Instance Name
The name of the instance. The selections available are:
ALL
individual instance name
home
29.2.2.1 CallObject Table
Statistics may be dynamically cleared for individual or all business function invoked.
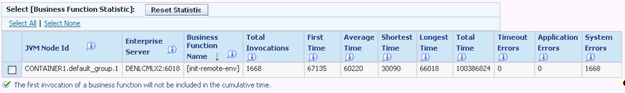
The Call Object (BSFN) Stats window displays cumulative data about each type of business function that has run during a server session. This table summarizes the information displayed for each business function:
-
JVM Node Id
An identifier that uniquely identifies an individual JVM. This column will appear only if an instance was detected with multiple JVMs.
-
Enterprise Server
The Enterprise Server name and port of the Enterprise Server to which the statistic applies.
-
Business Function Name
The name of the business function.
-
Total Invocations
The total number of invocations of the business function.
-
First Time
The amount of time, in milliseconds, that a first invocation of the business function took. The first invocation is not counted towards the average due to its initial overhead.
-
Average Time
The average time, in milliseconds, that a first invocation of the business function took. The first invocation is not counted towards the average due to its initial overhead.
-
Shortest Time
The shortest amount of time, in milliseconds, that an invocation of this business function took.
-
Longest Time
The longest amount of time, in milliseconds, that an invocation of this business function took.
-
Total Time
The longest amount of time, in milliseconds, that an invocation of this business function took.
-
Timeout Errors
The number of invocations of this business function that resulted in a JDENET timeout rather than a successful completion.
-
Application Errors
The number of invocations of this business function that resulted in an application returned error rather than a successful completion.
-
System Errors
The number of invocations of this business function that resulted in a system error rather than a successful completion.
The CallObject Information view also displays the number of business function processes in progress. This number can be important for troubleshooting purposes. A large number of in-progress processes may indicate that the Enterprise Server is running slowly and alert you that you need to investigate the possible causes.
29.2.3 JDBj Database Caches
JDBj Database Caches cache management enables one to select the Instance that they want to look at, and within the Instance the Cache name that they want to track. Based on this selection the appropriate JDBj Service Cache metrics are displayed. Caches maintained by the HTML server may be viewed and cleared across a single or multiple instances.
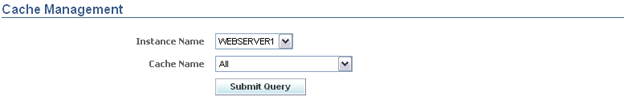
In the Instance Name field, select the instance name of the managed instance from which you wish to view user sessions, or select ALL to view all instances. After making the selection, click the Submit Query button.
The fields in the Cache Management section are:
-
Instance Name
All can be selected which will display every instance selected, or an individual instance can be selected. The selections available are:
All
individual instance name
home
-
Cache Name
All can be selected which will display every cache within the instance selected, or an individual cache can be selected.
Values available are:
Data Dictionary Glossary Text
Data Dictionary Alpha Cache
Row Column Cache
JDBJ Security Cache
JDBJ Service Cache
Serialized Objects
Menu Cache
Select a value from the Instance Name and Cache Name field. When both fields have been selected, then click on the Submit Query button.
29.2.3.1 JDBj Service Caches
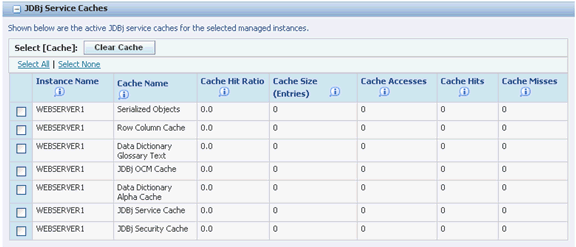
JDBj Services Caches are displayed for the selected managed instances.
-
Instance Name
This will display based on the Instance Name selected in the previous Instance Name drop down selection. The unique name assigned to the managed instance at the time it was created or registered.
-
Cache Name
This will display based on the Instance Name selected in the previous Instance Name drop down selection. The name of the JDBj service cache.
-
Cache Hit Ratio
The ratio of cache requests that find an object in cache, as a faction of 1.
-
Cache Size (Entries)
The number of items that are stored with the cache.
-
Cache Accesses
The total number of requests the cache has serviced.
-
Cache Hits
The total number of requests the cache has serviced and returning a matched result.
-
Cache Misses
The total number of requests the cache has serviced and did not find within its cache.
29.2.4 Database Connections
Database connections and prepared statement caches can be viewed across a single instance or multiple instances simultaneously. The Database Connections hyperlink will link to the JDBj Connection Caches screen.
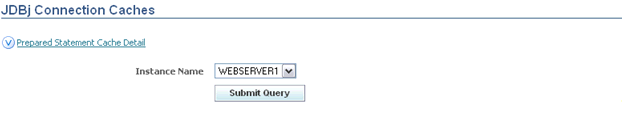
The Instance Name field allows for all instances to be selected which will display every instance, or an individual instance can be selected. Once the Instance Name has been selected, click the Submit Query button.
-
Instance Name
All can be selected which will display every instance selected, or an individual instance can be selected. The selections available are:
All
individual instance name
home
29.2.4.1 JDBj Pooled Database Connections
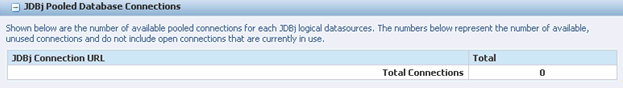
JDBj Pooled Database Connections shows the number of available pooled connections for each JDBj logical data source. The numbers below represent the number of available, unused connections and do not include open connections that are currently in use.
29.2.4.2 Prepared Statement Cache Detail
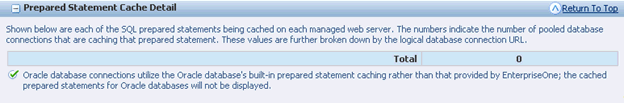
The Prepared Statement Cache Detail shows each of the SQL prepared statements being cached on each managed web server. The numbers indicate the number of pooled database connections that are caching that prepared statement. These values are further broken down by the logical database connection URL.
Note:
Prepared statement caches are not maintained for the Oracle products; Oracle products use the Oracle native prepared statement caching instead.29.2.5 JDBj Runtime
The JDBj Runtime screen allows for viewing or modifying the runtime configuration of JDBj, which can be done across a single instance or multiple instances simultaneously.
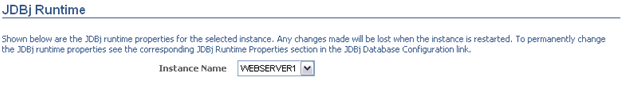
In the Instance Name field, select the instance name of the managed instance from which you wish to view user sessions, or select ALL to view all instances. After making the selection, click the Submit Query button.
-
Instance Name
All can be selected which will display every instance selected, or an individual instance can be selected. The selections available are:
All
individual instance name
home
29.2.5.1 Properties
The Properties section allows the Value of the property to by dynamically changed.
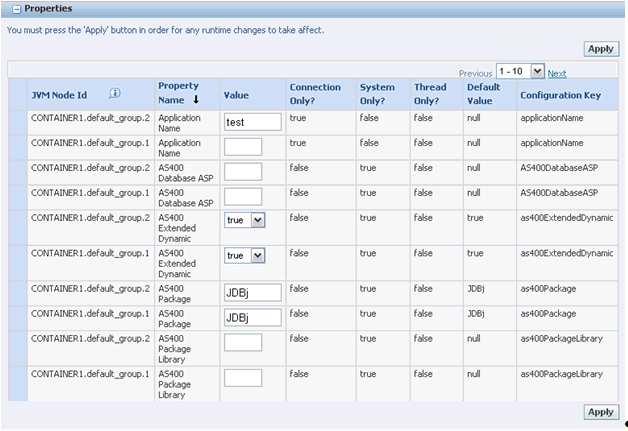
The Properties section allows the value of the property to by dynamically changed.
-
Value
The current value in use for the property. This value may be defined in a drop down menu or may be a text field that allows free-form entry of the value.
29.2.6 JDENET Stats
The JDENET Stats hyperlink connects to the JDENET Connections screen, which has these sections:
29.2.6.1 JDENET Connections
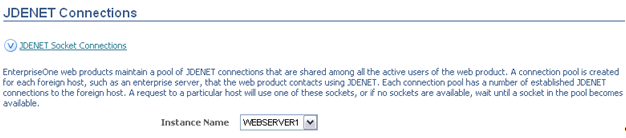
EnterpriseOne web products maintain a pool of JDENET connections that are shared among all the active users of the web product. A connection pool is created for each foreign host, such as an Enterprise Server, that the web product contacts using JDENET. Each connection pool has a number of established JDENET connections to the foreign host. A request to a particular host will use one of these sockets, or if no sockets are available, wait until a socket in the pool becomes available.
Viewing the JDENET statistics for connections established by the HTML server can be viewed across a single instance or multiple instances simultaneously.
The Instance Name field allows for all instances to be selected which will display every instance, or an individual instance can be selected. Once the Instance Name has been selected, the screen will refresh with the updated information. In the Instance Name field, select the instance name of the managed instance from which you wish to view user sessions, or select ALL to view all instances.
-
Instance Name
All can be selected which will display every instance selected, or an individual instance can be selected. The selections available are:
All
individual instance name
home
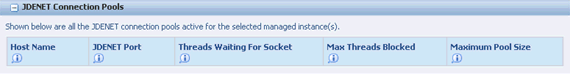
29.2.6.2 JDENET Connection Pools
The JDENET Connection Pool Information view displays connection and messaging data for each Enterprise Server connected to the web server. Information about the volume of data and messages transmitted and received is contained in this set of parameters:
-
Host Name
The name of the Enterprise Server the connection pool represents.
-
JDENET Port
The JDENET port used to initially contact the Enterprise Server.
-
Threads Waiting for Socket
The number of threads that are currently waiting to use a socket connection contained within this thread pool. If this number is non-zero then one or more threads are being held up. In this case it may be beneficial to increase the maximum pool size.
-
Max Threads Blocked
The maximum number of threads that have been simultaneously been waiting for a socket from the connection pool.
-
Maximum Pool Size
The maximum number of sockets that may be created for this connection pool. Once this threshold is retrieved any additional threads attempting to connect to the Enterprise Server/port will wait until a in use socket is returned to the pool.
29.2.6.3 JDENET Socket Connections
JDENET Socket Connections displays all of the available socket connections in the connection pools for the selected managed instance(s). Sockets currently in use (check-out) are not displayed.
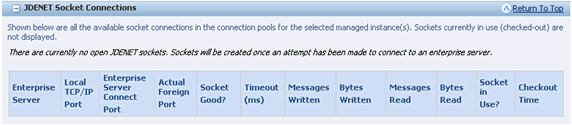
The grid fields for JDENET Socket Connections are:
-
Enterprise Server
The name of the Enterprise Server the connection pool represents.
-
Local TCP/IP Port
The TCP/IP port actually used by the connection.
-
Enterprise Server Connect Port
The initial port (connect port) used to contact the Enterprise Server.
-
Actual Foreign Port
The actual port on the Enterprise Server used.
-
Socket Good?
If true the socket is valid and usable.
-
Timeout (ms)
Timeout in milliseconds.
-
Messages Written
The number of JDENET messages that have been written on the socket connection.
-
Bytes Written
The number of bytes that have been written on the socket connection.
-
Socket in Use?
If true the socket is in use by a thread
-
Checkout Time
The time the socket was checked out by the thread using it.
29.2.7 Java Environment
The java environment runtime metrics provide insight into the JVM(s) running the EnterpriseOne Web products. This information may be helpful in understanding or troubleshooting the java environment in which these products operate. The Java Environment hyperlink, when selected, will link to the Java Environment Runtime Detail screen.
29.2.7.1 Java Environment Runtime Detail
Viewing Java JVM runtime information such as memory used, threads created, and system properties can be viewed across a single instance or multiple instances simultaneously. Garbage collection on the JVM may also be invoked.
The Java Environment Runtime Detail information includes:
29.2.7.1.1 General Java Information
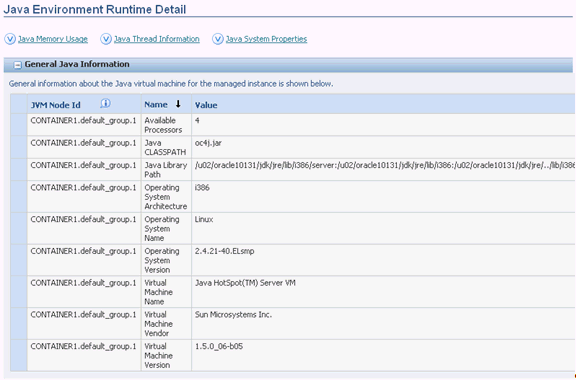
General information about the Java virtual machine for the managed instance is displayed in the General Java Information section:
-
JVM Node Id
An identifier that uniquely identifies a single JVM.
-
Name
A description of the java system property.
-
Value
The value of the system property.
29.2.7.2 Java Memory Usage
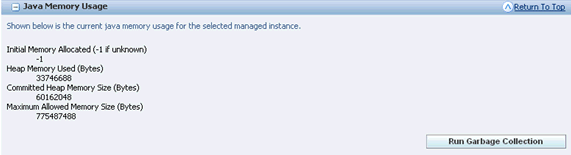
Information about the current memory usage is available. The information is current at the time the page is initially loaded.
29.2.7.3 Run Garbage Collection
Each container will have a Run Garbage Collection button that initiates the garbage collection process for each container providing more current usage information.
29.2.7.4 Java Thread Information

Each of the threads contained within the JVM are displayed.
-
Thread Name
The name of the java thread.
-
Thread Group
The group in which the thread belongs.
-
Is Alive?
True if the current thread.
-
Is Daemon Thread
True if the thread is a daemon, or background thread.
-
Thread Priority
The priority assigned to the thread.
29.2.7.5 Java System Properties
The Java System Properties displays all of the java system properties. This list is current at the time the page is loaded.
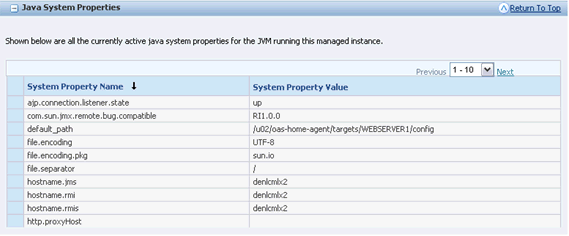
The Java System Properties displayed are:
-
System Property Name
The name of the system property.
-
System Property Value
The value of the system property.
29.3 Application Interface Services Server Runtime Metrics (Release 9.1 Update 5)
Runtime metrics for Application Interface Services Servers provide metric information for:
29.3.1 AIS Information
The AIS Information section provides metrics for:
-
AIS JVM Count
-
AIS Uptime
-
Online Users
See the context sensitive help for more information on each metric.
29.3.2 Login Metrics
Displays the login request and response metrics for the AIS Server.
29.3.3 User Info Metrics
Displays user information contained in the F0092 table.
29.3.4 Runtime Configuration
Displays the runtime configuration settings being used by the AIS Server.
29.3.5 Form Metrics
Displays the form related metrics specific to user activity with a particular application and form.
29.3.6 Session Metrics
Displays the user session SSO metrics.
29.3.7 Java Environment
29.4 Transaction Server Administration
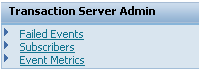
The Transaction Server Admin section has hyperlinks for:
29.4.1 Failed Events
The Failed Events section contains:
29.4.1.1 Select [Failed Events]
Failed Events and their associated failure messages are listed for the transaction server.
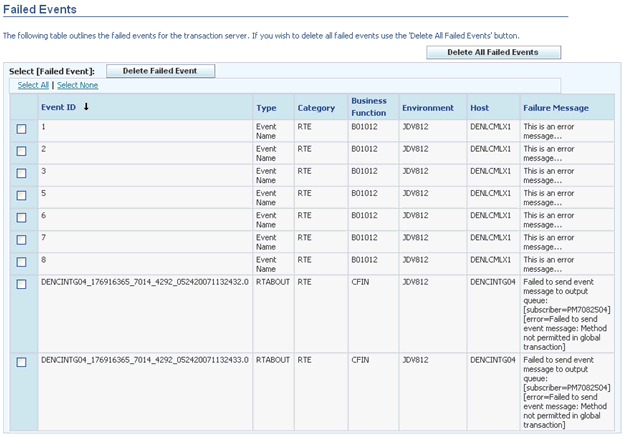
29.4.1.2 Delete Failed Events
The Delete Failed Event button will delete selected events.
29.4.1.3 Delete All Failed Event
The Delete All Failed Events button will delete all failed events.
29.4.2 Subscribers
The Subscribers section contains:
29.4.2.1 Select [Subscriber]
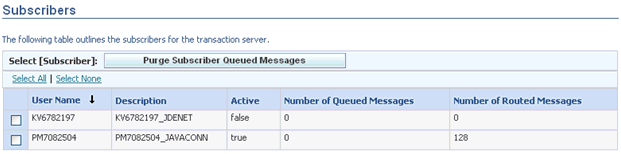
The subscribers section outlines the subscribers for the transaction server.
29.4.2.2 Purge Subscriber Queued Messages
The Purge Subscriber Queued Messages button, when selected, will purge all subscriber queued messages.
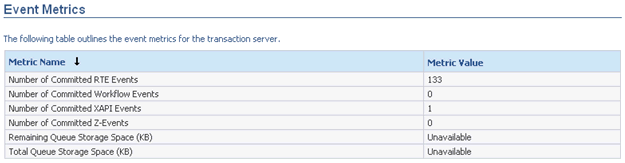
29.4.3 Event Metrics
The Event Metrics section outlines the event metrics for the transaction server. Information is provided for the Metric Name and the Metric Value grid fields.