 Performance Monitor
This chapter discusses:
Performance Monitor.
Performance Monitor architecture.
Implementation options.
Performance Monitor instrumentation.
Performance Monitor integration with third party systems.
Performance Monitor data.
Scope of the Performance Monitor.
Performance MonitorPerformance Monitor helps system administrators monitor PeopleSoft performance data and, if wanted, share the data with third-party monitoring tools. Performance Monitor is a diagnostic utility for monitoring the performance of the main elements of your PeopleSoft system, such as web servers, application servers, and Process Scheduler servers. You can monitor real-time performance and analyze historical data.
Performance Monitor reports:
Durations and key metrics of PeopleTools runtime execution, such as SQL statements and PeopleCode events.
Key resource metrics, such as host CPU use and web server execution threads.
See Performance Monitor Instrumentation.
The metrics that are provided by Performance Monitor enable system administrators to:
Monitor real-time system performance.
Identify poorly performing tiers, hosts, domains, servers, application code, and SQL in a PeopleSoft environment.
Identify performance trends.
Address and isolate performance bottlenecks.
Note. Performance Monitor enables you to isolate and identify the causes of performance issues; however, it does not provide automatic solutions to performance issues.
Performance Monitor Architecture
The following diagram illustrates the main elements of Performance Monitor.
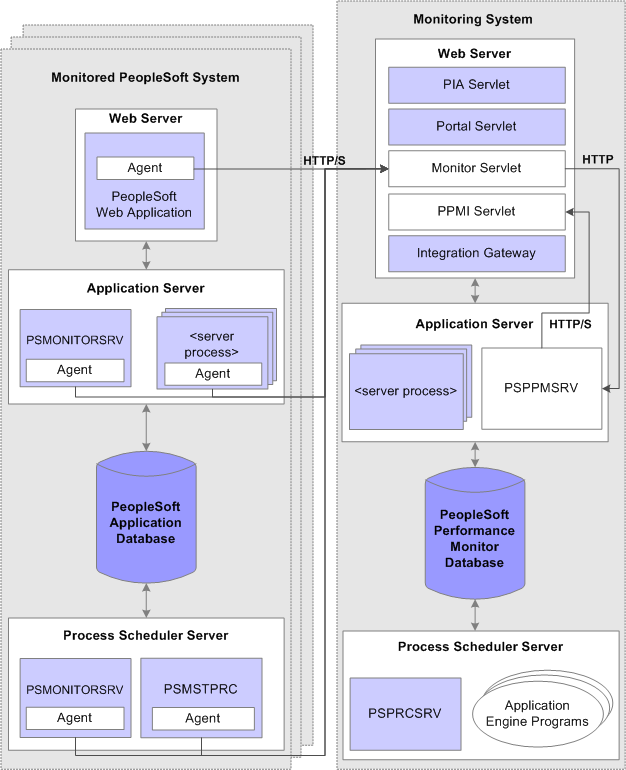
Performance Monitor architecture
A logical distinction must be made between a monitored system and the monitoring system.
A monitoring system can monitor one or more PeopleSoft application systems. However, the monitored system can be monitored by just one monitoring system.
You can configure a self-monitoring system for development and testing.
 The Monitored System
The monitored system comprises the following main elements:
PeopleSoft application database.
Application server.
Web server.
Process Scheduler server.
Note. An application server is also known as a business logic server in some PeopleSoft materials. However, in this PeopleBook, only the term application server appears.
Performance Monitor agents reside on each main element of the monitored system. Agents run on the servers to gather and report performance information. An agent is a small piece of code operating from within an existing process. It collects performance data and uses a dedicated thread to send the data to the monitoring system. Agent threads report data to the monitoring system's monitor servlet, which in turn reports XML formatted performance data to the PSPPMSRV server processes in the monitoring system's application server.
Two types of agents exist:
Process instrumentation agents that report data about the specific server activities.
Domain resource agents that report resource usage statistics about the process and server, such as CPU usage.
PeopleSoft Application Database
The database being monitored is the database for your PeopleSoft application, such as the Human Capital Management database or the Customer Relationship Management database.
Note. Performance Monitor does not monitor the performance of the RDBMS or the server on which it runs.
The application server domain for the monitored system contains the following elements thta are related to Performance Monitor:
|
Performance Monitor Element |
Description |
|
One agent exists for each of the following server processes running within an application server domain:
|
|
|
The domain monitor runs in the PSMONITORSRV application server process. It monitors:
Note. The domain monitor also monitors its own resource consumption. |
The web server contains the following elements that are related to the Performance Monitor:
|
Performance Monitor Element |
Description |
|
Web server agents |
Reports performance metrics from the instrumented code. The system starts a web server agent for a site after the site gets accessed for the first time. |
|
Reports resource events that related to the web server usage. One resource monitor exists for each system that is hosted in each web application on each web server. |
The Process Scheduler for the monitored system contains the following elements that are related to Performance Monitor:
|
Component |
Description |
|
On the Process Scheduler server, only the Master Scheduler process, PSMSTPRC, has a server process agent recording performance data. The PSMSTPRC agent reports batch summary metrics, such as the number of and types of queued tasks. Note. Performance information of this type is available only if a Master Scheduler is configured to run on the system. |
|
|
The domain monitor runs in the PSMONITORSRV server process. It monitors:
Note. The domain monitor also monitors its own resource consumption. |
The Monitoring System
Like the monitored system, the monitoring system includes the following elements:
Performance Monitor database.
Application server.
Web server.
Process Scheduler server.
The database for the monitoring system requires at least the PeopleTools System database (PTSYS) that you create during an initial PeopleSoft installation. This database contains all of the necessary PeopleSoft objects and definitions that are required to store and display PeopleSoft performance data.
Note. The space that is required to store performance data requires increased tablespace sizes, especially in PSIMGR and the associated index tablespace.
Note. Any PeopleSoft system can act as a monitor for any other PeopleSoft system or for itself.
The application server on the monitoring system contains the following elements that are related to Performance Monitor.
|
Performance Monitor Element |
Description |
|
The PSAPPSRV server process functions just as the PSAPPSRV process functions on any PeopleSoft application server. In addition, it advertises Performance Monitor services that are used by the Performance Monitor servlets to retrieve configuration and security data. At least two PSAPPSRV processes are required by the Performance Monitor. This ensures that:
|
|
|
The PSPPMSRV subscribes to performance data that is sent by the monitor servlet of the monitoring system and receives XML messages containing performance data, which it inserts into the monitoring database. Note. The PSPPMSRV does not receive any data directly from agents running on the monitored system. |
The web server on the monitoring system contains the following elements that are related to the Performance Monitor:
The Process Scheduler server for the monitoring system has the following function:
|
Performance Monitor Element |
Description |
|
PeopleSoft Application Engine |
You can schedule or invoke a variety of PeopleSoft Application Engine programs that maintain the data in your monitoring database. |
Implementation OptionsTwo options are available for implementing the Performance Monitor:
Self-monitoring system.
Production monitoring system.
Self-Monitoring Monitoring System
In a self-monitoring system, the same database that serves the PeopleSoft application is also being used to store the performance data. By default, all the elements that are required for the Performance Monitor are installed during the PeopleSoft server installations. So implementing the self-monitoring system requires no additional installation steps.
While this system may require less hardware, the potential impact to your online applications must be considered. Keep in mind that the same database engine is being used to store and retrieve performance data, and the same web server and application server may be used to monitor and collate performance data.
Note. The self-monitoring configuration is not supported for a production environment. The self-monitoring configuration is not designed for a production environment as it affects online transaction processing and overall system performance.
Typically, the self-monitoring system is used in development, testing, or training.
Note. The Performance Monitor has been designed so that a monitoring system does not encounter an infinite loop in a self-monitoring configuration.
Production Monitoring System
With a production monitoring system, you configure a separate PeopleSoft system complete with web server, application server, and database server to act solely as a performance monitoring system. This is the recommended configuration for monitoring your production systems. Any PeopleTools system database that is delivered with PeopleSoft contains the appropriate database definitions to store and retrieve all Performance Monitor data.
With the separate monitoring system, you can monitor a single PeopleSoft system, such as your PeopleSoft Human Capital Management system, or you can configure it to monitor multiple PeopleSoft systems.
Note. Performance Monitor can monitor any PeopleSoft system running on PeopleTools 8.44 or above. Always consult PeopleTools Release Notes and PeopleBooks to become aware of any exceptions or unsupported features between release levels.
Performance Monitor Instrumentation
This section explains the terminology that is associated with the Performance Monitor instrumentation. Instrumentation refers to the modifications that are made to internal PeopleSoft programming code that enables the system to report performance data to a monitor. Select areas of PeopleTools runtime source code have been instrumented.
When the system runs instrumented code, it generates time-stamped performance metrics that are relevant to that section of code. Agents running on the monitored system send the performance data to the Performance Monitor.
Instrumentation generates performance measurement units (PMUs) and events.
Understanding PMUs
A PMU is a unit of measure that reflects the execution of a section of code. The system starts and stops a PMU at specific code locations, and the system may update a PMU anytime between the start and stop times. PeopleTools has defined a set of PMU types, and each type of PMU corresponds to the instrumentation at a specific code location, such as a SQL Execute in PSAPPSRV or a Jolt Request in the web server.
Each PMU includes:
PMU Type.
Instance identifier (a unique identifier for a specific PMU instance).
Start time.
Stop time.
Status.
Metrics (such as number of SQL fetches or buffer size used in a Jolt response).
See PMU Definitions.
Open PMUs are those that are currently being processed. These are PMUs for which a "stop" has not yet been received. Completed PMUs are those for which a "stop" has been received.
PMUs can assume a parent-child relationship. Child-PMUs start within a parent-PMU. Child-PMUs are linked to their parent by the parent instance ID. You can view PMUs within a tree structure that reveals the hierarchy of parent-child PMUs and indicates the processing times at each level.
Understanding Events
Events are notifications containing performance metrics that are different from PMUs in that they are not hierarchical and they do not have durations. Events relate to resource usage, such as CPU usage or memory allocation. PeopleTools has defined a set of event types, and each type of event is reported at a specific location in the instrumented code.
Each event has:
Type.
Instance identifier (a unique identifier for a specific event instance).
Timestamp.
Severity.
Metrics (such as CPU usage and memory allocation).
See Event Definitions.
Performance Integration with Third Party Systems
Using web service technology, performance data that is generated by the Performance Monitor can be shared with third-party performance-monitoring tools by way of the Performance Monitor Integration (PPMI) API which uses the Simple Object Access Protocol (SOAP). The PPMI API protocol is not documented in PeopleBooks and is not intended for customer use. The API is made available for licensed members of the Oracle Partner Network to develop solutions that can be integrated with the PeopleSoft Performance Monitor.
Usage MonitorThe Usage Monitor monitors the definitions (pages, menus, PeopleCode, and so on) accessed by users through the PeopleSoft Internet Architecture. The information collected by the Usage Monitor enables administrators to more accurately understand what definitions in the database are used in their environment, which can assist with impact analysis when applying updates or change packages, for example. Usage Monitor information can also be used in conjunction with the PeopleSoft Test Framework.
When setting up the Performance Monitor system, there are a few additional settings that must be enabled if Usage Monitor data collection is required.
See Also
Setting Up the Performance Monitor
PeopleTools 8.52: PeopleSoft Test Framework
Performance Monitor Data
After the Performance Monitor is configured to retrieve and store data in the performance database tables, you can view the performance data using a variety of PeopleSoft pages that:
Provide a summary of performance data.
Present raw performance data.
Display information in charts.
You can access all of the pages that are related to Performance Monitor using the PeopleTools Performance Monitor menu. Some performance information appears in grids.
While other performance information appears in charts.
You have the option to view chart information in grids for sorting and downloading to Microsoft Excel.
Scope of the Performance Monitor
The Performance Monitor provides performance metrics for:
PeopleSoft Application Server processes (including SQL, PeopleCode, and Cache management).
Web server servlet performance.
Host resource usage.
Master Scheduler performance.
Tuxedo performance.
Recycled server processes in the application server domain.
User request performance.
Note. This list contains the only elements that are monitored by Performance Monitor.