28 Source Debugger
This chapter contains these topics:
28.1 About Source Debugger
There are two types of programs that can be executed under the JD Edwards World Source Debugger - interactive and batch. The only difference when running the Source Debugger on an interactive program compared to a batch program is the initial execution statements. Once the Source Debugger has begun, all of the features are the same for both interactive and batch programs.
The JD Edwards World Source Debugger is a tool designed to help you determine where an error exists in your program. You can apply the Source Debugger to any program, whether it is in production or development. Since the Source Debugger displays source code, you must have the source code installed on your machine.
The source code you see while running the Source Debugger is displayed in SEU Browse mode, so you cannot change a line within the program. However, you may display or change the value of any field, variable, or indicator within the program. In addition, you can add or remove a breakpoint anywhere in the program.
28.1.1 Before You Begin
-
The JD Edwards debug tool is based on IBM debug objects. You must have authority to the IBM commands STRDBG, ADDPGM, ADDBKP at a minimum. IBM has a STRISDB command which interacts with the program source. As of V5R1, the STRDBG command allows use of F10 to step through the program statements once the initial breakpoint is set.
Note:
In order for the program to be debugged to be visible, it must have been compiled on the current machine.28.2 Using Debugger with an Interactive Program
The program can exist in your production environment, your development environment, or both. To use Debugger complete the following tasks:
-
Determine the program environment
-
Initiate the JD Edwards World Source Debugger
-
Execute the program being debugged
To determine the program environment
-
From the Computer Assisted Design menu (G92), select Software Versions Repository.
Figure 28-1 Software Versions Repository screen
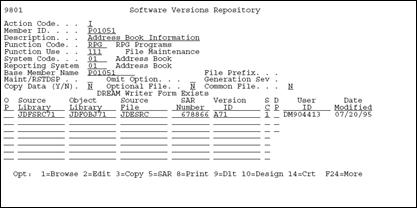
Description of "Figure 28-1 Software Versions Repository screen"
-
Locate the program on which you want to run the Source Debugger, to determine in what environments the program exists.
Note:
If the program exists in several environments (production and development), you must determine against which program environment to run the Source Debugger. While in the debug environment, use WRKOBJ to see which library the program is attached to.To initiate the JD Edwards World Source Debugger
-
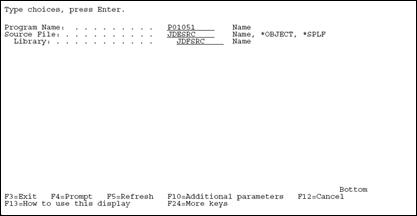
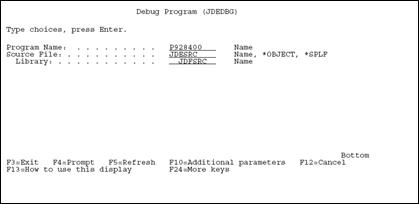
Type the JD Edwards World debug command (JDEDBG) and press F4.
Field Description Program Name Type your program name. Source File Type the file name that contains the source code of your program. If *OBJECT is entered, the source file name and library will be taken from the program object. If *SPLF is entered, the compile listing will be used for the source statements. This will include the statements included from COPY members which allows them to be debugged as well.
Library Type the name of the library that contains the source file. Generally, this is JDFSRC for your production environment or DEVSRC for your development environment. -
Enter the correct values in the proper fields and press Enter to start the Source Debugger.
-
Any time the program being debugged is executed, the source code will display in debug mode, until you end the Source Debugger. (ENDDBG in all cases.)
-
To execute the program being debugged
If it is an interactive program, you can either call the program from a command line or select the menu option that will execute the program.
-
Call program name and include the required parameters
-
Selection/Menu
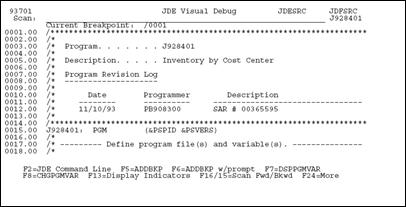
After you have executed the program, the first thing you will see is the program source code.
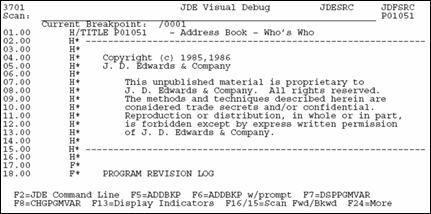
Note:
The source code is displayed in browse mode, so you cannot edit or change any code.28.3 Using Debugger with a Batch Program
To use Debugger with a batch program you should complete the following tasks:
-
Sign on to the program environment
-
Initiate the JD Edwards World Source Debugger
-
Execute the program
-
Set the break point
-
Continue execution
To initiate the JD Edwards World Source Debugger
This step is similar to debugging an interactive program. The difference is that you must enter the debug command twice.
The first time you initiate JD Edwards World Source Debugger (JDEDBG - F4), the Program Name will be the CL Program.
-
Enter the correct values in the proper fields on the Debug Program form and press Enter.
-
Enter the JD Edwards World Source Debugger command (JDEDBG - F4) again, but this time change the Program Name to the RPG Program Name.
The reason for this is you cannot run the Source Debugger on a program that is submitted and executed in a subsystem. You must "trick" the Source Debugger into thinking that your batch program is actually an interactive program.
Since you are executing a batch program interactively, you must call the CL Program from a command line.
-
CALL CL program (The parameters are usually "program name" and "version").
Note:
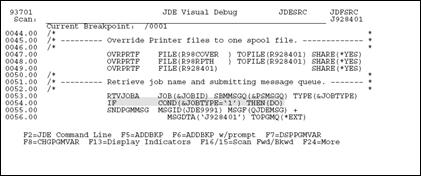
The source code is displayed in browse mode, so you cannot edit or change any code.Set a break point on the line testing the job type in order to change a variable in the CL. The variable &JOBTYPE normally edits against a batch program being executed by calling it from a command line.
-
Press F5 anywhere on the line containing &JOBTYPE to set the breakpoint.
-
The line is highlighted, indicating that a breakpoint has been set on that line.
-
-
Allow your program to continue executing. Press F3 to continue to a breakpoint.
-
The line on which you set the breakpoint will display in reverse image. This indicates that the program has reached this point in the CL program and is ready to execute this line.
-
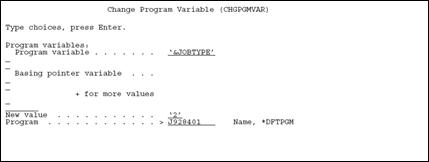
You must change the value of the &JOBTYPE variable to something other than 1 so that the compare to '1' fails.
-
-
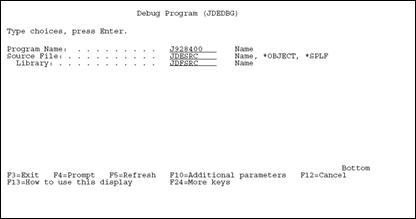
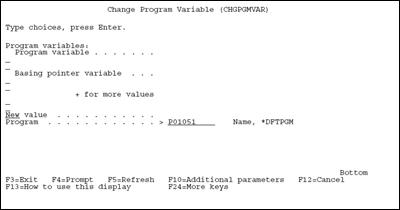
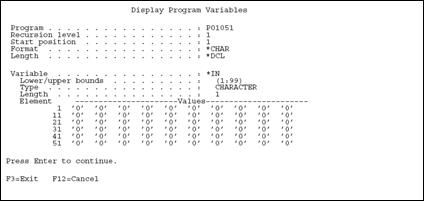
To change the value of &JOBTYPE, press F8 to access the Change Program Variable form.
Figure 28-8 Change Program Variable screen
Description of "Figure 28-8 Change Program Variable screen"
-
Complete the Change Program Variable form and press enter.
The value of &JOBTYPE is now changed to your specified value.
-
Press F3 to allow the CL program to continue processing.
The RPG program source is displayed next.
28.4 Features of the JD Edwards World Source Debugger
| Function | Description |
|---|---|
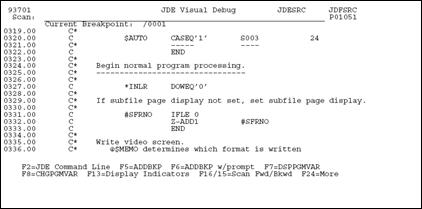
| F6 | Position the cursor on an executable line and press F6 to add a breakpoint with a prompt. You cannot add breakpoints to a comment line, only to executable lines. Once the breakpoint is set, the line will highlight. If the program executes a line with a breakpoint set on it, the line will reverse image and the program will pause before executing the line. |
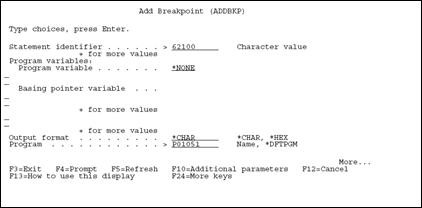
Use the prompt, after pressing F10, to assign a skip value or breakpoint conditions.
| Function | Description |
|---|---|
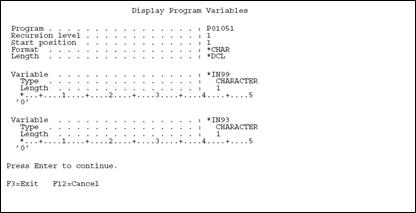
| F7 | Position the cursor on an executable line and press F7 to display the values of all of the variables on that line. Breakpoints within copy modules will stop at the correct source sequence number. |
| Function | Description |
|---|---|
| F8 | To change the value of a variable, press F8 and type the correct values in the prompt screen. |
| Function | Description |
|---|---|
| F10 | Move Line to Top of Page. |
| F12 | From anywhere on the screen, press F12 to remove the current breakpoint. The line is no longer highlighted, indicating the line is no longer set as a breakpoint. The program will immediately continue processing. |
| F13 | To display the current values of all indicators, press F13. |
| Function | Description |
|---|---|
| F15 | Type in a value on the Scan Line at the top of the screen and press F15 to scan backward from the point you are at to the end of the source code. If a match is found, the line containing the matching value will be displayed. To continue scanning backward, press F15 again. |
| F16 | Type in a value on the Scan Line at the top of the screen and press F16 to scan forward from the point you are at to the beginning of the source code. If a match is found, the line containing the matching value will be displayed. To continue scanning forward, press F16 again. |
| F21 | To display a command line, press F21. |
28.4.1 ENDDBG End Debug
To stop the JD Edwards World Source Debugger, enter ENDDBG from a command line. You can not enter ENDDBG while displaying the source code of a program in debug. This command will end debug mode for all programs in the Debugger at that point.
Note:
You can remove a single program from debug mode by using the RMVPGM (remove program) command.