6 Test the Sample Use Case
This chapter contains the topic:
6.1 Testing the Sample Use Case
To get a clearer understanding of the how the process works, the steps for testing the Sample Use Case follow.
After an Address Book record is added with an Employee Search Type, E, the transaction is created using the Approvals System. A XML message with the transaction data is created and transformed into the outgoing XML message format. The XML message is picked up by the Transaction Server and sent as a JMS message to the JMS Queue defined in the Notification Subscription.
Note:
Make sure the World Transaction Server is running. If changes were made to RPG programs, make sure that the library with the updated object is added to the environment.-
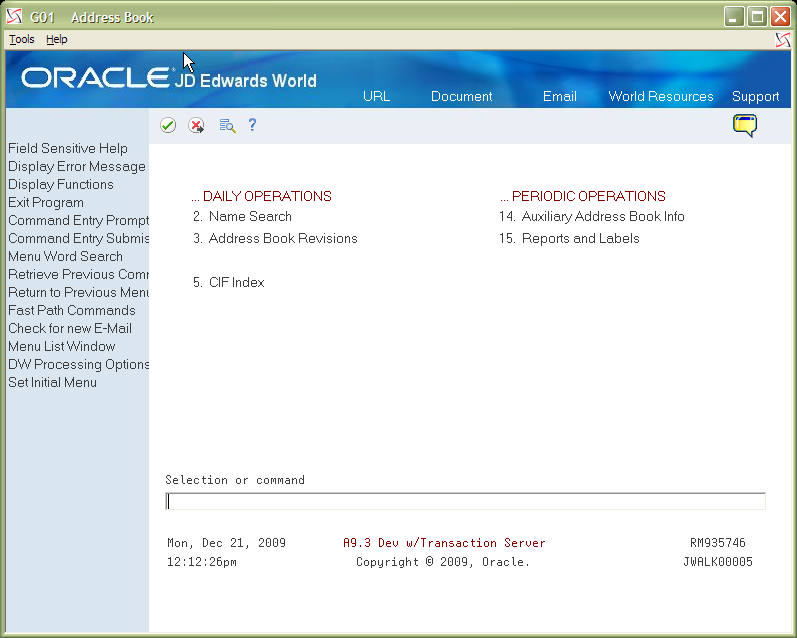
Sign on to the JD Edwards World A9.3 Environment and select the Address Book menu (G01). Select Address Book Revisions (3).
-
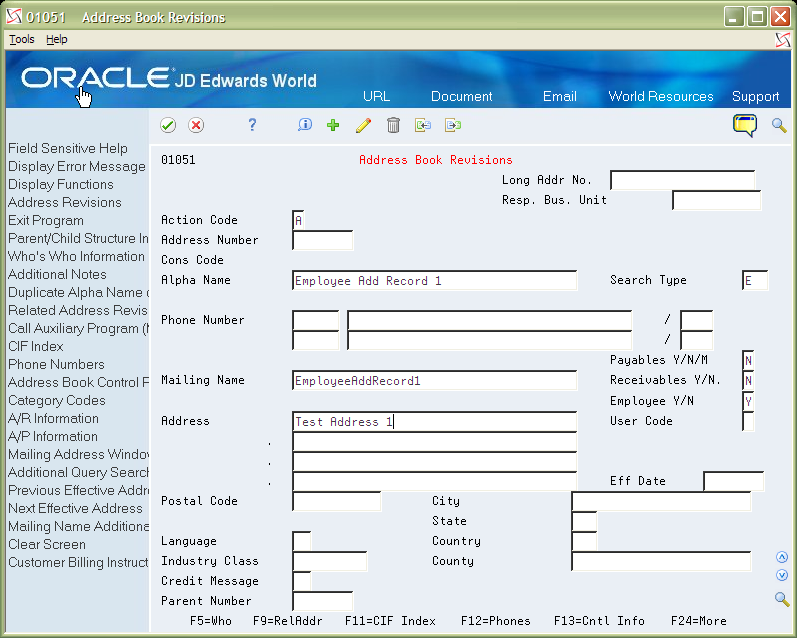
Add an Address Book record, making sure that there is an E in the Search Type field. Other fields can be filed in with test data.
Take note of the Address Book number assigned and exit from the applications.
-
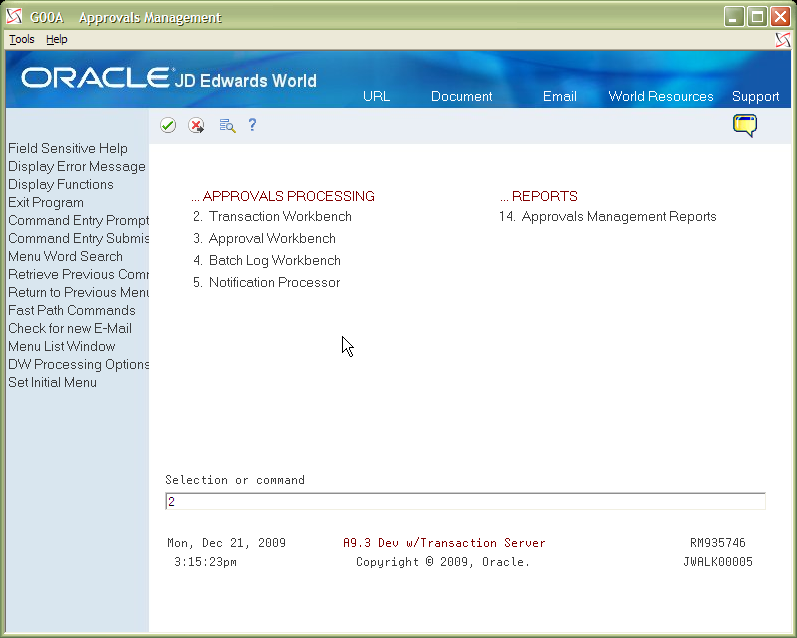
Upon exiting, the Approvals application picks up the employee transaction per the set up. To verify that an Approval's transaction was created, access the Approvals Management menu (G00A) and then select Transaction Workbench (2).
-
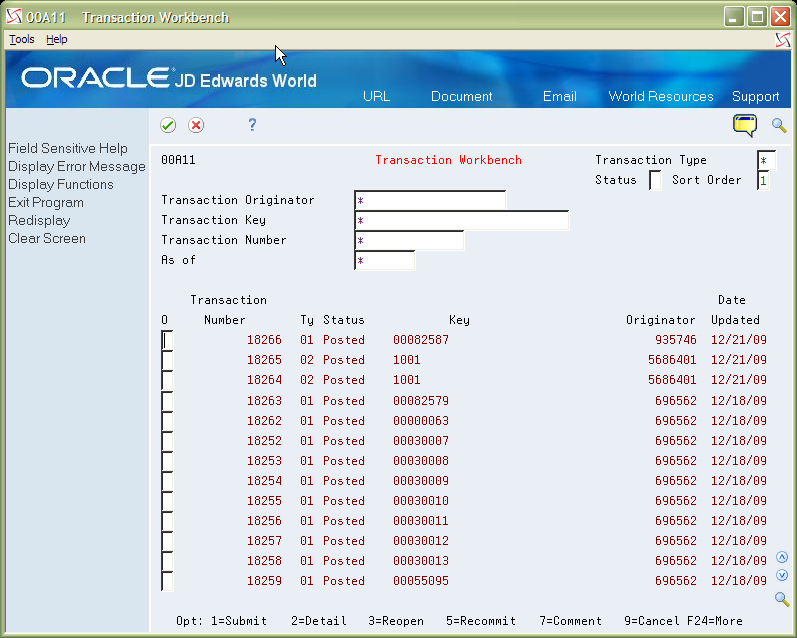
Blank out the Status header field and press Enter to view all the current transactions (or you can use the selection criteria to narrow down the search). The following graphic shows the transaction created is 18266, the Key is 00082587.
-
After the transaction goes through the Approvals system, the XML is created and transformed (if needed). A transaction record is then created in the Notification system. To view the transaction, exit from the Approvals Transaction Workbench. Travel to the Service Enablement menu (G98S). Select Notification Event Transfer (14).
Figure 6-5 Service Enablement (View Transaction) screen
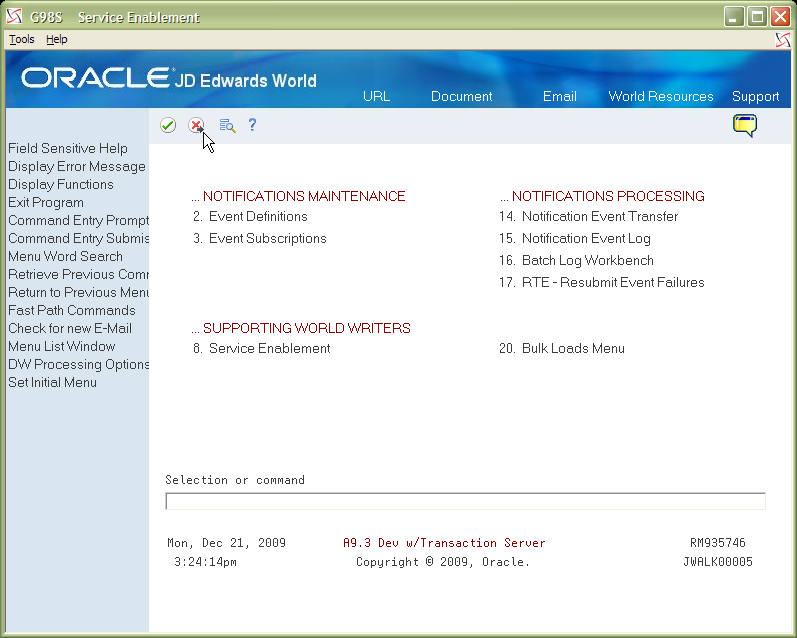
Description of "Figure 6-5 Service Enablement (View Transaction) screen"
-
Press Enter to inquire from the most recent transactions.
For the test transaction, the Event Sequence Number is 1187.
The Event Status of 03, Event ready for transfer, tells the Transaction Server that the transaction is ready to be picked up by the Transaction Server.
Once the Transaction Server picks up the transaction, the status is changed to 04, Event Transferred, and then either to 05, Event Complete, or 06, Event in Error.
Figure 6-6 Notification Event Transfer screen
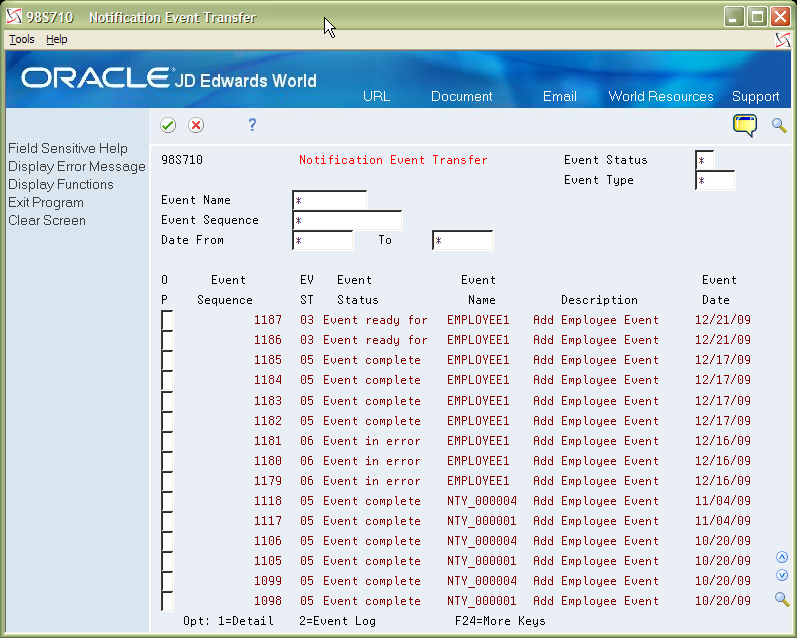
Description of "Figure 6-6 Notification Event Transfer screen"
-
To see the details of the Event, enter a 1 in the Option field and then press Enter.
Figure 6-7 Event Transfer Table - Detail screen
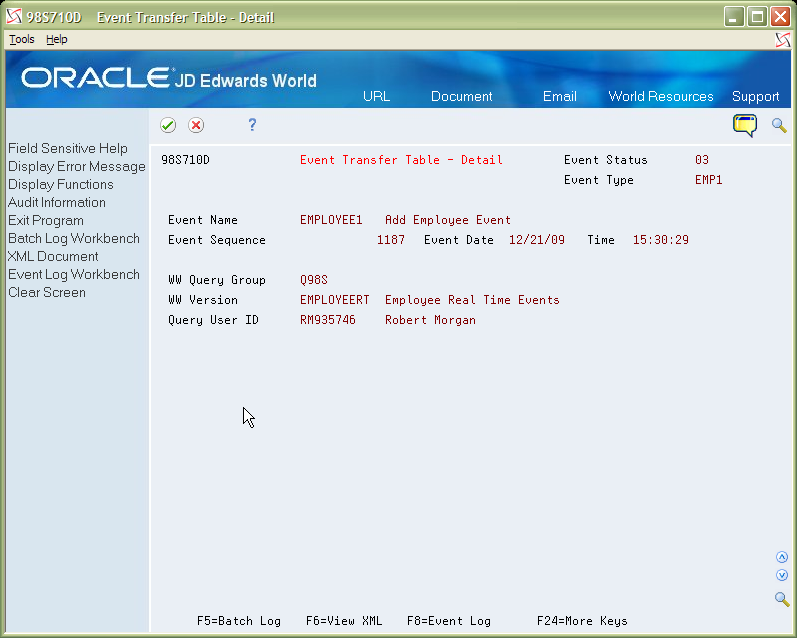
Description of "Figure 6-7 Event Transfer Table - Detail screen"
-
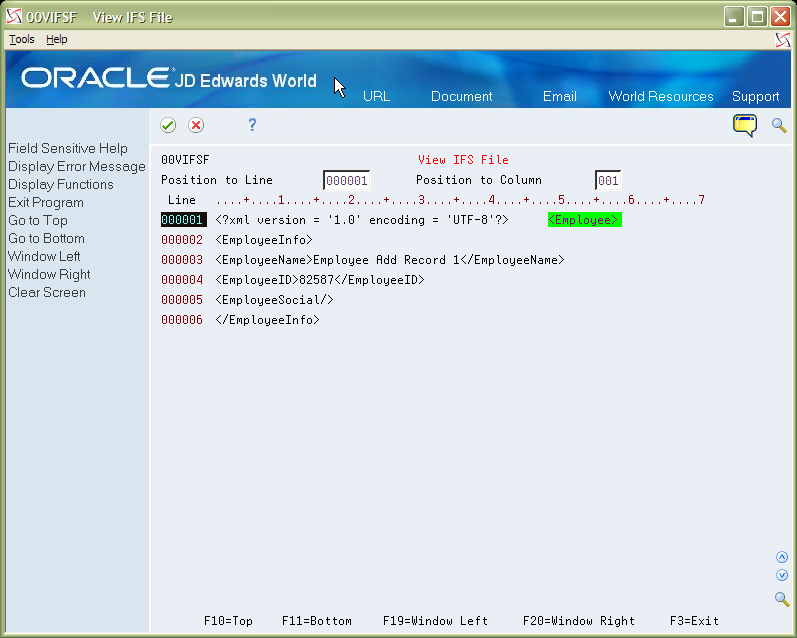
To see the XML payload for the transaction, select the View XML function key (F6). The transformed XML displays.
-
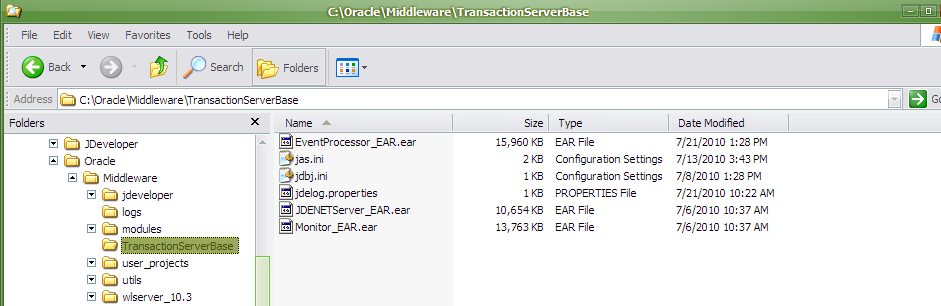
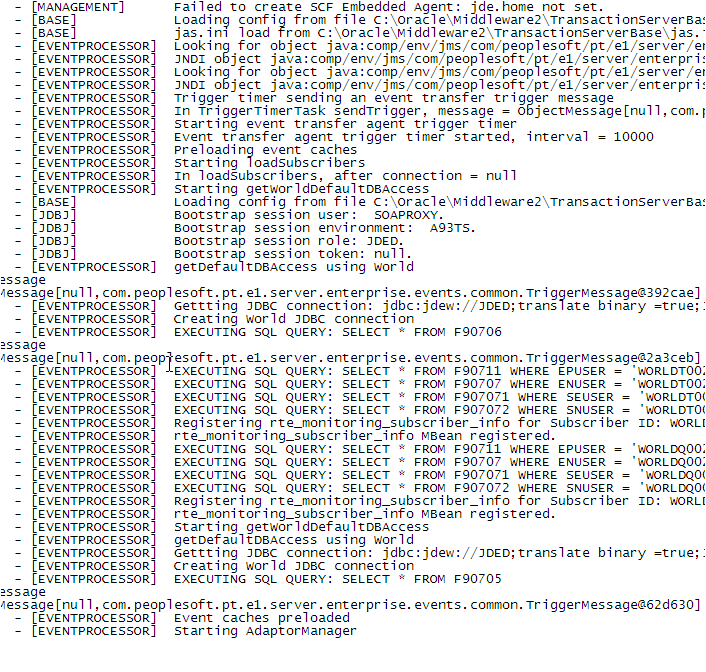
Once the transaction event is picked up by the Transaction Server the processing logs can be viewed on the WebLogic Server host machine. The logs can be found based on the settings in the jdelog.properties file in the install directory for the Transaction Server.
-
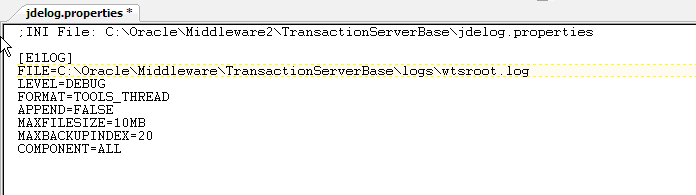
The log files are defined by the FILE specification in the jdelog.properties file.
-
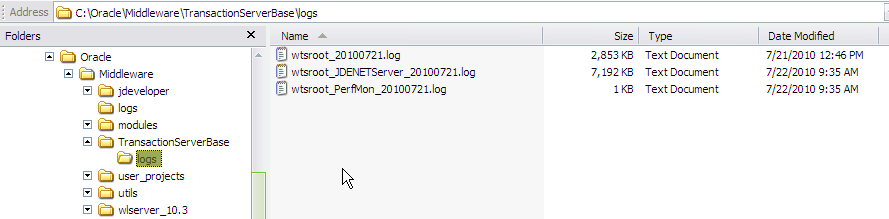
In the log directory, you see two to three different log files.
wtsroot_datestamp.log contains data from the main Transaction Server application.
wtsroot_JDENETServer_datestamp.lop contains data from the JDENET Server application, which is not used for World Transaction Server
wtsroot_PerfMon_datestamp.lop contains data from the Performance Monitor application, which is not used for World Transaction Server
-
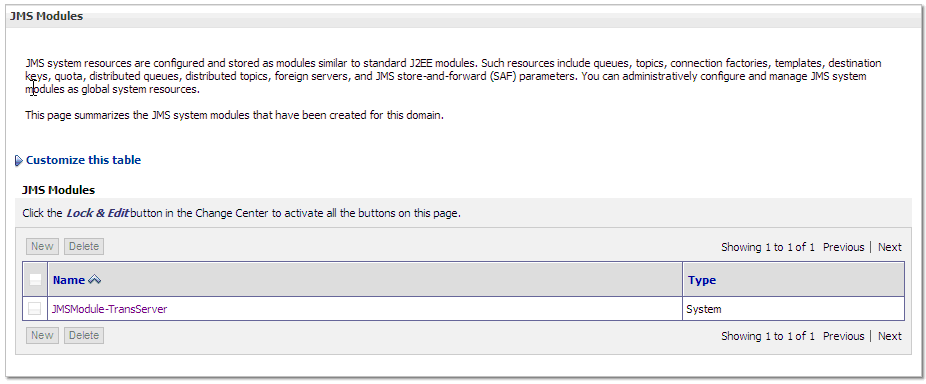
In addition, you can monitor messages sent to the Employee Queue through the Weblogic Admin console. Login into the Admin Console and select the JMS Modules under the Messaging heading on the Home Page screen.
Figure 6-13 Admin Console (Home Page) screen
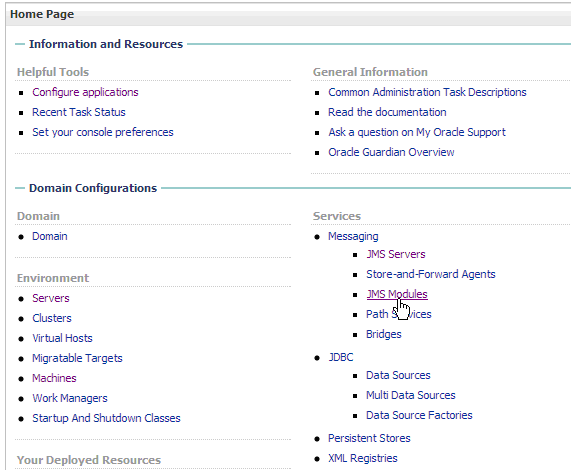
Description of "Figure 6-13 Admin Console (Home Page) screen"
-
Select the JMS Module that the Employee Queue was set up under.
-
On the Settings for JMS Modules screen, select the Employee Queue link.
Figure 6-15 Settings for JMS Module - Trans Server screen
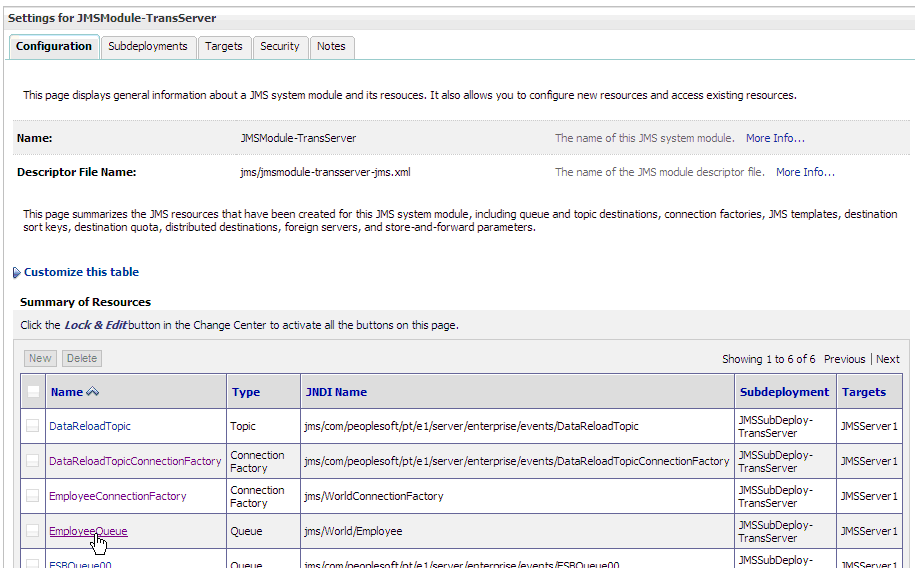
Description of "Figure 6-15 Settings for JMS Module - Trans Server screen"
-
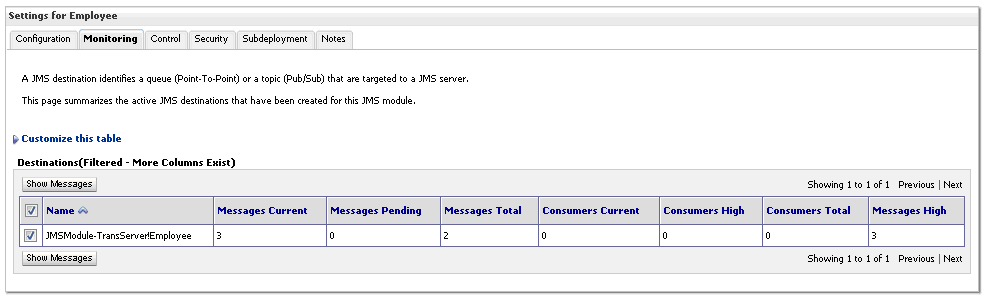
On the Settings for Employee Queue screen, select the Monitoring tab. Select the checkbox beside the Employee Queue destination. Click Show Messages.
-
On the Summary of JMS Messages screen, select one of the message links.
Figure 6-17 Summary of JMS Messages screen
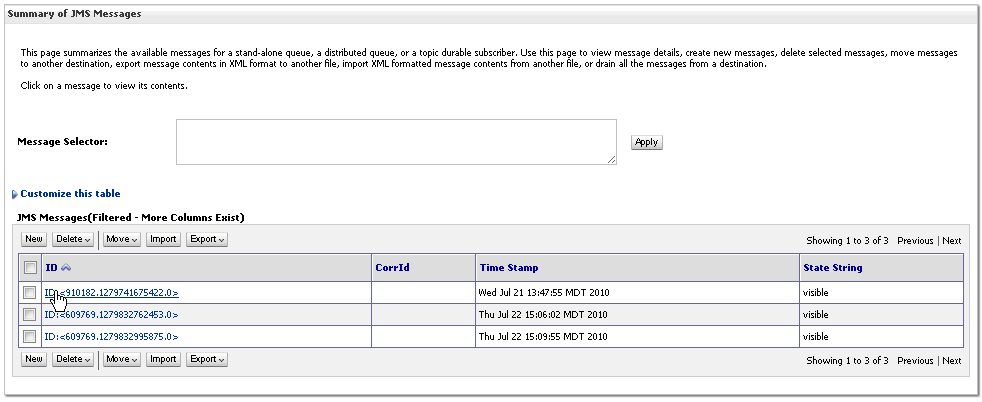
Description of "Figure 6-17 Summary of JMS Messages screen"
-
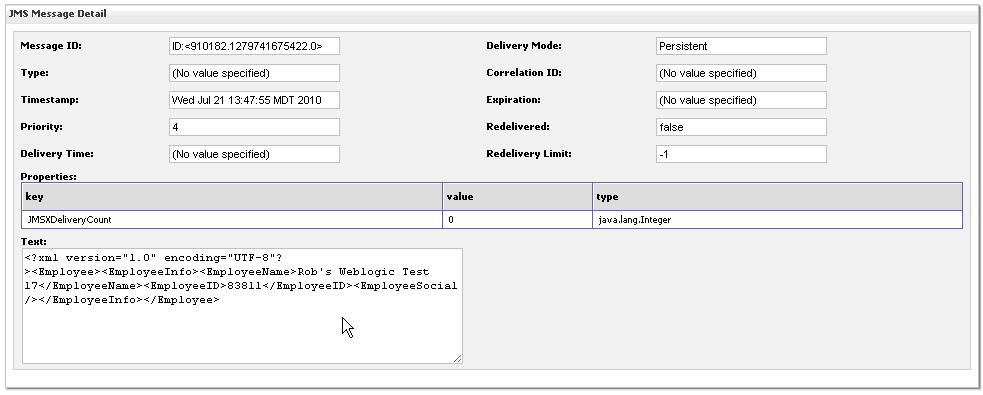
On the JMS Message Detail screen, the system displays the details of the message, including the XML data.