Monitoring and Managing Outbound Service Invocation Messages Using Service Invocation Monitor
Service Invocation Monitor Overview
To effectively track and manage outbound or external service invocations through Service Invocation Framework, Service Invocation Monitor provides the monitoring and auditing capabilities for these outbound invocations from Oracle E-Business Suite. Similar to Service Monitor, Service Invocation Monitor fetches data and statistics for each instance of SOAP and REST service request and response messages and provides tracking records through the UI pages where administrators can view and manage the monitored data.
Note: Service Invocation Monitor and Service Monitor are both monitoring and management tools, but each is designed and used for distinct purposes. Service Invocation Monitor tracks all outbound service invocations through Service Invocation Framework whereas Service Monitor tracks all inbound invocations for Oracle E-Business Suite services. For information about Service Monitor, see Monitoring and Managing Inbound Service Invocation Messages Using Service Monitor.
Note: In this release, Service Invocation Monitor does not track and monitor the service invocations from the PL/SQL layer.
Service Invocation Monitor provides the following features:
-
Monitoring and Auditing: These monitoring and auditing features provide audit trails for administrators to quickly identify any errors if occurred during the invocation activities.
By default, the monitoring and auditing features are disabled. You can enable or disable these features if desired.
-
Purging: It purges SOAP and REST messages stored in the Oracle E-Business Suite database, along with the audit records that have been collected through Service Invocation Monitor for a period of time.
Accessing Service Invocation Monitor
Log in to Oracle E-Business Suite as a user who has the Integration Administrator role.
Select the Integrated SOA Gateway responsibility from the navigation menu and then select the Administration > Invocation Monitor link. The Invocation Monitor subtab is displayed with the Invocation Monitor Search page.
Invocation Monitor Search Page with Search Results
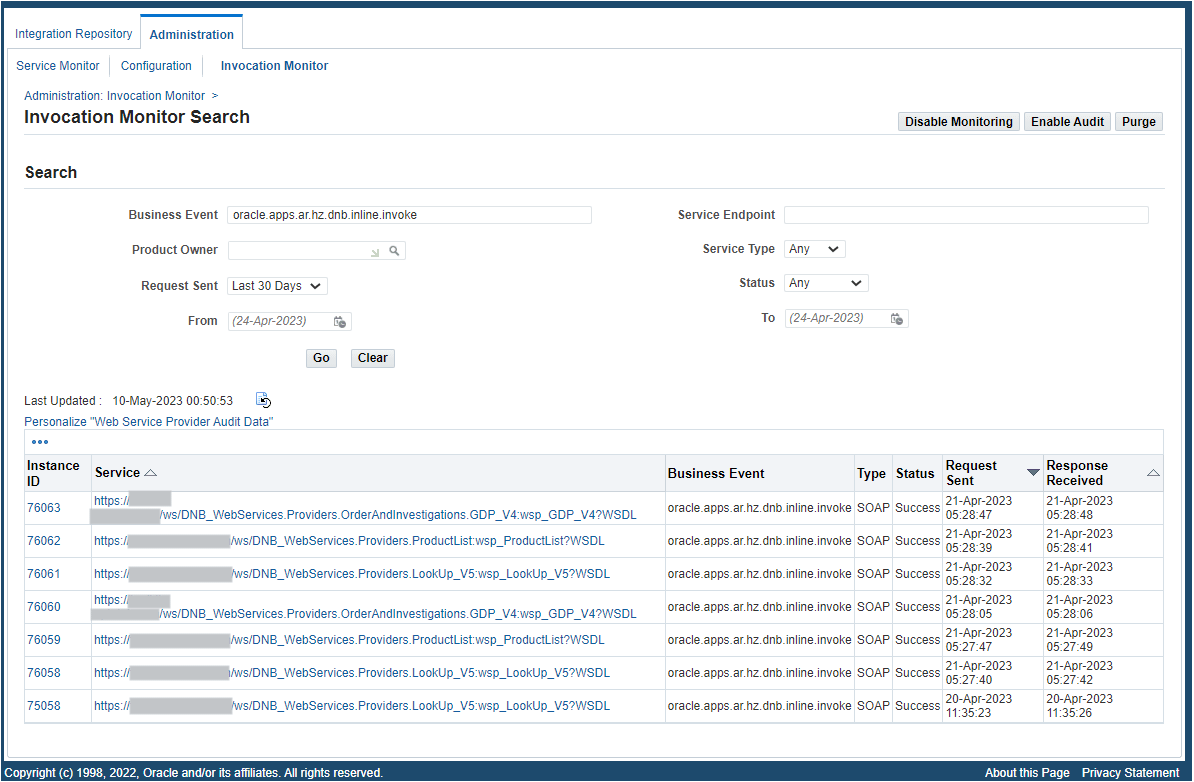
Integration administrators can perform the following activities through Service Invocation Monitor:
Enabling Monitoring and Auditing for Outbound Invocations
Similar to Service Monitor, Service Invocation Monitor provides monitoring and auditing features. If these features are enabled, all the invocation request and response messages through Service Invocation Framework can be tracked and saved in Service Invocation Monitor.
Service Invocation Search Page for Enabling Monitoring
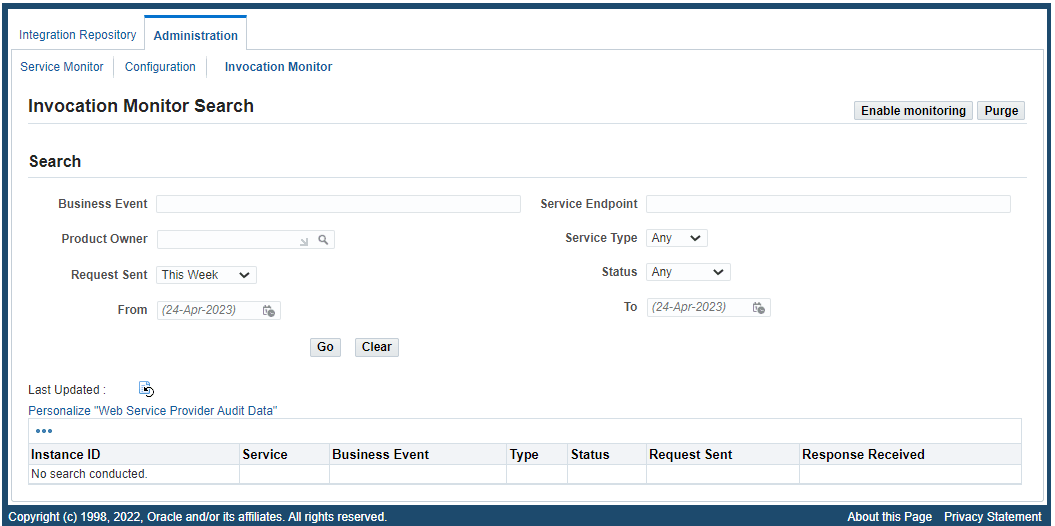
By default, the monitoring and auditing features are disabled.
To enable or disable the monitoring feature, click Enable Monitoring or Disable Monitoring in the Invocation Monitor Search page.
Clicking Enable Monitoring only enables the monitoring feature, the auditing feature is not enabled by default. You need to click Enable Auditing to enable the auditing feature. Only when the auditing feature is enabled, the payload messages can be captured. Click Disable Auditing to disable the auditing feature if it is enabled.
Note: Clicking Disable Monitoring also disables the auditing feature. To enable the auditing feature, you must first enable the monitoring feature by clicking Enable Monitoring, and then Enable Auditing.
Searching SOAP and REST Requests
In the Invocation Monitor Search page, perform a search to locate your desired instances of outbound service invocations through Service Invocation Framework.
In the Search region, enter your desired search criteria, such as business event name, service endpoint, product owner, service type, request sent time, request sent time period, and request status.
-
Business Event: Enter an event name that is used to invoke an external service. For example, enter
oracle.apps.po%to locate the event names containingoracle.apps.poas the search result. -
Service Endpoint: Enter a desired service endpoint name. For example, enter
%getPO%to locate all service endpoint containinggetPO. -
Product Owner: Use the list of values to select a product that owns the business event subscription.
-
Service Type: Select a desired service type, including "Any", "REST", and "SOAP". By default, "Any" is selected.
-
Request Sent: Select a desired value from the list of values. It includes "Any Time", "Today", "This Week", "Last 2 Weeks", "Last 30 Days", "Last 60 Days", and "Last 90 Days". By default, "Today" is selected.
Note: All the selection values listed here include the current day (today), except "Any Time". For example, "This Week" means the last 7 days, including the current day (today). "Any Time" means a blind search of requests sent regardless of the Request Sent date.
-
Status: Select a desired value from the list of values for your search. It contains "Any", "In Process", "Processed Successfully, and "Processed with Error". By default, "Any" is selected.
-
From: Use the Date Time Picker to select an appropriate request sent start date.
-
To: Use the Date Time Picker to select an appropriate request sent end date for your search.
Click Go to process your search. All entries that match your search criteria will be retrieved and displayed in a table. Each entry in the result table includes the instance ID, service name, business event name, service type, date and time the request was sent and the response was received.
From the search result page, you can perform the following tasks:
-
View the request and response details in the Invocation Instance page by clicking the Instance ID link for a given request
See: Viewing SOAP and REST Service Invocation Instance Details.
-
View the status of each monitored request and response
-
View the business event for a given request
-
Purge outbound Service Invocation Monitor data collected over a period of time by clicking Purge
For information on how to enable the monitoring and auditing features in Service Invocation Monitor, see Enabling Monitoring and Auditing for Outbound Invocations.
To perform a search:
-
Log in to Oracle E-Business Suite as a user who has the Integration Administrator role. Select the Integrated SOA Gateway responsibility. From the navigation menu, select the Invocation Monitor link from the Administration section to open the Invocation Monitor Search page.
-
In the Search region, enter appropriate search criteria, including business event name, service endpoint, product owner, request sent time, service type, request status, and requests sent between the From and To date-time values for your search. Click Go to process your search.
-
All requests that match your search criteria appear.
-
Click the Instance ID link for a given ID to view the request and response details in the Service Instance page.
-
Click the Business Event link to view the selected business event details.
-
Click Purge to purge monitored data collected for a period of time.
Viewing SOAP and REST Service Invocation Instance Details
From the search result table in the Invocation Monitor Search page, you can view all SOAP and REST invocation messages that match your search criteria. To view the request and response details for a given instance, click the Instance ID link of a desired instance. The Invocation Instance Details page appears for your selected instance with "SOAP" or "REST" service type:
Viewing SOAP Service Invocation Details
When you click an instance ID link from the search result table and that instance is for a service type of "SOAP", then the SOAP Invocation Details page appears.
SOAP Invocation Details Page
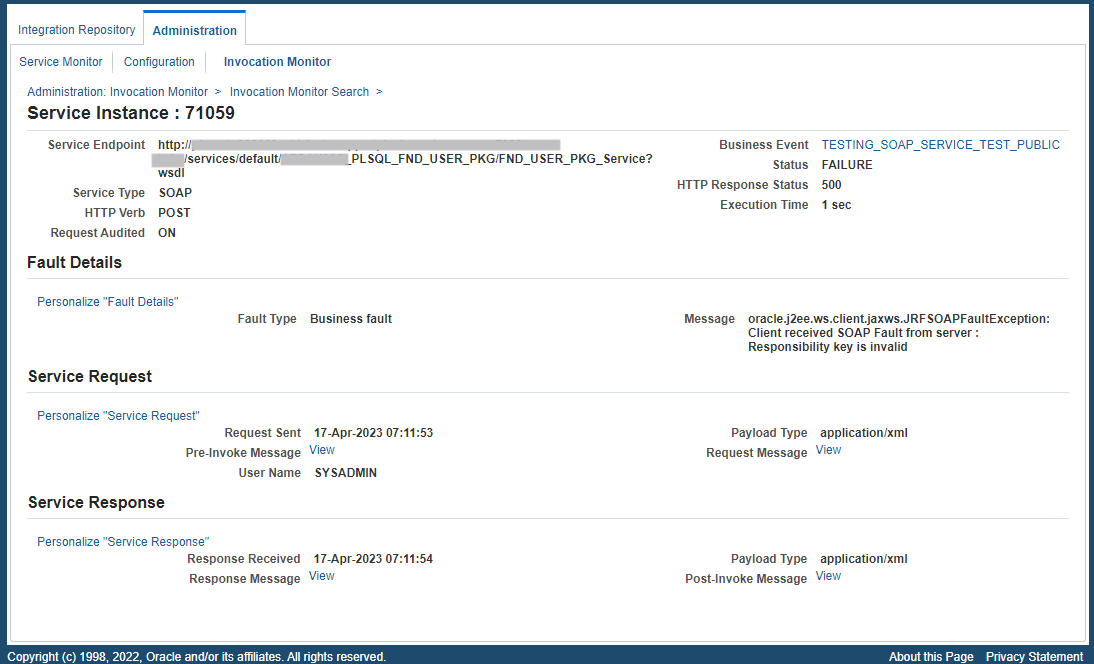
This page displays the invocation details, along with the Service Request region and Service Response region.
The invocation information includes the complete Service Endpoint information along with the Business Event link, Service Type "SOAP", Status, HTTP Verb, HTTP Response Code, Request Audit (On or Off to indicate whether the auditing feature is enabled or not when the request is sent), and the Execution Time between the request is sent and the response is received.
-
Business Event: Click the Business Event link to view the corresponding Business Event Details page.
-
HTTP Verb: "POST" is displayed.
Fault Details Region (Conditional)
This region appears only if the request has a "Failure" status.
Fault Type: Depending upon the nature of the fault, the value could be one of the following types:
-
Client Fault: Service exceptions returning 4xx series (such as 401) HTTP status codes are client-side faults.
-
Business Fault: Service exceptions returning 5xx series (such as 500) HTTP status codes are business faults.
Fault Message: The fault code or the first 150 characters of the error message are shown.
Service Request Region
This region contains the SOAP invocation request information, including request sent date and time, payload type (XML), pre-invoke message, SOAP request message, and username.
-
Click the Pre-Invoke Message View link if it is available to view the event data payload in XML format. This is the payload data before the request message is constructed or before any processing in the
PreInvokemethod. -
Click the Request Message View link if it is available to view the content in HTTP body sent as the request. Note that this View link is not displayed if the SOAP request is for the GET method.
A Sample SOAP Request Message

Service Response Region
This region contains the SOAP invocation response details, such as response received date and time, payload type (XML), post-invoke message, and SOAP response message.
-
Click the Response Message View link if it is available to view the content in HTTP body received as the response.
-
Click the Post-Invoke Message View link to view the event data payload in XML format. This is the payload data after post processing on the response message received or after any processing in the
PostInvokemethod.
Viewing REST Service Invocation Details
When you click an instance ID link from the search result table and that instance is for a service type of "REST", then the REST Invocation Details page appears.
This page contains invocation details for the selected instance, Service Request region, and Service Response region.
REST Invocation Details Page
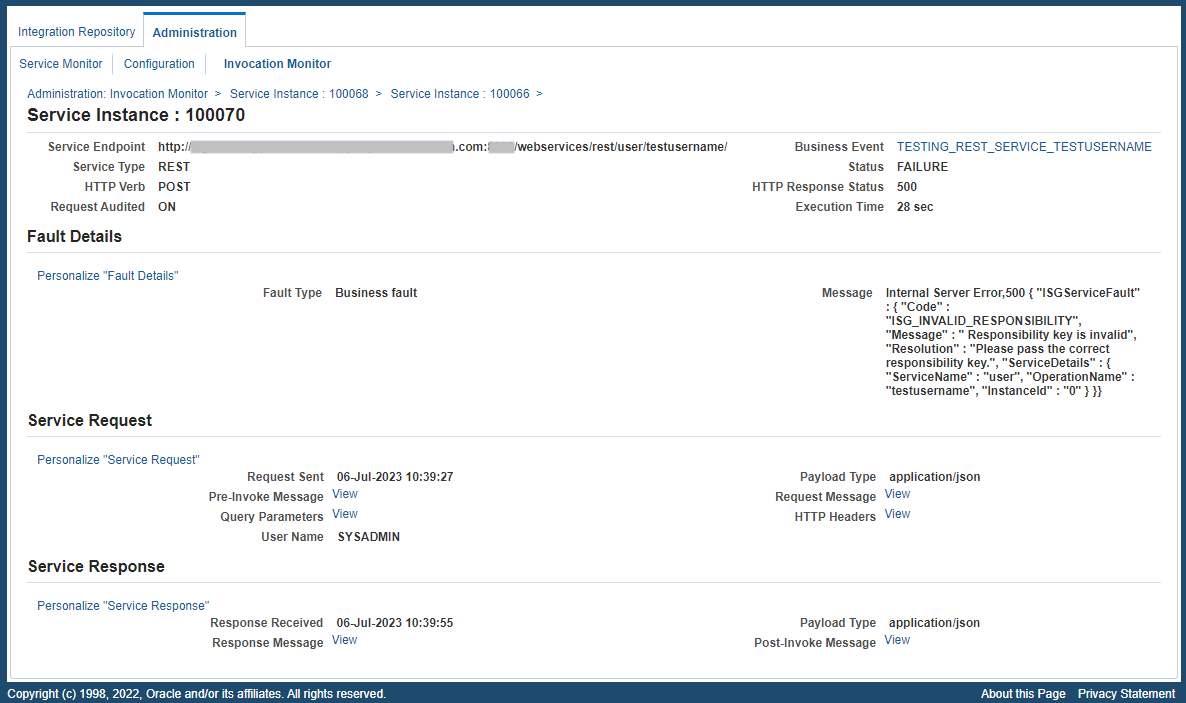
The invocation information shown on the top of the page includes the complete Service Endpoint, Business Event link, Service Type "REST", Status, HTTP Verb, HTTP Response Code, Request Audit (On or Off to indicate whether the auditing feature is enabled or not when the request is sent), and the Execution Time between the request is sent and the response is received.
-
Business Event: Click the Business Event link to view the corresponding Business Event Details page.
-
HTTP Verb: "POST" or "GET" is displayed.
Fault Details Region (Conditional)
Similar to the Fault Details region for the SOAP Invocation Details page, this region appears only if the REST request has a "Failure" status.
You can find the fault details through the Fault Type and Message fields, as described in the Viewing SOAP Service Invocation Details.
Service Request Region
This region contains the REST invocation request information, including request sent date and time, payload type (XML or JSON), pre-invoke message, request message, query parameter, HTTP Headers, and username.
-
Click the Pre-Invoke Message View link if available to view the event data payload. This is the payload data before the request message is constructed or before any processing in the
PreInvokemethod. -
Click the Request Message View link if it is available to view the content in HTTP body sent as the request. Note that this View link is not displayed if the REST request is for the GET method.
-
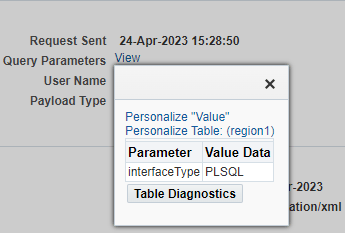
Click the Query Parameters View link to display a list of query parameters and their corresponding values in a table. For example, the following table includes one query parameter called "Interface Type" and the associated value "PLSQL":
Query Parameters Parameter Value Interface Type PLSQL Click the View link to display the query parameters in a dialog.
REST Request Message Query Parameters
-
Click the HTTP Headers View link to view the HTTP Headers sent in the request. For example, it can be like:
GET /home.html HTTP/1.1
        Host: www.example.com
        Accept: application/json
        Referrer: https://www.example.com
        Connection: keep-alive
Service Response Region
This region contains the REST invocation response details, such as response received date and time, payload type (XML or JSON), post-invoke message, and response message.
-
Click the Response Message View link if it is available to view the content in HTTP body received as the response.
-
Click the Post-Invoke Message View link to view the event data payload after post processing on the response message received or after any processing in the
PostInvokemethod.
Purging Service Invocation Monitor Data
All SOAP and REST invocation messages stored in the Oracle E-Business Suite database, and audit records that have been collected through Service Invocation Monitor for a period of time can be purged. Click Purge in the Invocation Monitor Search page to launch the Invocation Monitor Purge Data page.
Invocation Monitor Purge Data Page
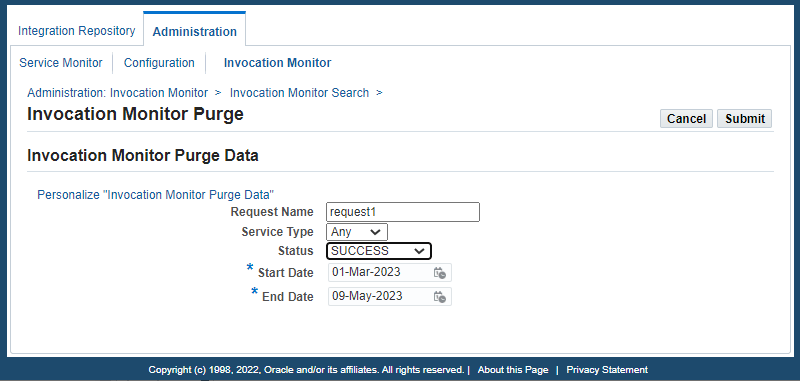
Enter the following purge parameters in the Invocation Monitor Purge Data page:
-
Request Name: Specify the Request Name for your request.
-
Service Type: Select a desired service type from the drop-down list. It can be 'SOAP', 'REST', or 'Any'. By default, 'Any' is selected, meaning that both SOAP and REST service types are included.
-
Status: Specify a desired status from the drop-down menu for your request.
-
Start Date: Identify the start date of the date range for your purge.
-
End Date: Identify the end date of the date range for your purge.
Click Submit. A request number will be automatically assigned to you for your purge request indicating that your request has been submitted for processing. Service Invocation Monitor will purge all monitored invocation data that match the purge criteria within your specified date range.
To purge service invocation requests and responses:
-
Log in to Oracle E-Business Suite as a user who has the Integration Administrator role. Select the Integrated SOA Gateway responsibility.
From the navigation menu, select the Invocation Monitor link from the Administration section to open the Invocation Monitor Search page.
-
Click Purge.
-
Enter the following information in the Invocation Monitor Purge Data page:
-
Enter the request name for your purge request.
-
Select a desired Service Type value (SOAP, REST, or Any) for your purge.
-
Select a desired Status value for your purge request.
-
Enter the Start Date and End Date fields to specify the time range for your purge.
-
-
Click Submit to submit your purge request.