Oracle Assets Command Center
This chapter covers the following topics:
- Assets Command Center Overview
- Asset Reconciliations Dashboard
- Asset Cost Dashboard
- Asset Aging Dashboard
- Asset Location Dashboard
- Asset Mass Transactions Dashboard
- Asset Pipeline Dashboard
- Asset Retirement Dashboard
Assets Command Center
Assets Command Center Overview
Oracle Assets Command Center uses the Oracle Enterprise Command Center Framework to help you analyze and act on current asset-related data from across your enterprise. Improve your decision making and maximize operational efficiency with the sophisticated guided navigation and powerful search capability of the command center. Identify operational issues through metrics, graphs, and tag clouds, and take immediate action by drilling down directly to the underlying business processes in Oracle Assets.
As a fixed assets manager or fixed assets accountant, use the Assets Command Center to:
-
Speed up period close.
-
Reconcile Oracle Assets and Oracle General Ledger accounting discrepancies.
-
Clear pending revalue, reclass, and transfer transactions, and more.
-
-
Forecast and manage capitalization events.
-
Assess impact on key financial indicators.
-
Monitor capitalization spending.
-
-
Increase asset utilization.
-
Resolve asset utilization, assignment, and location discrepancies.
-
Address data quality issues.
-
-
Track retired assets.
-
Maintain a detailed record of all retired assets.
-
Analyze why assets are being retired, and the retirement type.
-
Identify potential cost saving through a better understanding of retirement patterns and reasons.
-
The Assets Command Center includes the following dashboards:
-
Asset Reconciliations: Use this dashboard to investigate and correct discrepancies between asset cost accounts in Oracle General Ledger (GL) and in Oracle Subledger Accounting (SLA). See Asset Reconciliations Dashboard.
-
Asset Cost: Use this dashboard to analyze asset costs for major and minor categories. The dashboard displays an overview of asset costs and accumulated depreciation by category. See Asset Cost Dashboard.
-
Asset Aging: Use this dashboard to search for assets and to view asset aging. The dashboard provides useful asset life information for all assets depreciated by the base-life method. See Asset Aging Dashboard.
-
Asset Location: Use this dashboard to track fixed assets across all locations and employee assignments, and to detect discrepancies in cost center assignments. The actionable links in this dashboard help you execute asset transfers and assignments in Oracle Assets to resolve missing assignments or mis-allocated resources. See Asset Location Dashboard.
-
Asset Mass Transactions: Use this dashboard to gain insight into pending transactions, such as mass additions, mass reclassifications, mass revaluations, and mass transfers. It provides actionable links to Oracle Assets for the fixed assets accountant to ensure that all pending transactions are processed on time to close asset books. See Asset Mass Transactions Dashboard.
-
Asset Pipeline: Use this dashboard to check all additions pipeline that exist in Oracle Payables and Oracle Projects that affect asset costs. See Asset Pipeline Dashboard.
-
Asset Retirement: Use this dashboard to track asset retirement activities, monitor and analyze retirements by type, cost, and financial impact. See Asset Retirement Dashboard.
Note: You can use the Assets Command Center only after the installation and common configurations are completed as described in My Oracle Support Knowledge Document 2495053.1, Installing Oracle Enterprise Command Center Framework, Release 12.2. For additional ECC overview information, see Overview of Enterprise Command Centers, Oracle E-Business Suite User's Guide.
Searching Enterprise Command Center Dashboards
Use the dashboard sidebar to refine (filter) the data on each dashboard. You can select a value or record from the Available Refinements component, or use Search to find a keyword, a value, or a specific record. The type-ahead feature suggests matches for your entry that correspond to the available refinements. When you submit a search, the search term is added to the Selected Refinements list, and the dashboard data is refined to include only records that match the search. You can add multiple refinements and remove any of them at any time. Use Saved Search to create and save your search. You can edit, delete, or refer to this saved search. You can also use data sets to further refine your search.
Use an asterisk (*) or percent (%) to perform a partial keyword or record search that matches any string of zero or more characters. You can also use a question mark (?) to perform a partial search that matches any single character.
Additional Information: For more information about searching for and refining data in enterprise command centers, see "Search" in Highlights of an Enterprise Command Center, Oracle E-Business Suite User's Guide.
Asset Reconciliations Dashboard
See Assets Command Center Overview.
The Asset Reconciliations dashboard targets to help fixed assets managers to validate the cost accounts balance and all other balances affected by the following accounting events:
-
Additions and Capitalizations
-
Adjustments
-
Transfers and Reclassifications
-
Revaluations
-
Retirements and Reinstatements
The dashboard displays an overview of and visibility into all asset cost accounts balances for Oracle Assets and Oracle General Ledger. It displays them side by side to help you identify asset cost accounts. Further, this dashboard enables you to analyze data using asset metrics, charts, graphs, and tables.
Use the Asset Reconciliations dashboard to:
-
Reconcile the year-to-date activities.
-
Find discrepancies between Fixed Assets and General Ledger balances.
-
Minimize errors and increase accuracy of financial statements.
Note: The Asset Reconciliations dashboard will not reconcile depreciation and accumulated depreciation accounts and will focus only on the Addition, Adjustment, Retirement, Revaluation, Transfer, and Reclass accounting events.
From the Fixed Assets Manager responsibility, navigate to the Asset Reconciliations dashboard:
(N) Assets Command Center > Asset Reconciliations
Asset Reconciliations Dashboard
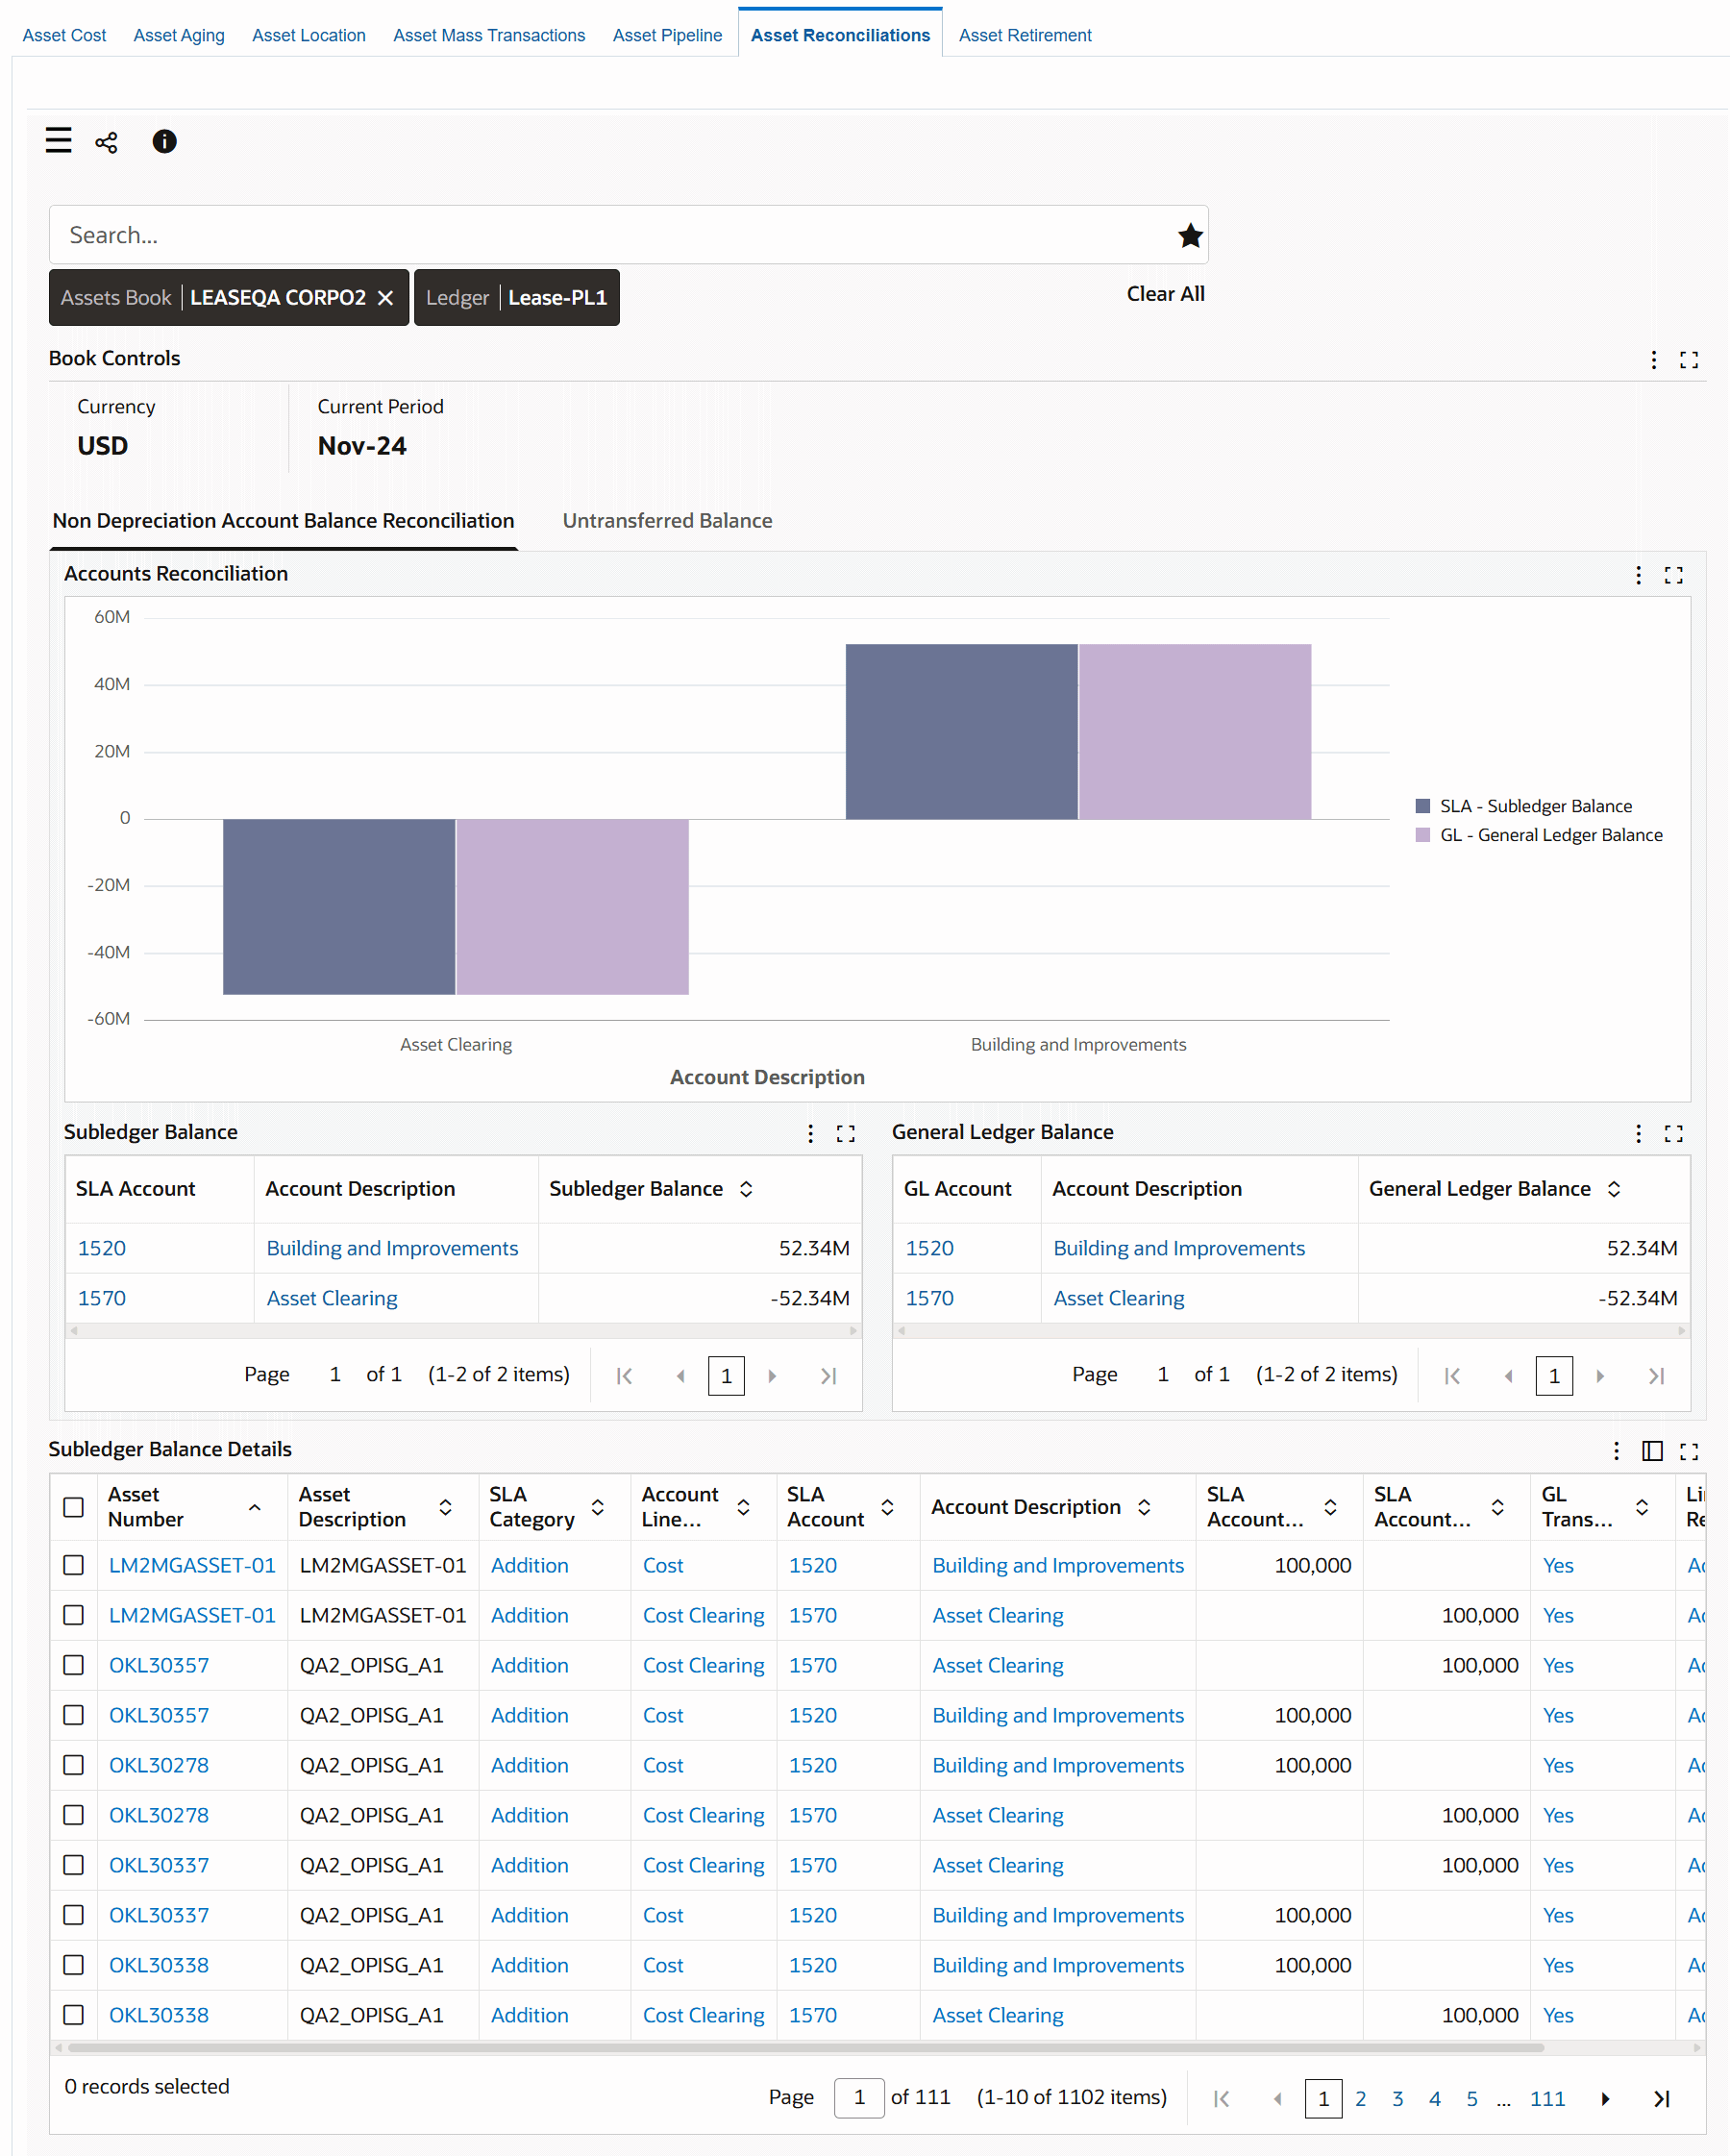
The following table describes the dashboard:
| Component | Description |
|---|---|
| Assets Book (filter chip) | The Assets Book filter displays the asset book that you can access. If you have access to multiple books, then select a book to view data within the context of the selected asset book. The Assets Book list displays the asset books that you can access with the asset count for each book. |
| Ledger (filter chip) | When you select a ledger, the associated asset book will be displayed. If multiple asset books are linked to the ledger, then the ledger selection will be restricted to those specific books. |
| Book Controls (summary bar) | This summary bar provides the following information:
|
| Non Depreciation Account Balance Reconciliation (tab) Accounts Reconciliation (chart) |
This comparative bar chart shows the totals of account balances in the subledger and the General Ledger along with the account description. |
| Non Depreciation Account Balance Reconciliation (tab) Subledger Balance (aggregate table) |
This aggregate table list all the subledger accounts and description with corresponding balance in the subledger with the option to break down the balance by the cost center. |
| Non Depreciation Account Balance Reconciliation (tab) General Ledger Balance (aggregate table) |
This aggregate table list all the General Ledger accounts and description with corresponding balance in the GL with the option to break down the balance by the cost center. |
| Untransferred Balance (tab) Subledger Balance by Account Description, Major Category (chart) |
The chart in this tab displays the total untransferred balance to the General Ledger by account description and assets major category, with the availability to drill down from major to minor category. |
| Subledger Balance Details (results table) | This table provides account balance details in journal form. |
| Options (table-level actions) | Export: Use this action to export the search results in a comma-separated values (CSV) file format. |
Asset Cost Dashboard
See Assets Command Center Overview.
The Asset Cost dashboard displays an overview of asset cost and accumulated depreciation by category. You can view asset cost metrics, asset cost charts, and results tables.
Use the Asset Cost dashboard to:
-
Gain visibility into all financial transactions affecting asset value.
-
Discover incorrect classification of assets across categories.
-
Take action to resolve discrepancies, correctly categorize assets, and analyze root causes of inaccuracies.
From the Fixed Assets Manager responsibility, navigate to the Asset Cost dashboard:
(N) Assets Command Center > Asset Cost
Asset Cost Dashboard
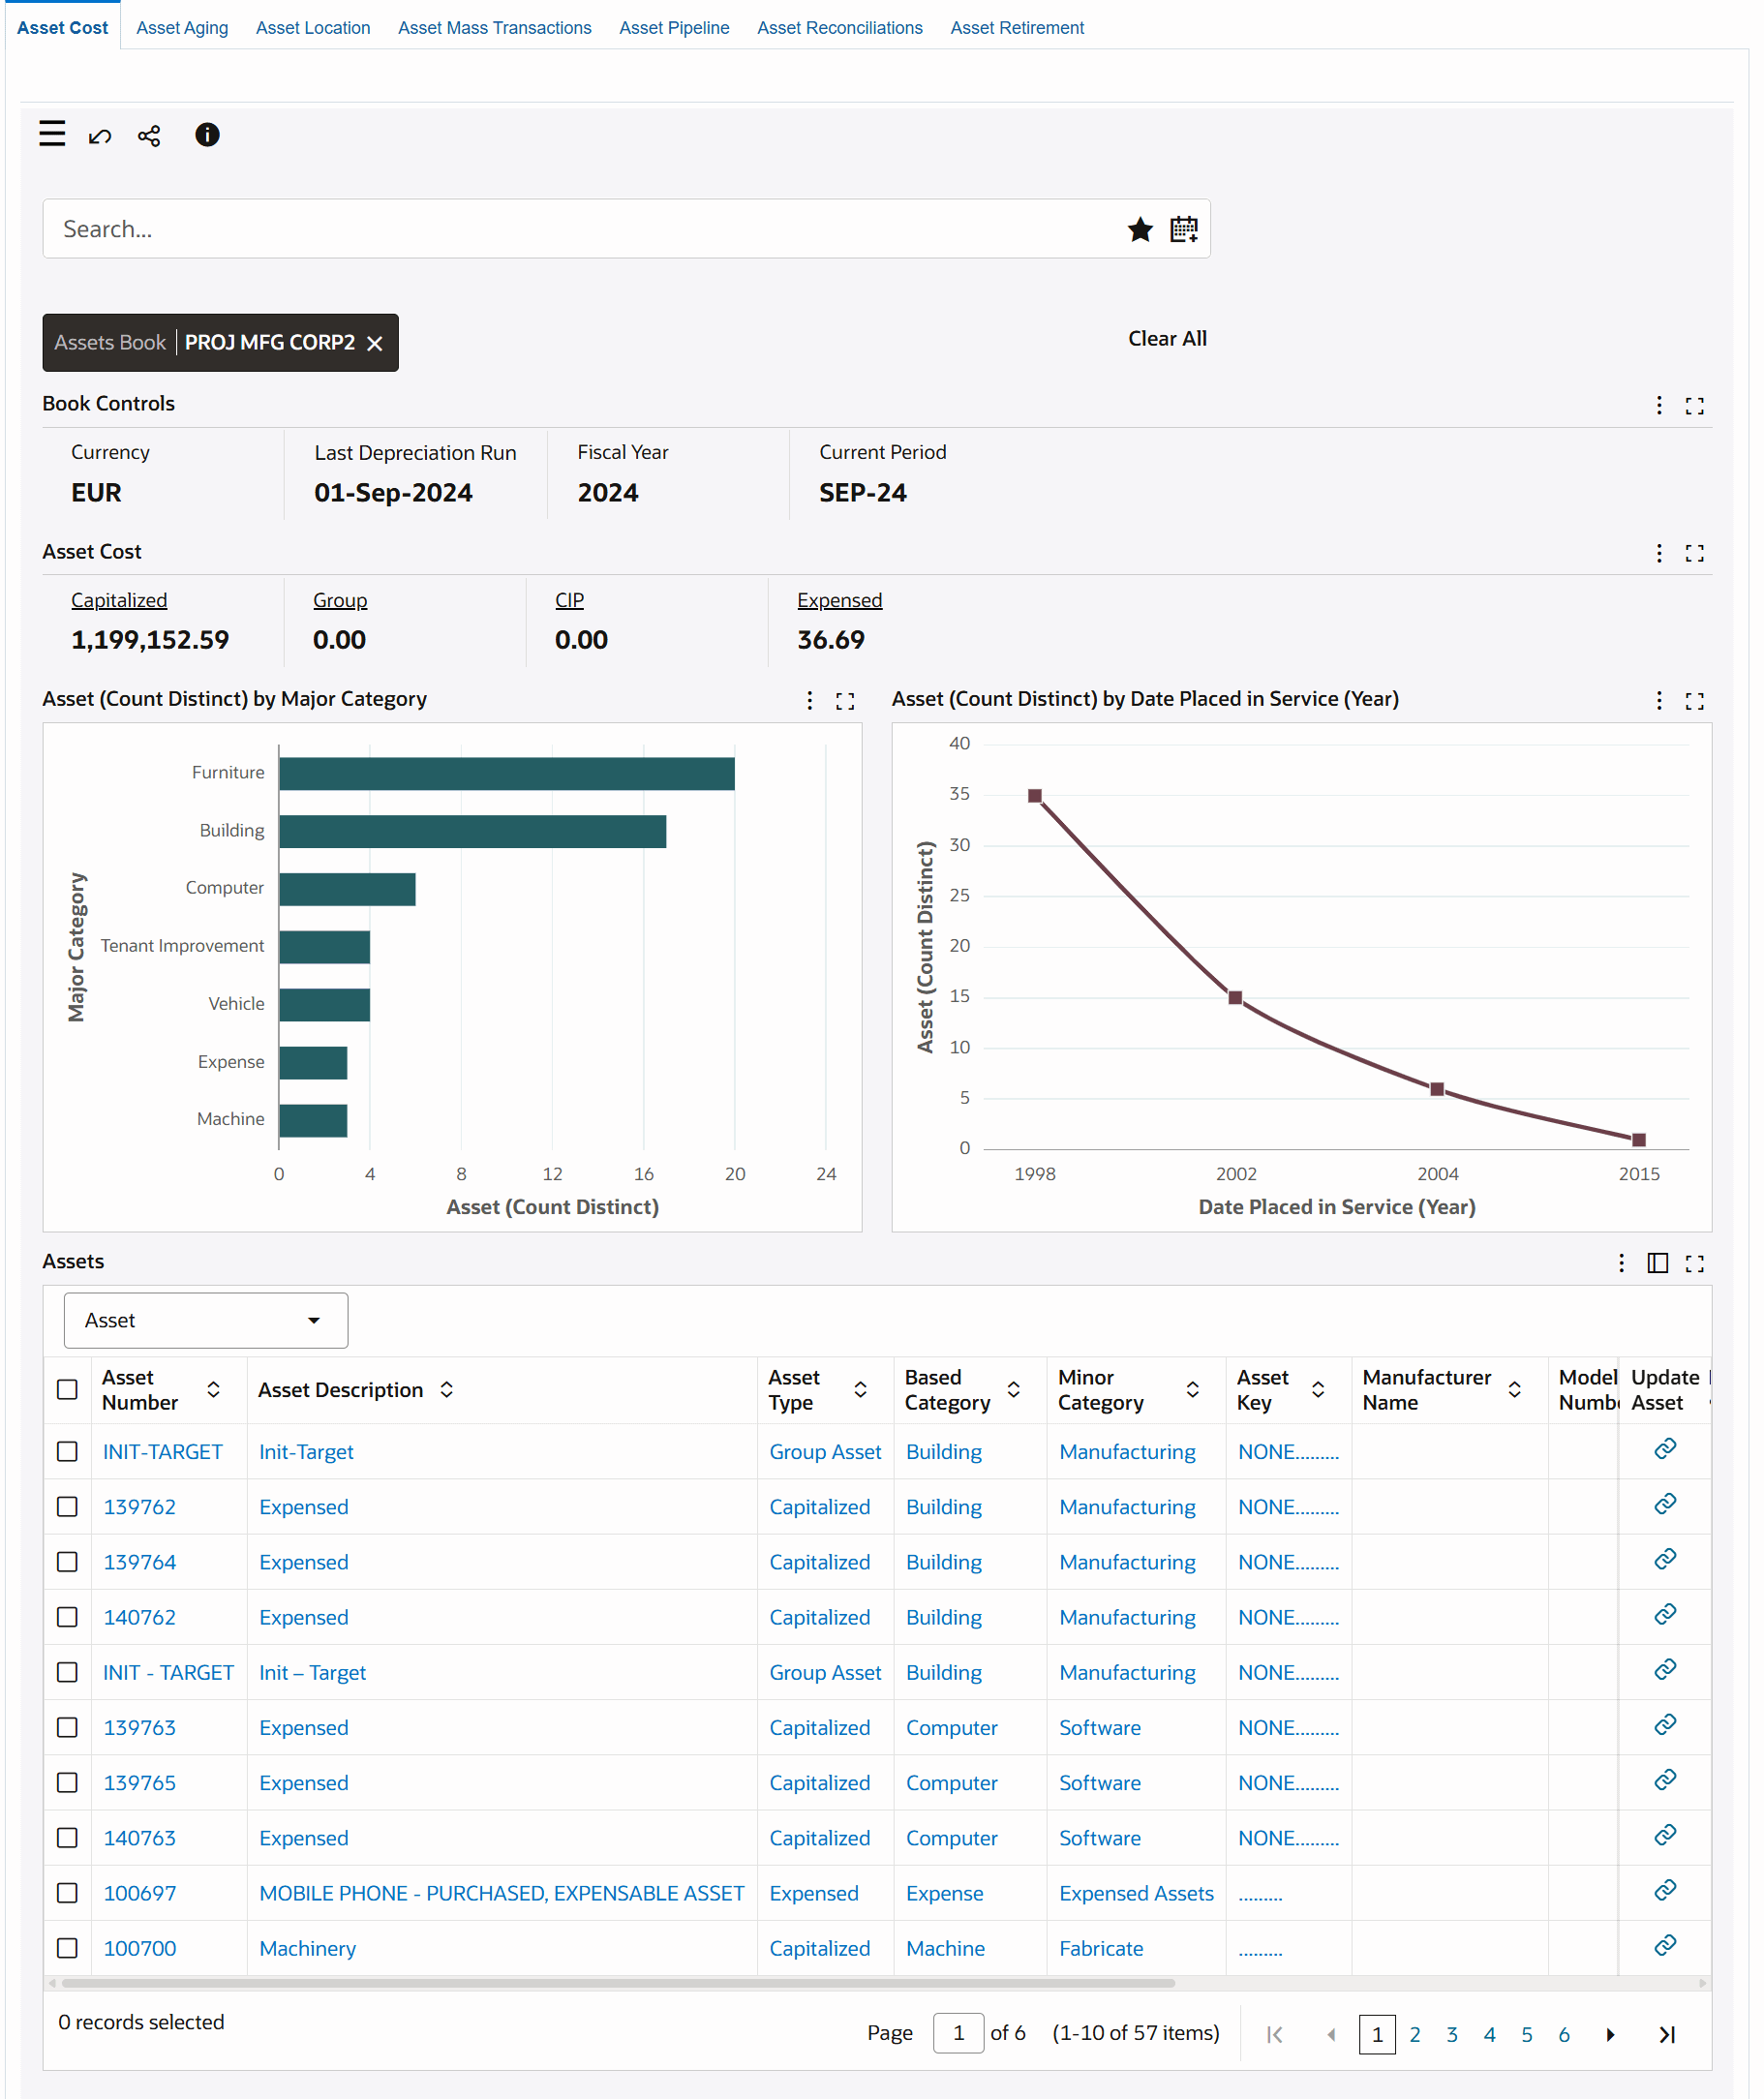
The following table describes the dashboard:
| Component | Description |
|---|---|
| Assets Book (filter chip) | The Assets Book filter displays the asset book that you can access. If you have access to multiple books, then select a book type to view data within the context of the selected asset book. The Assets Book list displays the asset books that you can access with the asset count for each book. |
| Book Controls (summary bar) | This summary bar provides the following information:
|
| Asset Cost (summary bar) | This summary bar displays the total asset cost by asset type for the following metrics:
Note: All items are configured to calculate the total asset's count by asset type. |
| Asset (Count Distinct) by Major Category (chart) | This chart displays asset cost across major and minor categories. The chart dynamically displays the Category flexfield value set descriptions as y-axis labels. For example, Major Category and Minor Category. From a major category, you can drill down to the minor category to view the asset count for that minor category. To filter data, select attributes from the following Available Refinements:
|
| Asset (Count Distinct) by Date Placed in Service (Year) (chart) | This line chart displays the number of assets placed in service by year, month, and day. |
| Assets (results table) | This table provides asset financial information. Select the following options to view specific asset details:
To update asset details, click the link icon in the Update Asset column to navigate to the Assets window. |
| Options (table-level actions) | Export: Use this action to export the search results in a comma-separated values (CSV) file format. |
Asset Aging Dashboard
See Assets Command Center Overview.
The Asset Aging dashboard displays aging assets and useful asset life information by category. You can view asset aging metrics, charts, and results tables.
Use the Asset Aging dashboard to:
-
Analyze asset remaining life.
-
Verify asset cost, depreciated, and net book value.
-
Take action to submit a work request or a new purchase requisition, or perform mass retirement.
From the Fixed Assets Manager responsibility, navigate to the Asset Aging dashboard:
(N) Assets Command Center > Asset Aging
Asset Aging Dashboard
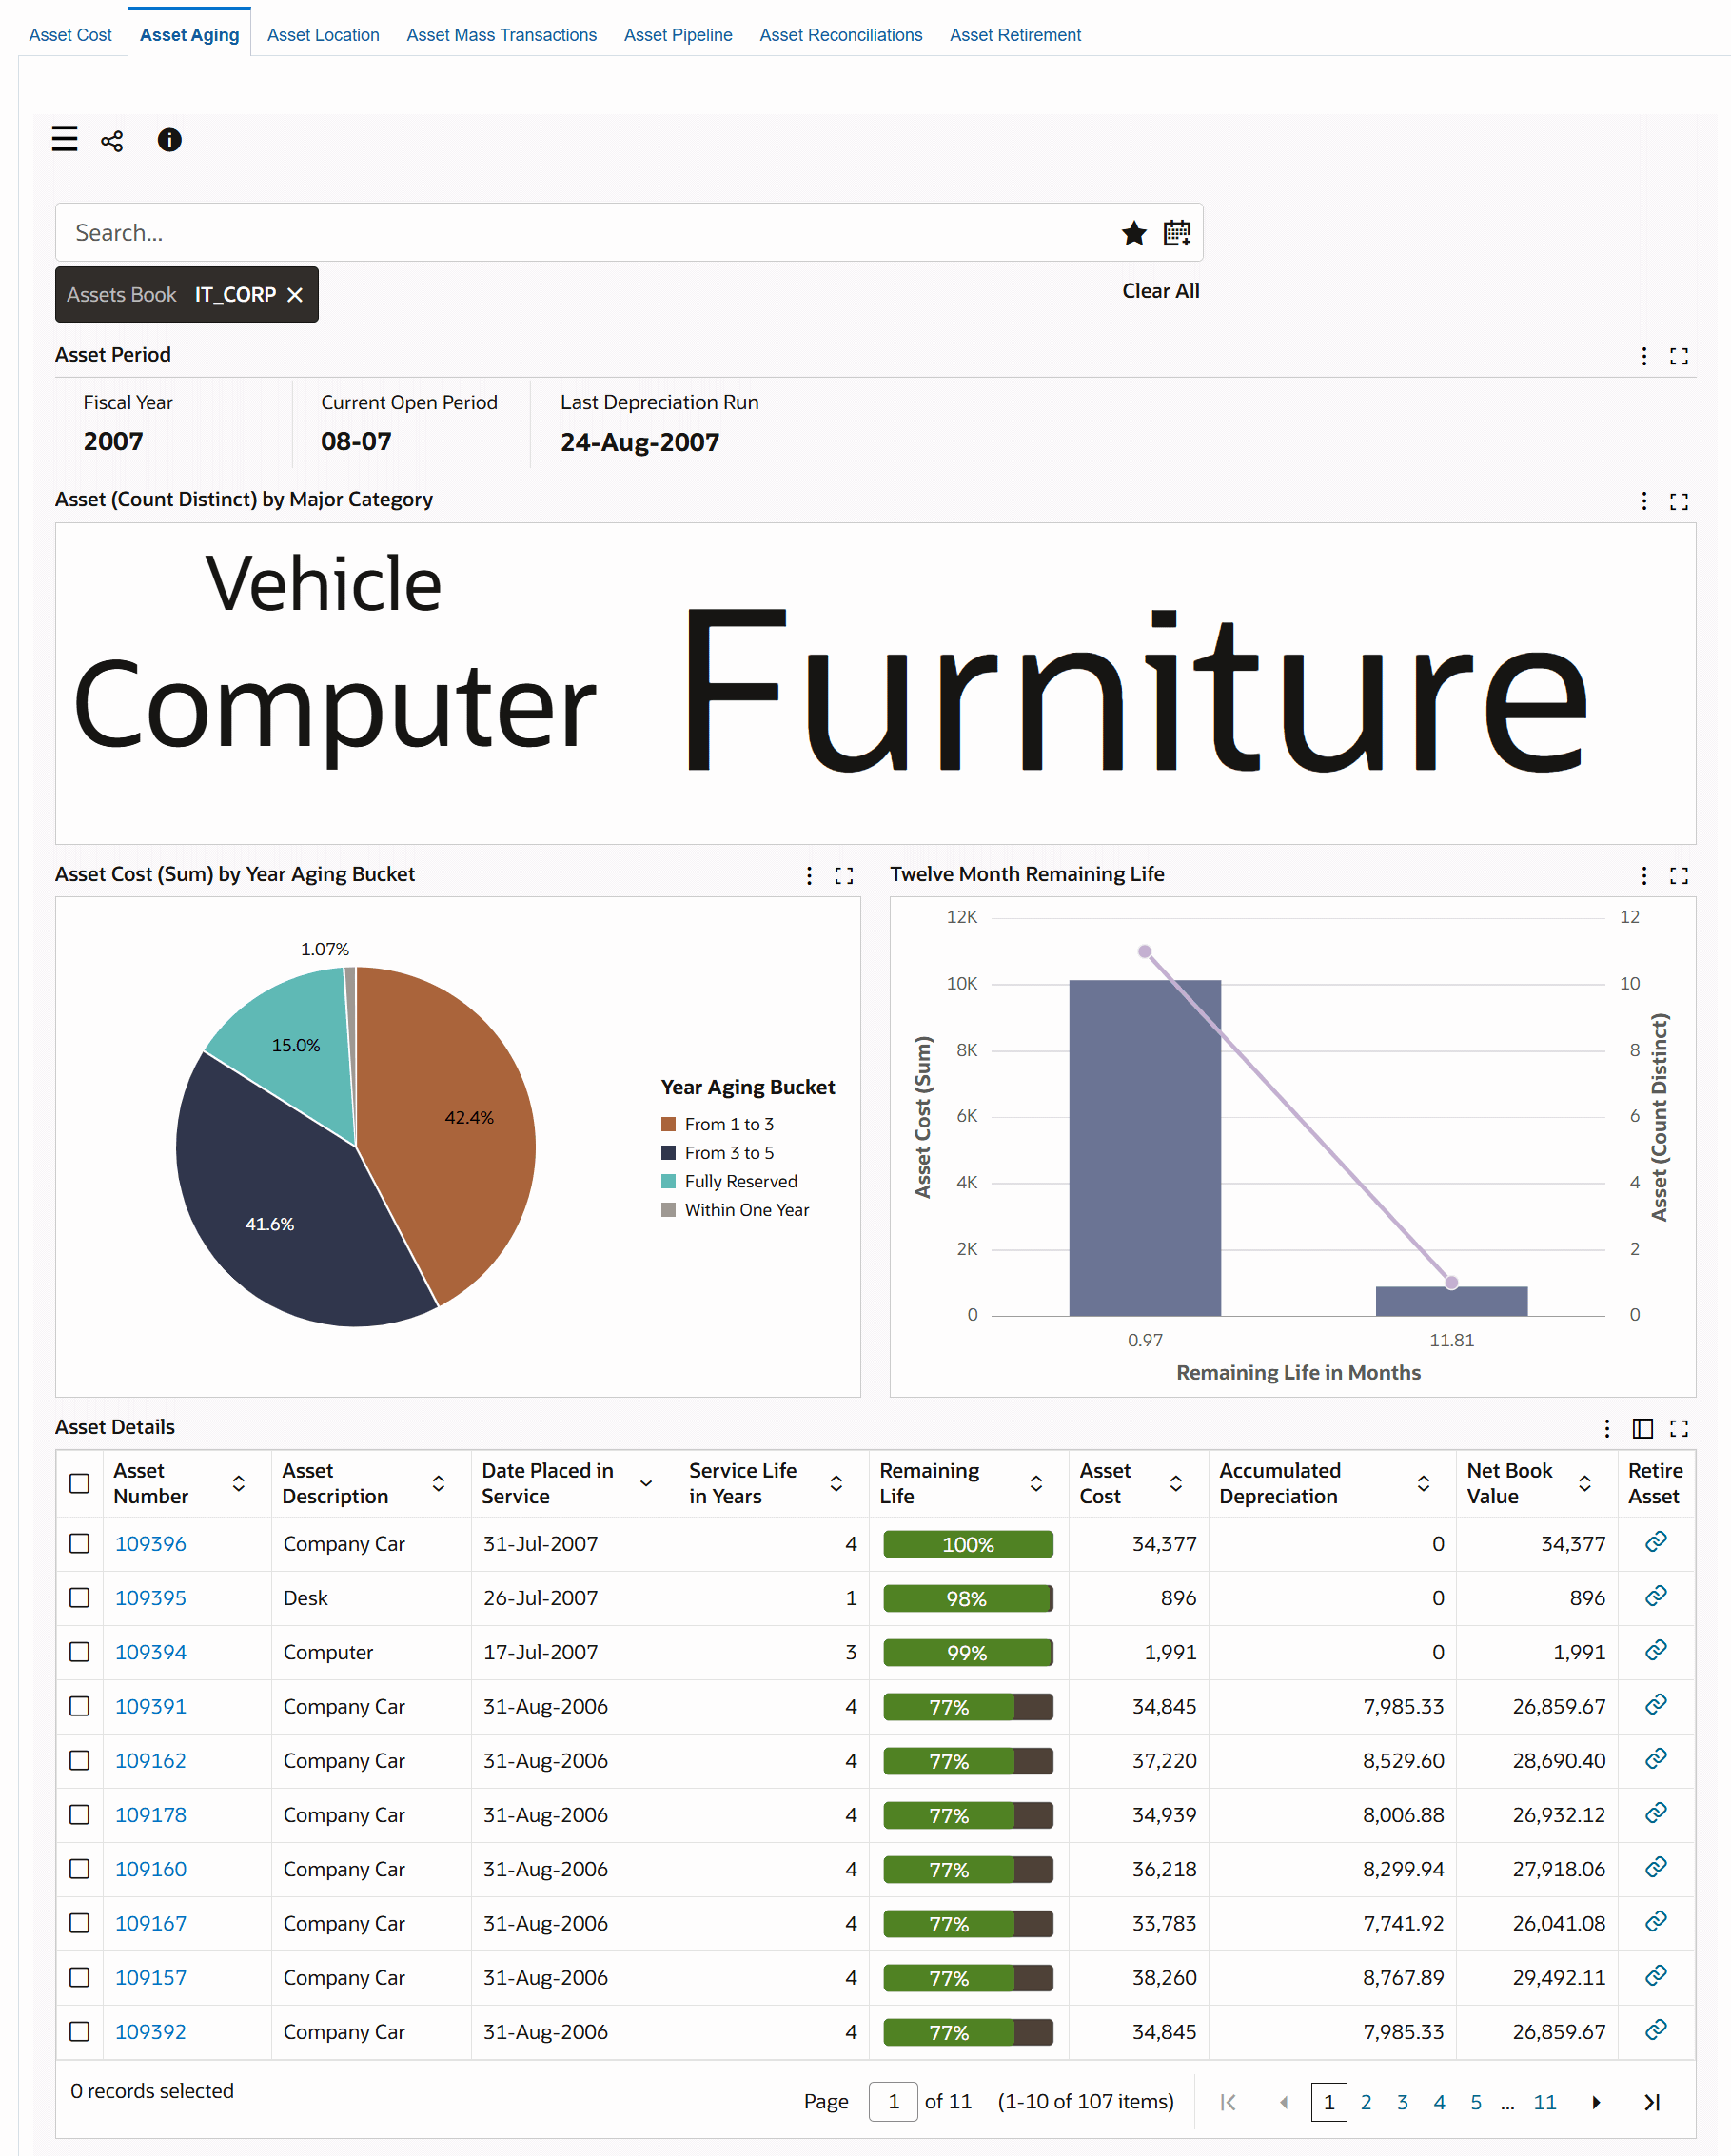
The following table describes the dashboard:
| Component | Description |
|---|---|
| Assets Book (filter chip) | The Assets Book filter displays the asset book that you can access. If you have access to multiple books, then select a book type to view data within the context of the selected asset book. The Assets Book list displays the asset books that you can access with the asset count for each book. |
| Asset Period (summary bar) | This summary bar provides the following information:
|
| Asset (Count Distinct) by Major Category (tag cloud) | This tag cloud component displays the major and minor asset categories by remaining life. The categories are displayed in relative sizes by frequency of occurrence. The tag cloud dynamically displays the Category flexfield value set descriptions as tag cloud titles, Major Category and Minor Category. From a major category, you can drill down to the minor category to view the asset count for that minor category. |
| Asset Cost (Sum) by Year Aging Bucket (chart) | This chart displays the aging buckets for assets (in years) and drills down to month aging. |
| Twelve Month Remaining Life (chart) | This chart displays the count and the cost of assets that will complete their life within a year (asset life due in a year). |
| Asset Details (results table) | This table displays financial information for an asset's useful life. To update asset details, click the link icon in the Retire Asset column to navigate to the Assets window. |
| Options (table-level actions) | Export: Use this action to export the search results in a comma-separated values (CSV) file format. |
Asset Location Dashboard
See Assets Command Center Overview.
The Asset Location dashboard displays assets by location or by employees assigned to asset groups. You can view asset location metrics, charts, and results tables.
Use the Asset Location dashboard to:
-
Track fixed assets across all locations.
-
Explore assignments to employees.
-
Detect discrepancies in cost center assignments.
-
Take action to resolve missing assignments or incorrect allocation of resources.
From the Fixed Assets Manager responsibility, navigate to the Asset Location dashboard:
(N) Assets Command Center > Asset Location
Within the Asset Location dashboard, you can select the ledger and asset book to check the location or assignment of a specific asset or group of assets. You can analyze data using asset location metrics, charts, graphs, and results tables.
Asset Location Dashboard
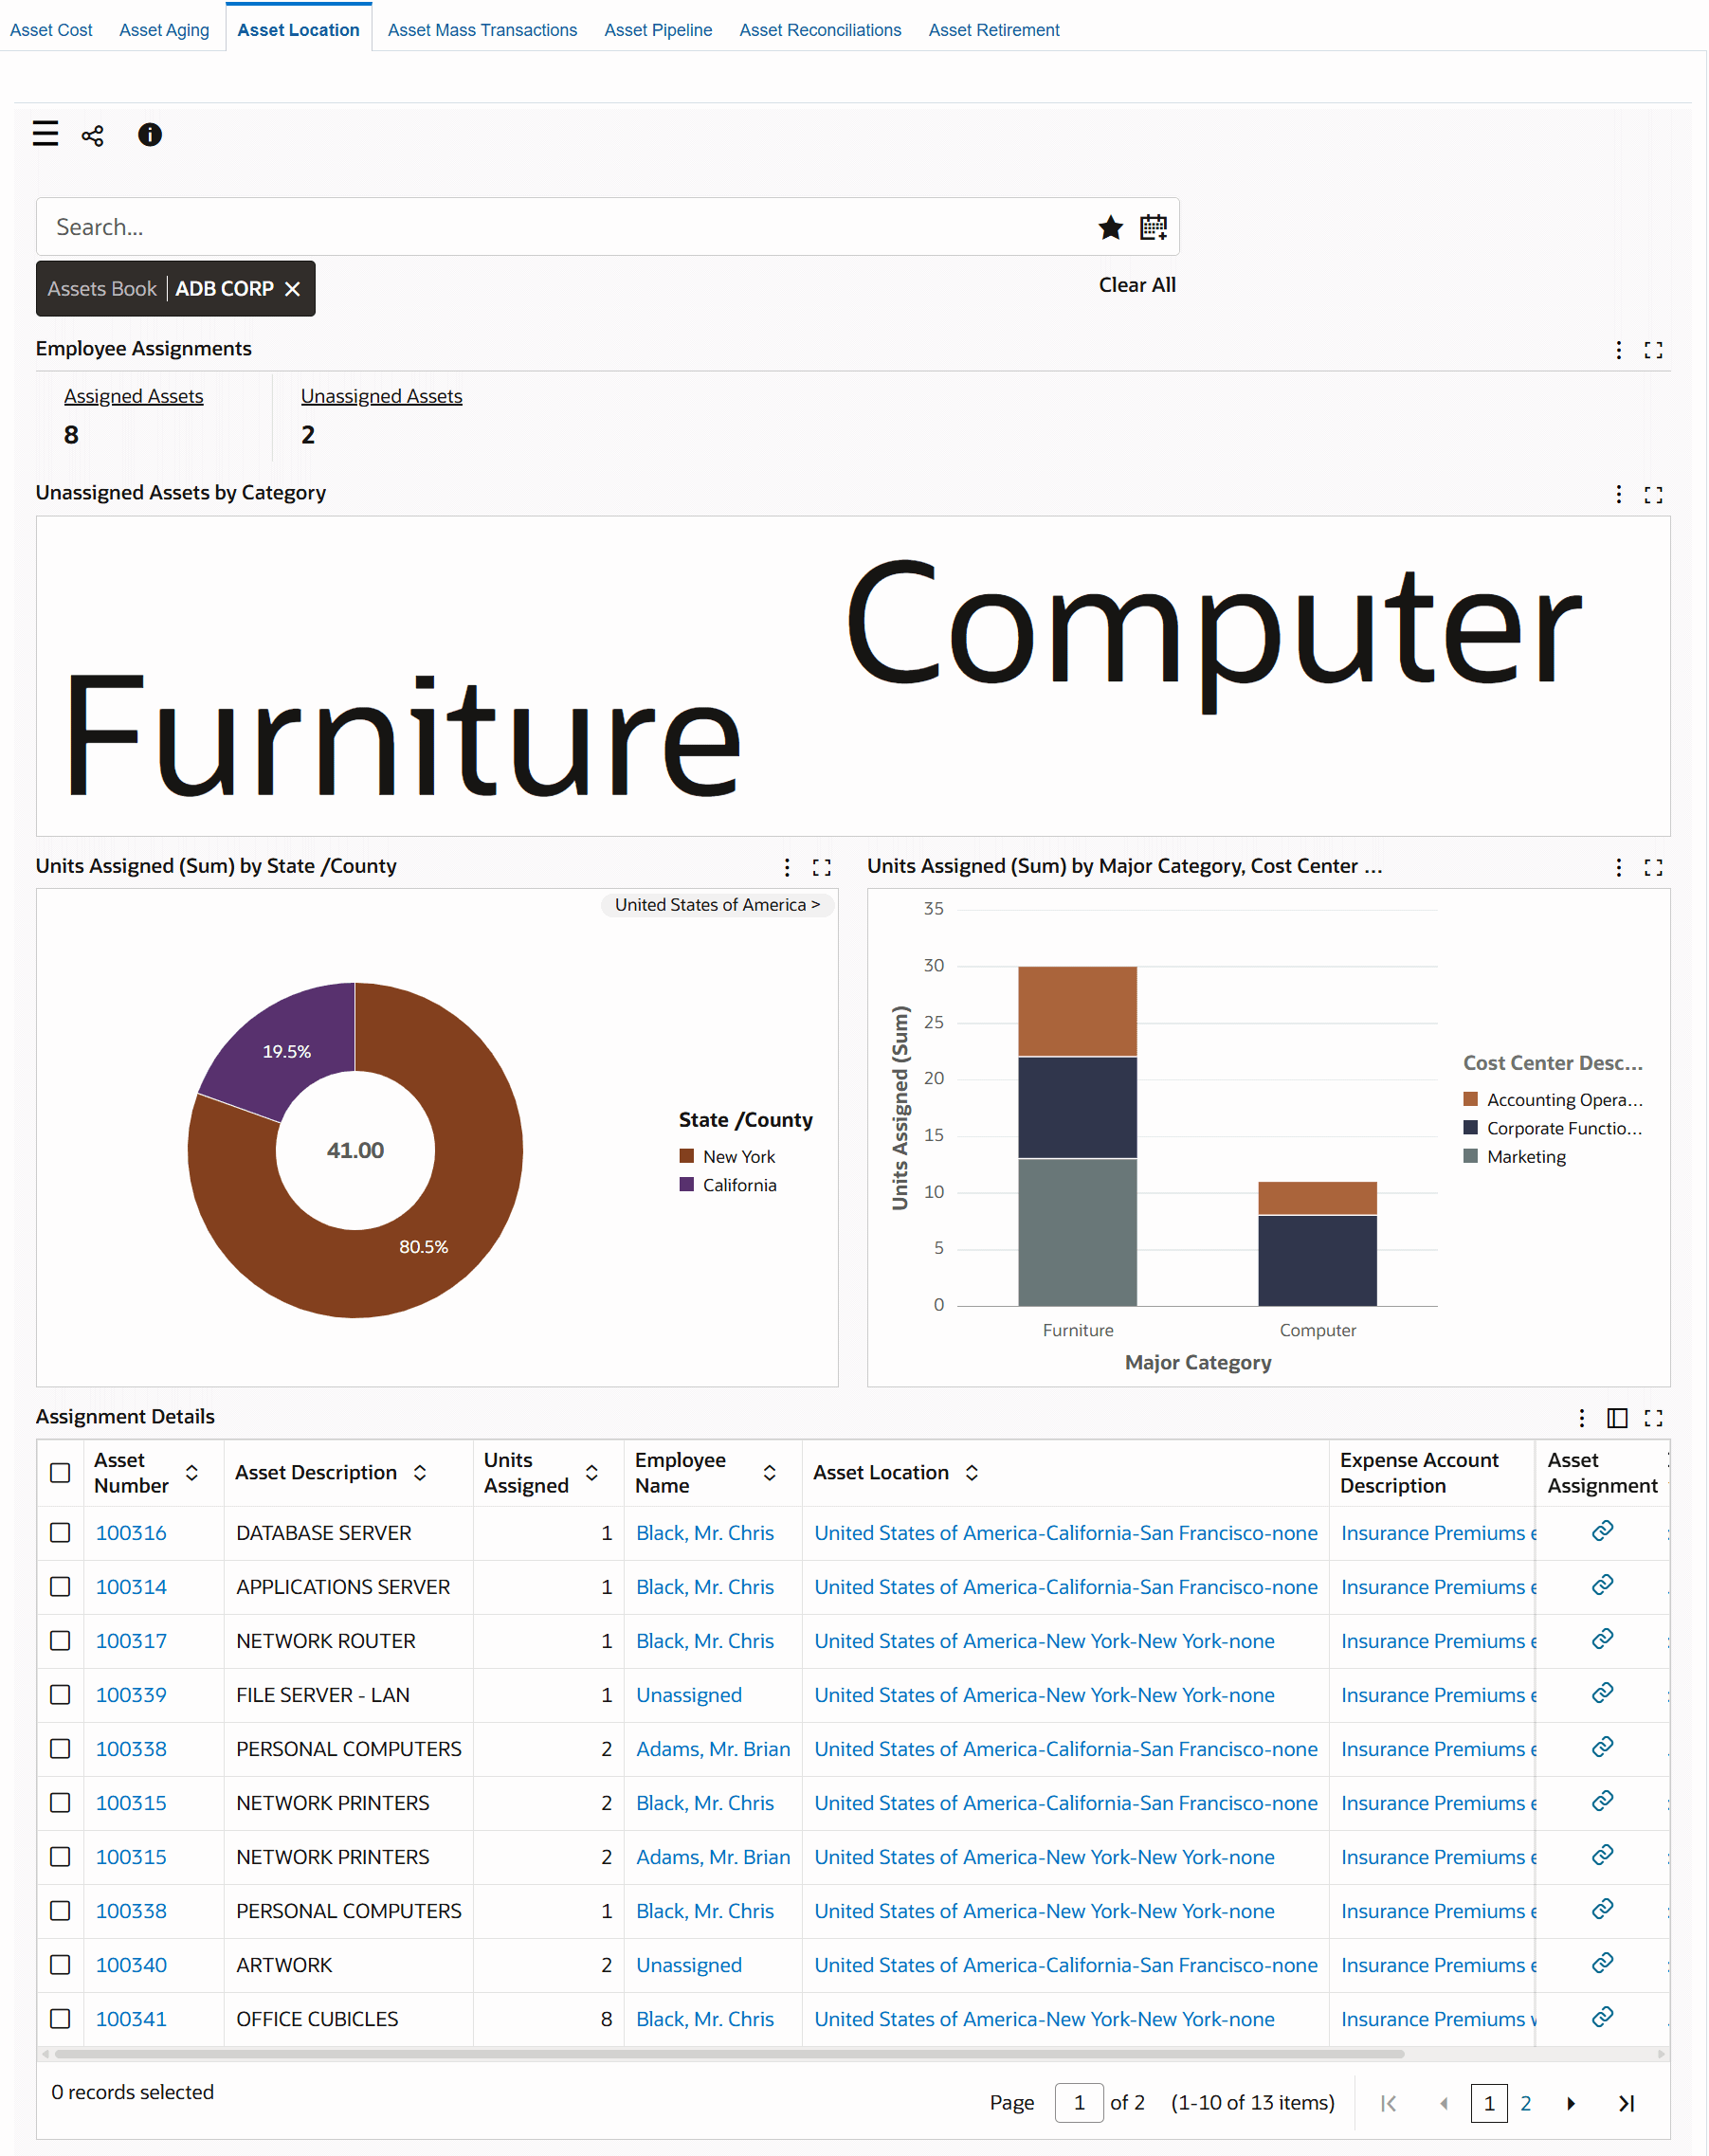
The following tables describe the dashboard:
| Component | Description |
|---|---|
| Assets Book (filter chip) | The Assets Book filter displays the asset book that you can access. If you have access to multiple books, then select a book type to view data within the context of the selected asset book. The Assets Book list displays the asset books that you can access with the asset count for each book. |
| Employee Assignments (summary bar) | This summary bar displays the number of assigned assets and unassigned assets to employees, and contains the following metrics:
|
| Unassigned Assets by Category (tag cloud) | This tag cloud component displays the top unassigned assets by major category. You can drill down from the major category to the minor category by selecting a value within the tag cloud. |
| Units Assigned (Sum) by Location Segment (chart) | This chart displays asset count by location segments. The pie chart dynamically displays the Location flexfield value set descriptions as pie chart labels and presents data using the location hierarchy. For example, if Loc Segment 1, Loc Segment 2, and Loc Segment 3 are defined as Country, State, and City respectively, then correspondingly the chart title is shown as Units Assigned by Country, Units Assigned by State, or Units Assigned by City. You can drill down from the highest location level to the lowest location level to view complete details for a location. For example, from country, to state, and then to city or county location. |
| Units Assigned (Sum) by Category, Cost Center Description (chart) | This chart displays the asset count by major category and by cost center. Click a major category to further drill down into minor category details. |
| Assignment Details (results table) | This table displays details related to assigned and unassigned assets. You can perform the following row-level actions:
|
| Options (table-level actions) | Export: Use this action to export the search results in a comma-separated values (CSV) file format. |
Asset Mass Transactions Dashboard
See Assets Command Center Overview.
The Asset Mass Transactions dashboard helps fixed assets accountants to find pending transactions and take required actions. You can view pending transaction metrics, charts, and results tables.
Use the Asset Mass Transactions dashboard to:
-
Explore pending transactions across mass additions and transactions.
-
Reflect pending transactions accurately and in a timely fashion.
-
Take action to close asset books.
From the Fixed Assets Manager responsibility, navigate to the Asset Mass Transactions dashboard:
(N) Assets Command Center > Asset Mass Transactions
Asset Mass Transactions Dashboard
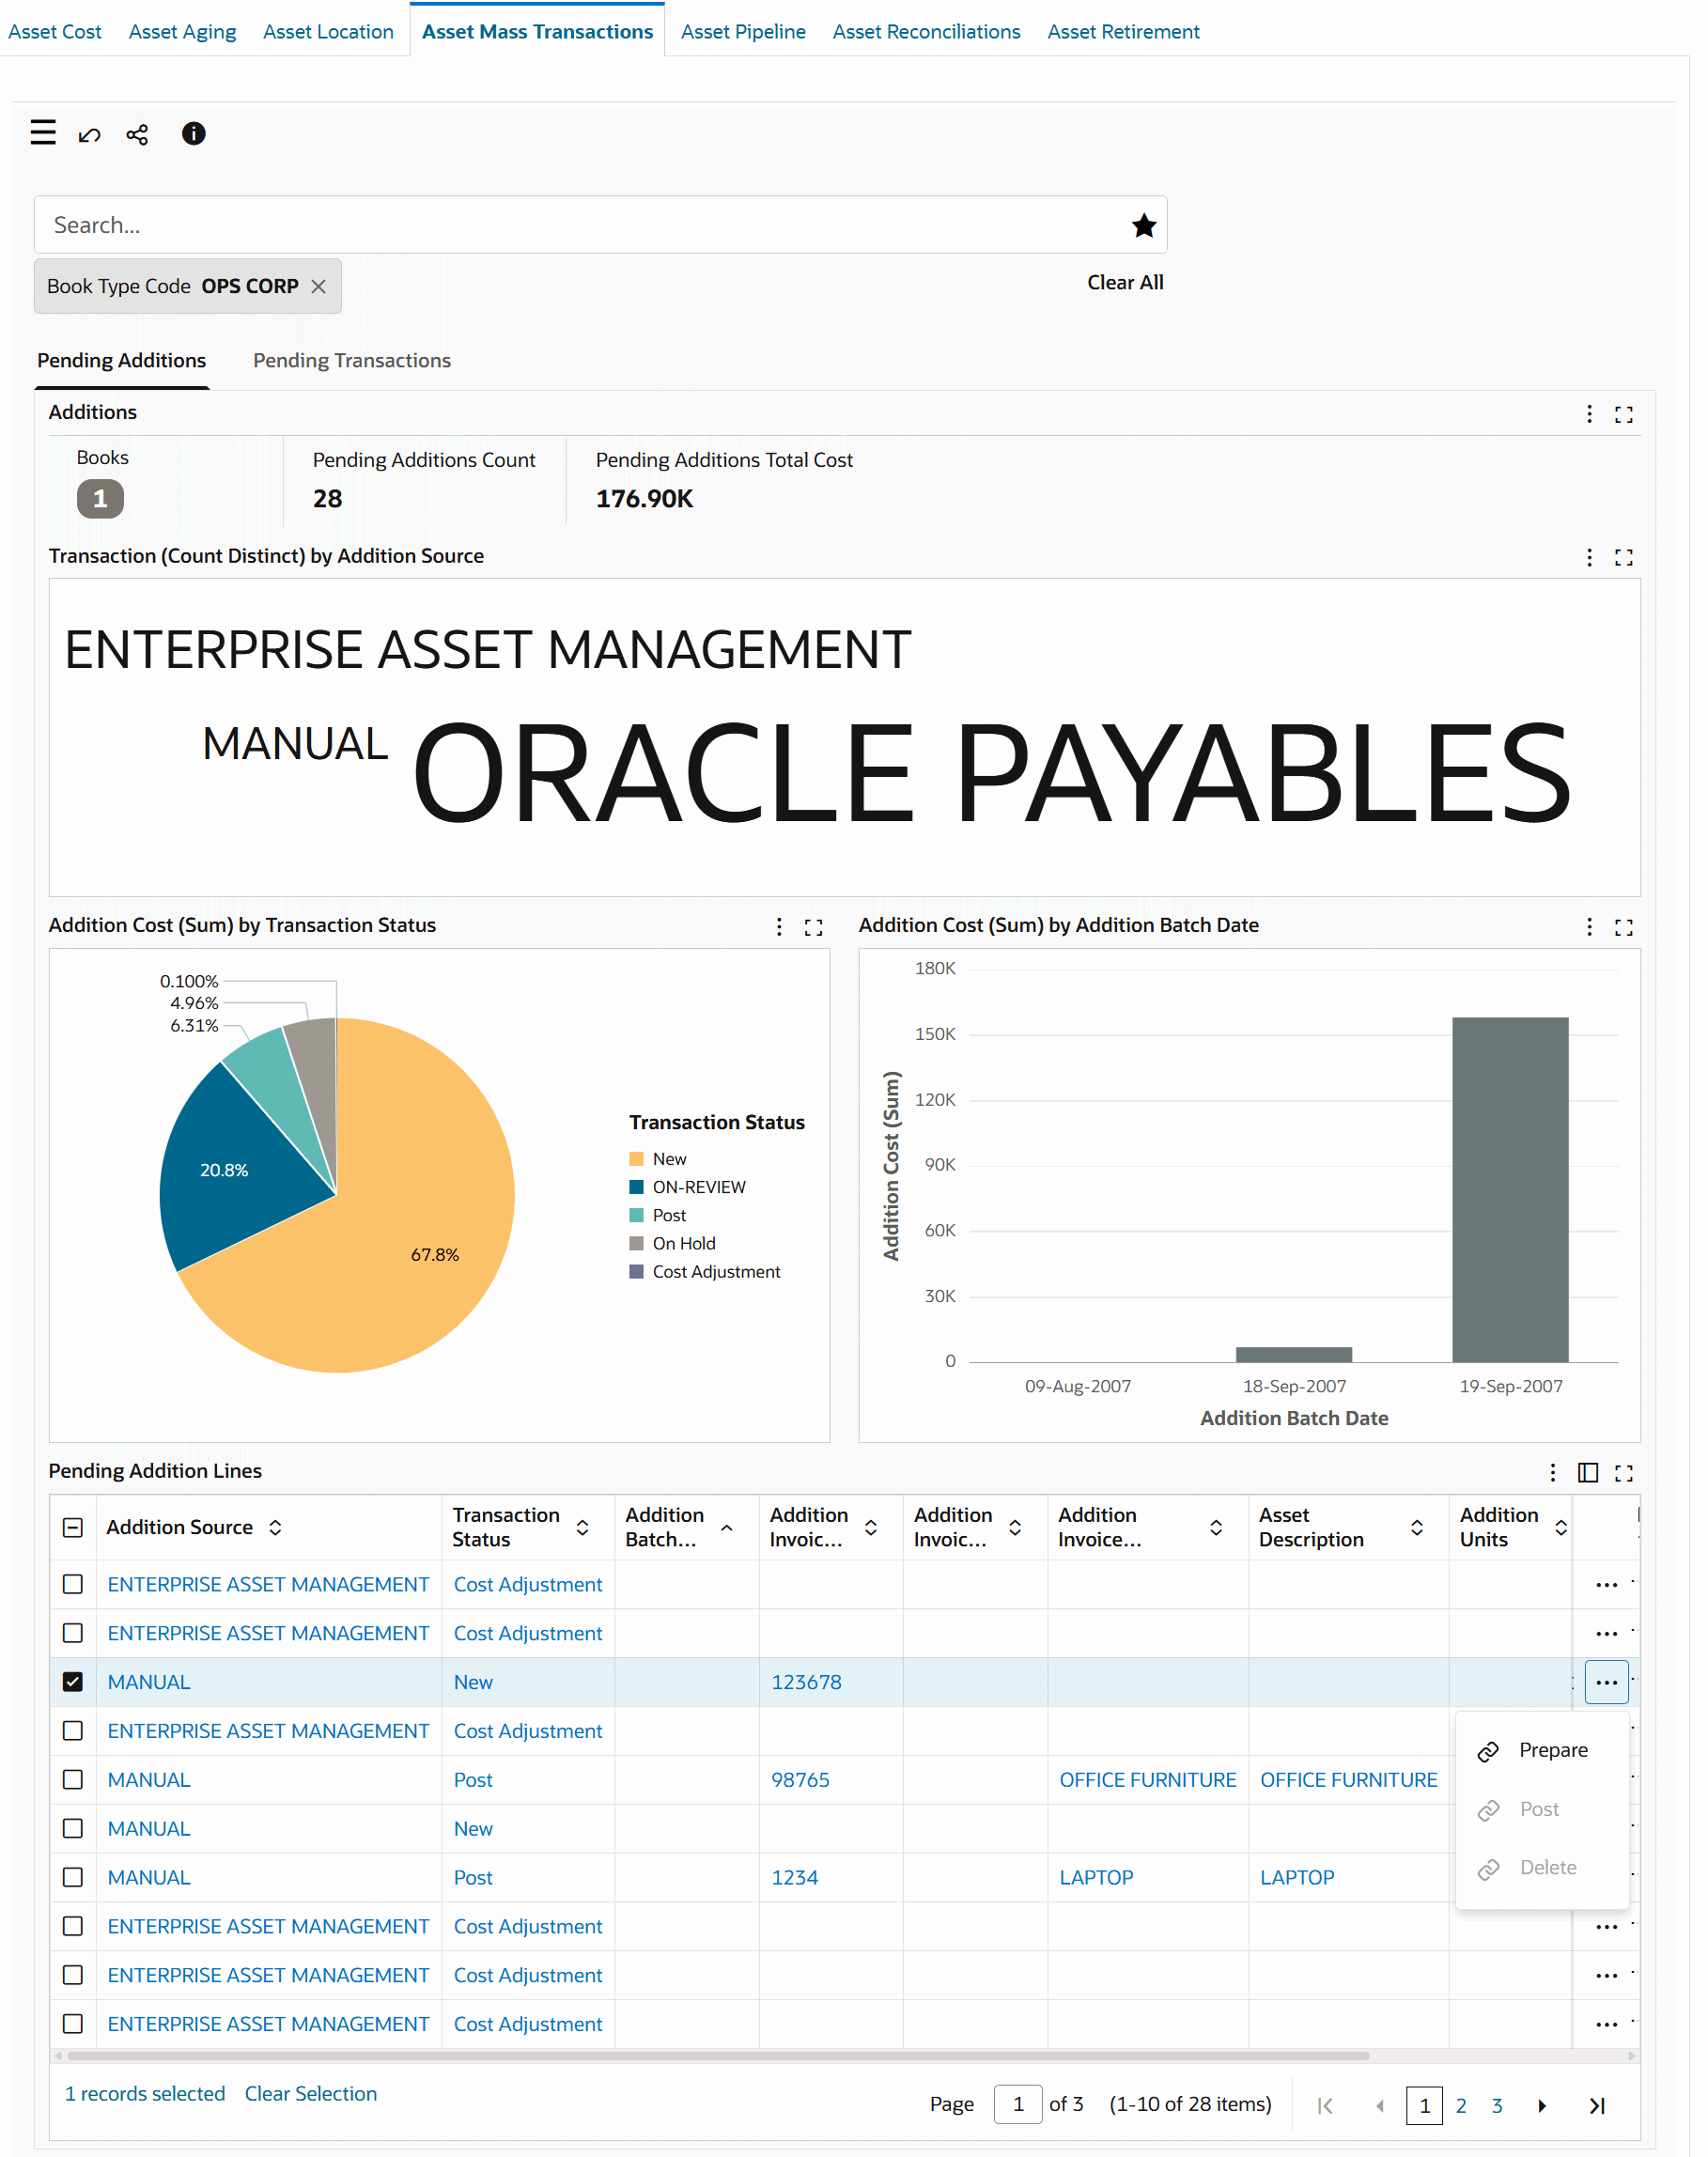
The following tables describe the dashboard:
| Component | Description |
|---|---|
| Additions (summary bar) | This summary bar displays the following metrics:
|
| Transaction (Count Distinct) by Addition Source (tag cloud) | This tag cloud component displays the top pending mass additions status by category. The categories are displayed in relative sizes by frequency of occurrence. |
| Addition Cost (Sum) by Transaction Status (chart) | This chart displays the total sum of the asset cost for each status type. |
| Addition Cost (Sum) by Addition Batch Date (chart) | This chart displays both the number and the total cost of the pending additions per mass additions batch date. |
| Pending Addition Lines (results table) | This table displays pending addition details. To perform the following actions, click the row-level Actions icon and select an action.
|
| Component | Description |
|---|---|
| Pending Mass Transactions (summary bar) | This summary bar displays the following metrics:
|
| Transaction (Count Distinct) by Transaction Type (chart) | This chart displays the number of pending transactions for each transaction type. |
| Transaction (Count Distinct) by Transaction Status, Transaction Type (chart) | This chart displays the number of pending transactions for each transaction type and transaction status. |
| Pending Transaction Details (results table) | This table displays pending mass transaction details. To perform the following actions, click the row-level Actions icon and select an action.
|
| Options (table-level actions) | Export: Use this action to export the search results in a comma-separated values (CSV) file format. |
Asset Pipeline Dashboard
See Assets Command Center Overview.
The Asset Pipeline dashboard identifies all pending transactions that exist in Oracle Payables and Oracle Projects that affect asset costs.
Use the Asset Pipeline dashboard to identify:
-
Ledger details that include ledger name, operating unit, functional currency, and count of pending invoices and projects.
-
Total pending additions by account description.
-
Total amounts.
-
Additions pipeline details (invoices, projects).
From the Fixed Assets Manager responsibility, navigate to the Asset Pipeline dashboard:
(N) Assets Command Center > Asset Pipeline
Within the Asset Pipeline dashboard, you can check the additions pipeline using metrics, graphs, and results tables.
Asset Pipeline Dashboard
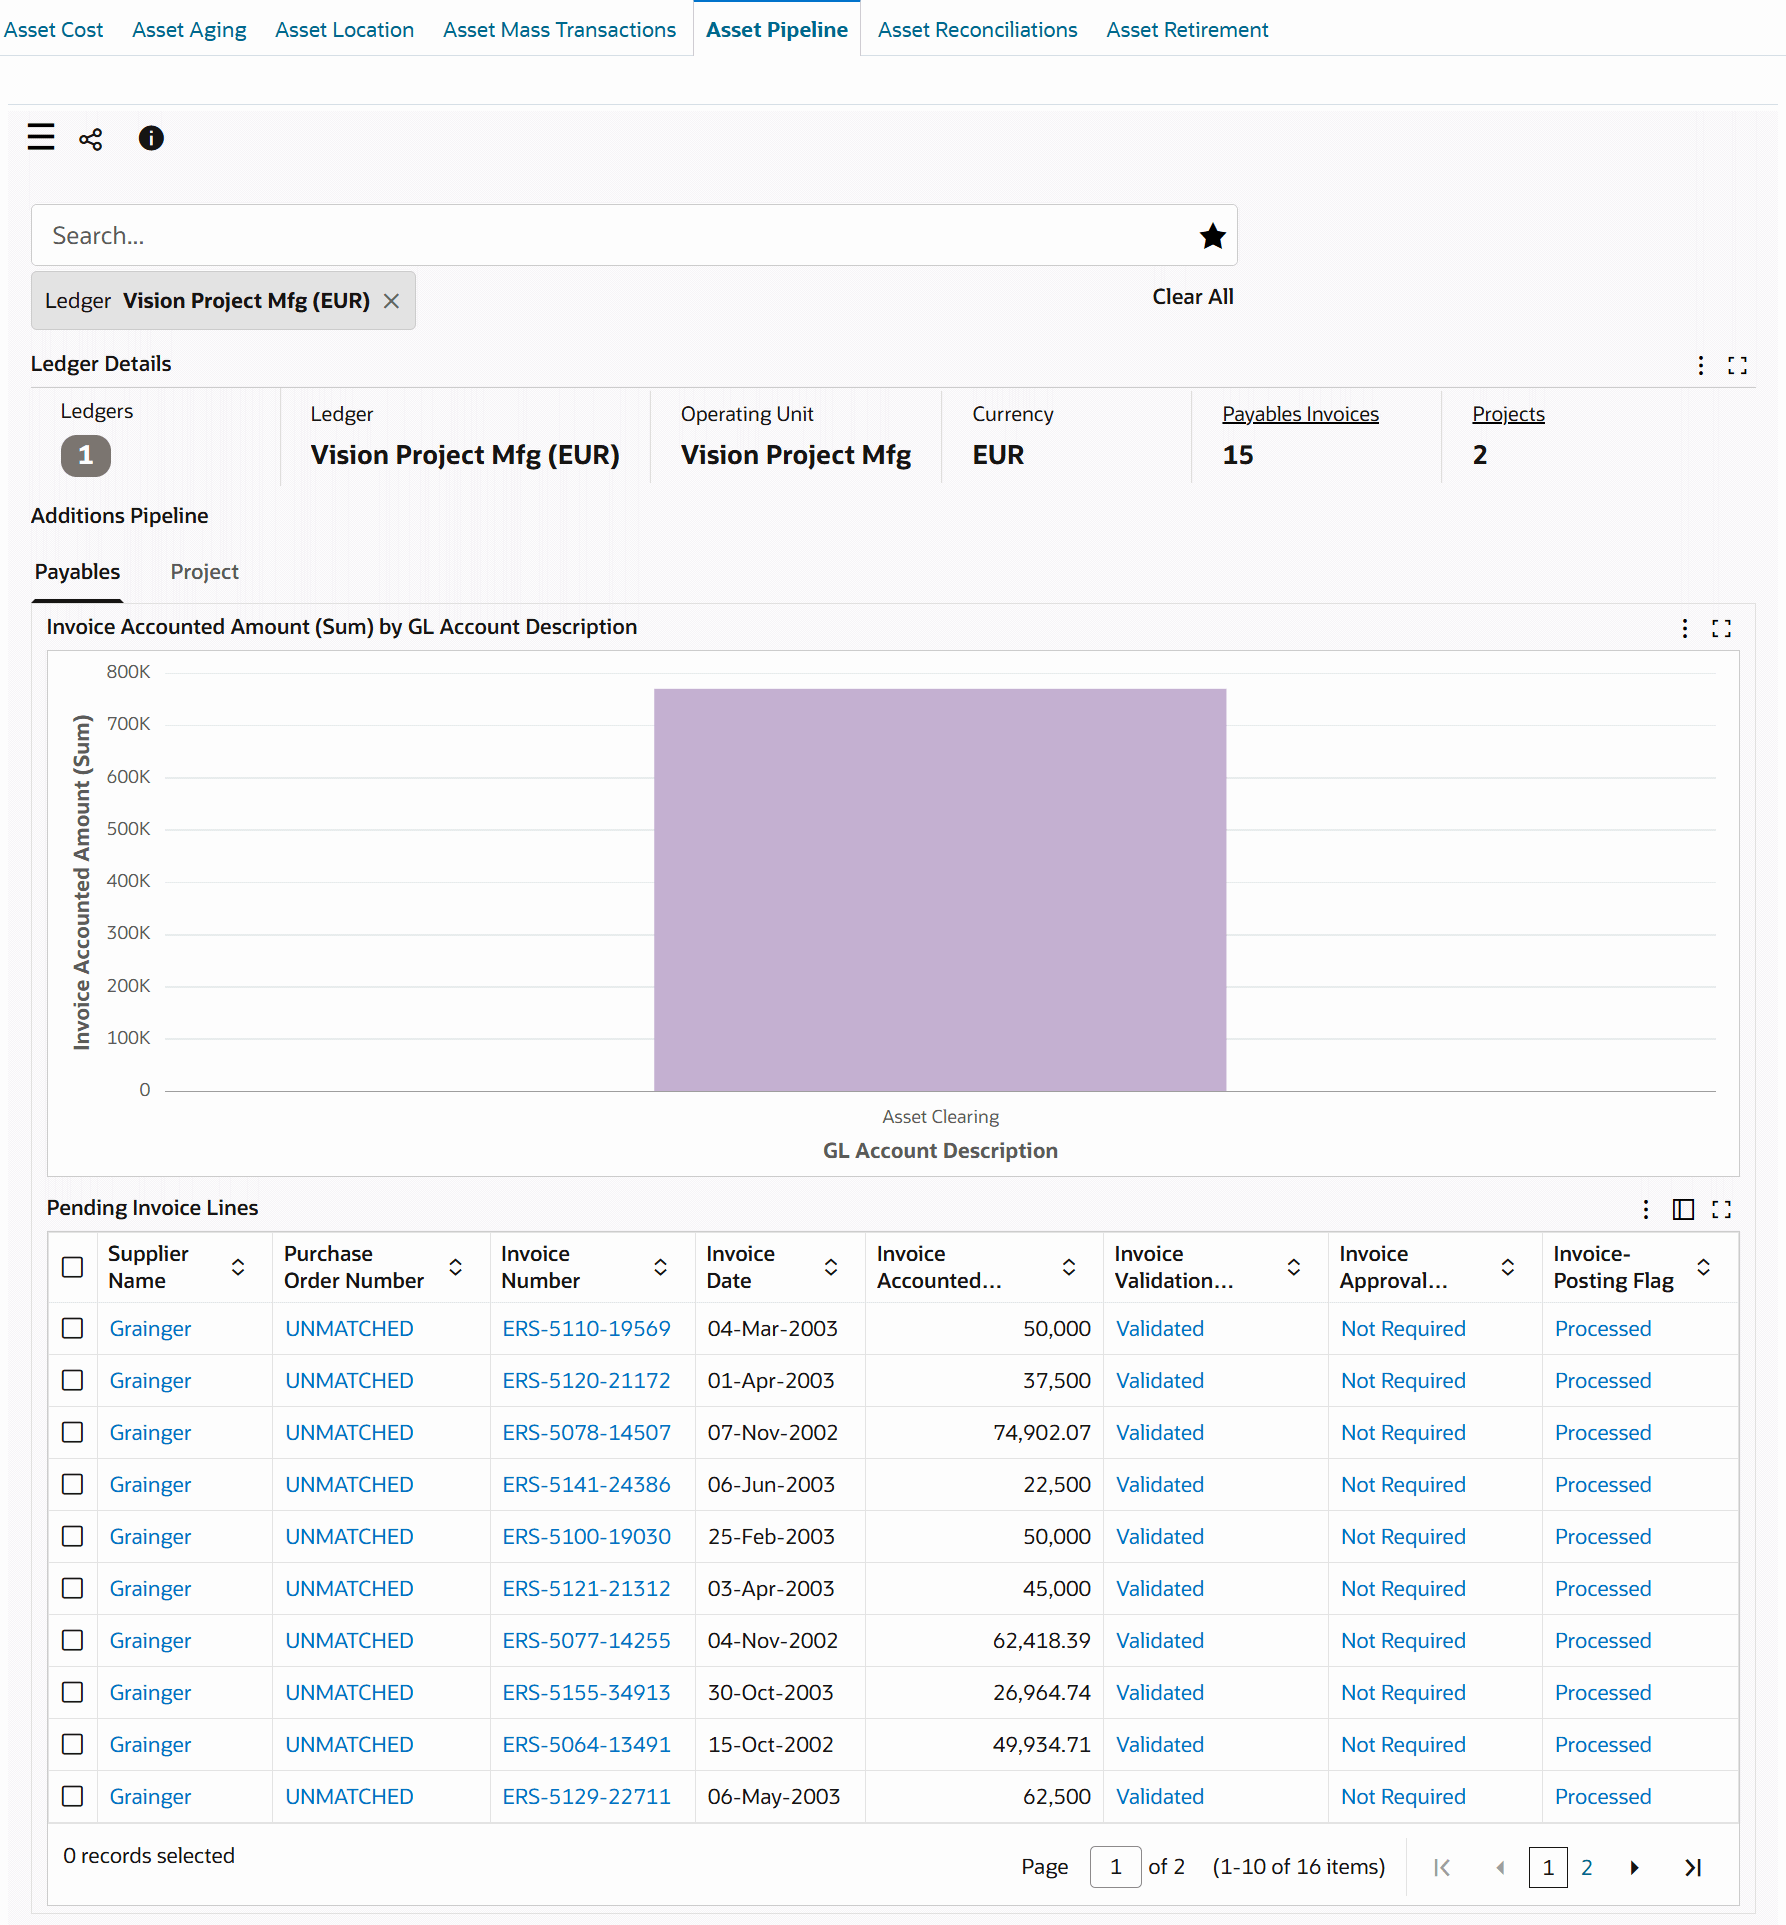
The following tables describe the dashboard:
| Component | Description |
|---|---|
| Ledger Details (summary bar) | This summary bar displays the following metrics.
|
| Component | Description |
|---|---|
| Invoice Accounted Amount (Sum) by GL Account Description (chart) | This chart displays the sum invoice accounted amount per GL account. |
| Pending Invoice Lines (results table) | This table displays payable invoice details. From Options (table-level actions), you can select Export to export the search results in a comma-separated values (CSV) file format. |
| Component | Description |
|---|---|
| Project Current Asset Cost (Sum) by Project Name, Project Task Name (chart) | This chart displays the total asset cost for each project by Project Name and Project Task Name. |
| Project Current Asset Cost (Sum) by GL Account Description (chart) | This chart displays the total asset cost for each project in a GL account. |
| Pending Project Details (results table) | This results table displays project asset lines details. From Options (table-level actions), you can select Export to export the search results in a comma-separated values (CSV) file format. |
Asset Retirement Dashboard
See Assets Command Center Overview.
The Asset Retirement dashboard provides an overview of assets that are retired in the current open period and historical periods.
Use the Asset Retirement dashboard to:
-
Gain comprehensive insight into asset retirements.
-
Track retired assets.
-
Examine asset retirement trends.
-
-
Track financial impact of each retired asset.
-
Review the financial recovery or loss on an asset retirement.
-
-
Maintain accurate records of asset retirements.
-
Use the dashboard data to evolve effective asset management strategies.
From the Fixed Assets Manager responsibility, navigate to the Asset Retirement dashboard:
(N) Assets Command Center > Asset Retirement
Asset Retirement Dashboard
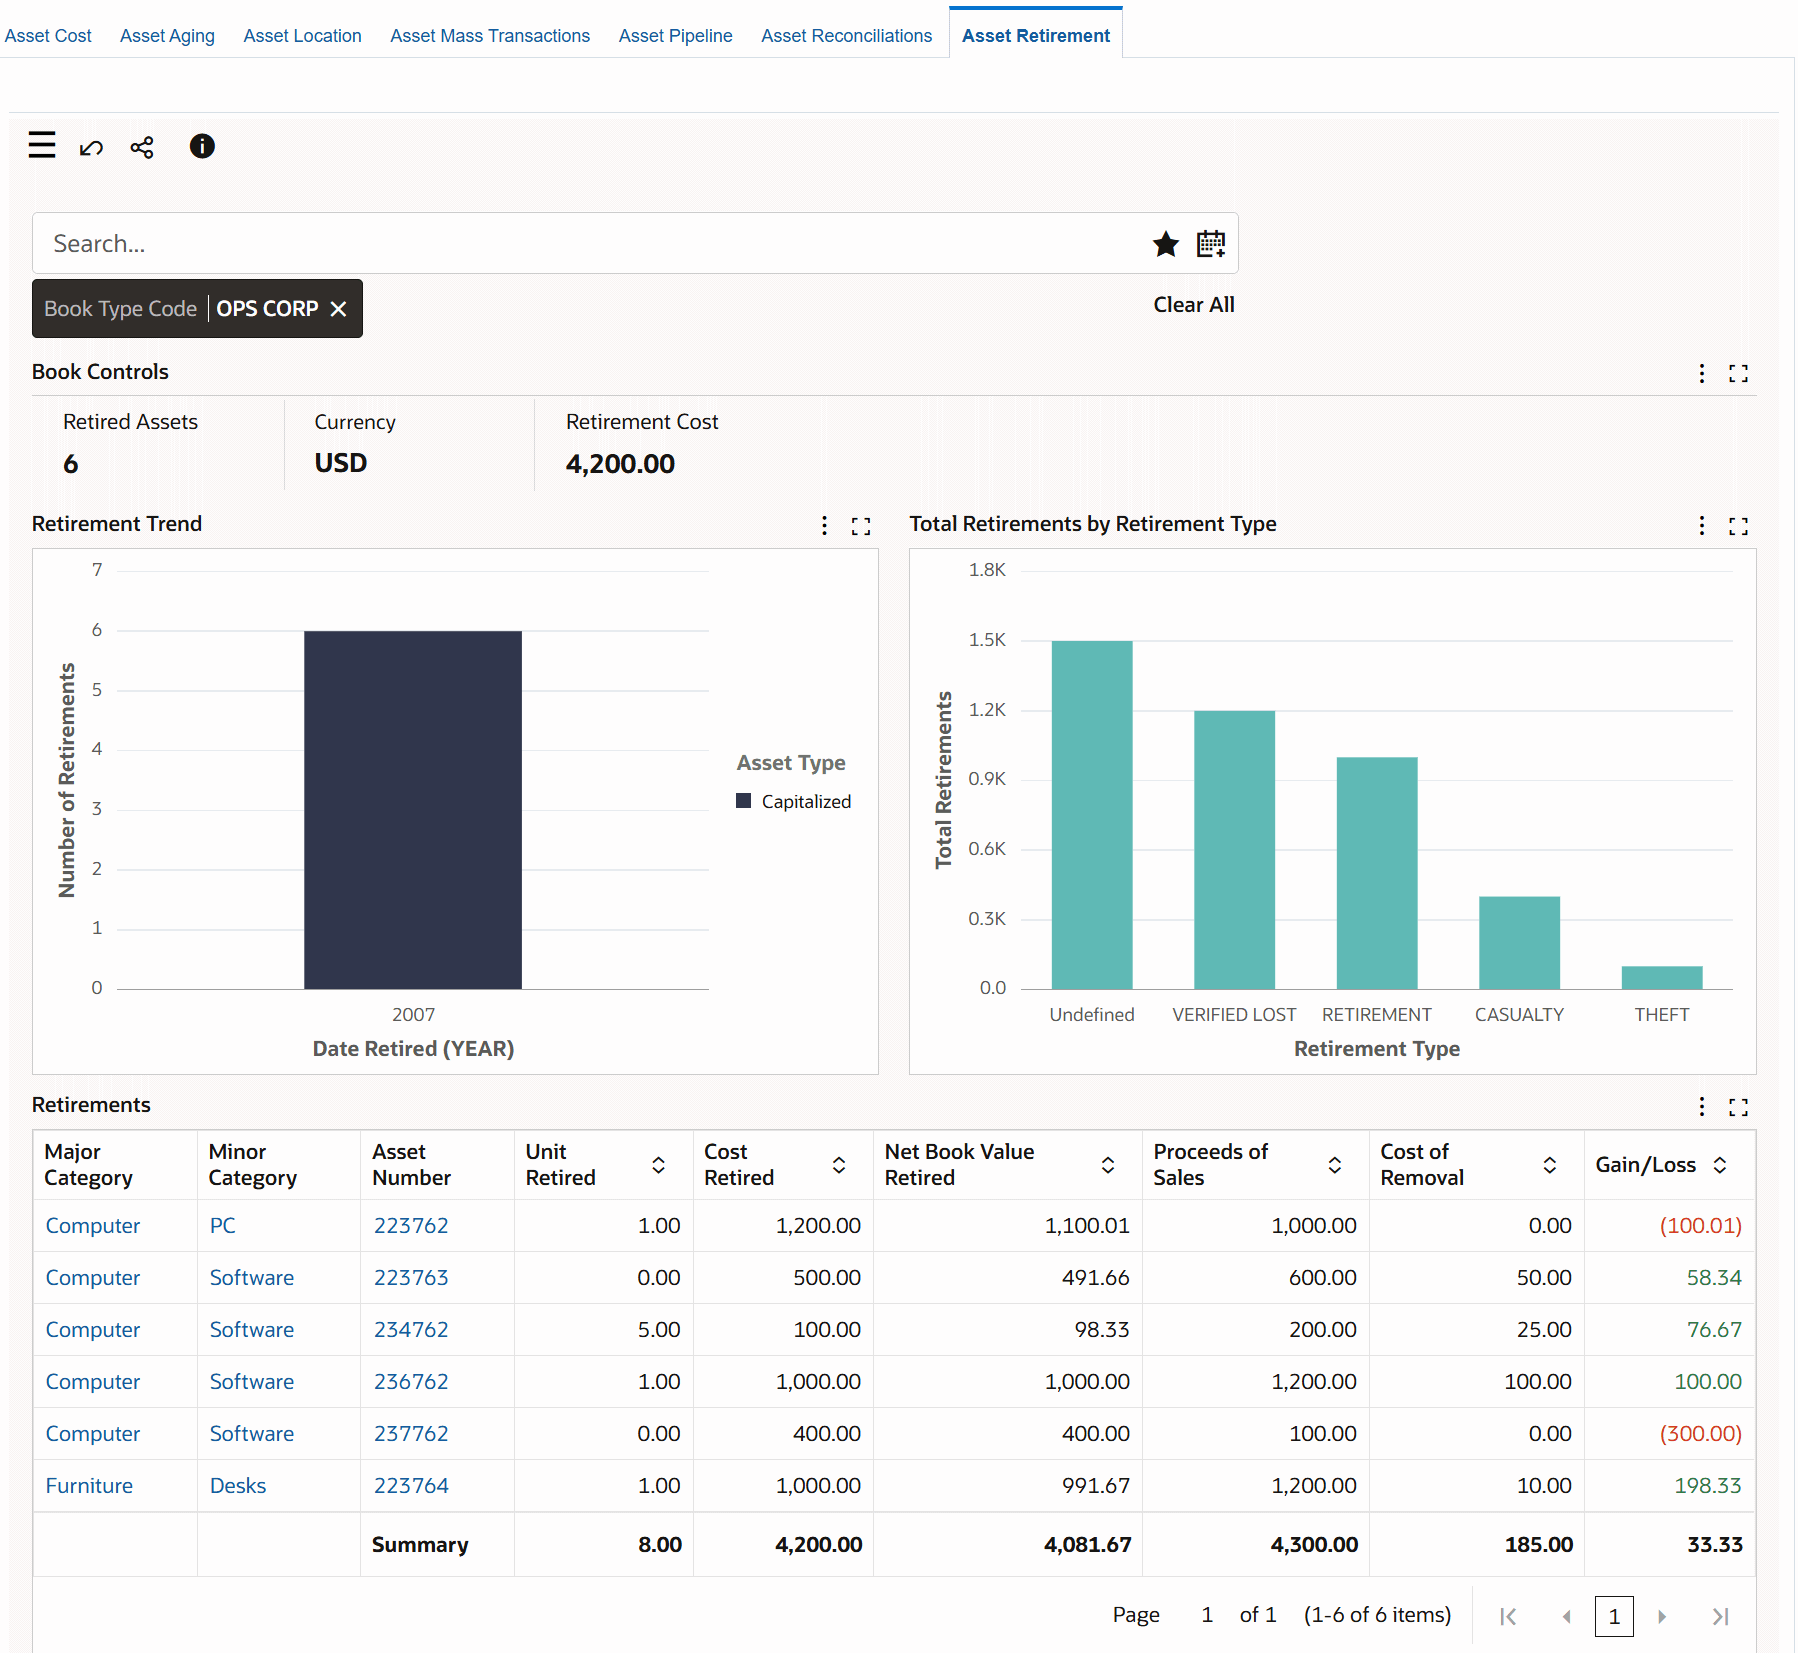
The dashboard displays asset retirement data for the current open period and historical periods based on the value set for the FA: Historical Retirement Range for ECC profile option.
The following tables describe the dashboard:
| Component | Description |
|---|---|
| Book Type Code (filter) | The Book Type Code filter displays the asset book that you can access. If you have access to multiple books, then select a book type to view data within the context of the selected asset book. The Book Type Code list displays the asset books that you can access with the retired asset count for each book type. |
| Book Controls (summary bar) | This summary bar displays the following metrics.
|
| Retirement Trend (chart) | This chart tracks the number of asset retirements by asset type and date. You can select from the following time grain to view the retirement trends by asset type.
Use the chart information to review the retirement trends and patterns to make better aging analysis and lifecycle predictions. |
| Total Retirements by Retirement Type (chart) | This chart shows total retirements or cost retired by retirement type. Note that if a retirement type is not defined for an asset, then all such asset retirements are grouped under the Undefined heading and graph. |
| Retirements (aggregated table) | You can review retirement details such as major category, minor category, transaction type, retirement type, asset number, asset description, and date retired. The metrics include unit retired, cost retired, net book value retired, proceeds of sales, cost of removal, and gain or loss. You can use the Hide/Show Attributes component to select the attributes for which you want to view information. For an asset retirement in major and minor category, you can identify gain versus loss as loss is highlighted through color formatting. |
| Options (table-level actions) | Compare: Use this action to compare selected retired assets. |