Oracle Payables Command Center
This chapter covers the following topics:
- Payables Command Center Overview
- Supplier Balance Dashboard
- Holds Dashboard
- Discounts Dashboard
- Open Liabilities Dashboard
- Period Close Dashboard
Payables Command Center
Payables Command Center Overview
Oracle Payables Command Center uses the Oracle Enterprise Command Center Framework to help you to analyze and to act on payables process data from across your enterprise. Payables managers and accountants can review open payables by liability accounts. Improve your decision making and maximize operational efficiency with the sophisticated guided navigation and powerful search capability of the command center. Identify operational issues through metrics, graphs, and tag clouds, and take immediate action by drilling down directly to the underlying business processes in Oracle Payables.
Note: You can view data for one ledger at a time. Select a ledger by clicking the Ledgers metric in the summary bar.
As a payables manager, use the Payables Command Center to:
-
Optimize days payable outstanding (DPO).
-
Resolve processing issues and accelerate payments to capture discounts.
-
Eliminate early payments and pre-payments.
-
-
Optimize cash outflow.
-
Estimate cash outflow based on due date.
-
Forecast cash requirements in different currencies.
-
-
Improve supplier relationships.
-
Release invoice holds effectively and avoid late payments.
-
Track the status of recent payments.
-
-
Monitor open liabilities.
-
Get an insight into all the liability accounts and liability amounts for the Chart of Accounts (COA) segments.
-
Detect misclassified liabilities.
-
Gather details of all liabilities by account for the purpose of audit.
-
-
Manage period close process proactively.
-
Gain visibility into the accounting process.
-
Identify any potential bottlenecks early in the closing cycle.
-
Reduce adjustments by identifying missed and incorrect posted entries.
-
Use the following dashboards in Payables Command Center:
-
Supplier Balance: Use this dashboard to access payables information and manage open supplier transactions. See Supplier Balance Dashboard.
-
Holds: Use this dashboard to review the payables invoices that are currently on hold and initiate the process to resolve the holds. See Holds Dashboard.
-
Discounts: Use this dashboard to review the discounts that are available on unpaid invoices and analyze the benefits that you can gain by processing the supplier payments. See Discounts Dashboard.
-
Open Liabilities: Use this dashboard to view and analyze open payables liabilities segmented by chart of accounts (COA). This account-centric dashboard enables you to track payables by company, cost center or department, account, or product. See Open Liabilities Dashboard.
-
Period Close: Use this dashboard to get insight into all transactions that affect the closing process for accounting periods and speed up the period close and reconciliation process. See Period Close Dashboard.
Note: You can use the Payables Command Center only after the installation and common configurations are completed as described in My Oracle Support Knowledge Document 2495053.1, Installing Oracle Enterprise Command Center, Release 12.2. For additional ECC overview information, see Overview of Enterprise Command Centers, Oracle E-Business Suite User's Guide.
Searching Enterprise Command Center Dashboards
Use the dashboard sidebar to refine (filter) the data on each dashboard. You can select a value or record from the Available Refinements component, or use Search to find a keyword, a value, or a specific record. The type-ahead feature suggests matches for your entry that correspond to the available refinements. When you submit a search, the search term is added to the Selected Refinements list, and the dashboard data is refined to include only records that match the search. You can add multiple refinements and remove any of them at any time. Use Saved Search to create and save your search. You can edit, delete, or refer to this saved search. You can also use data sets to further refine your search.
Use an asterisk (*) or percent (%) to perform a partial keyword or record search that matches any string of zero or more characters. You can also use a question mark (?) to perform a partial search that matches any single character.
Additional Information: For more information about searching for and refining data in enterprise command centers, see Search in Highlights of an Enterprise Command Center, Oracle E-Business Suite User's Guide.
Supplier Balance Dashboard
See Payables Command Center Overview.
Use the Supplier Balance dashboard to identify which supplier has the highest invoice amount and when that amount is due. Take an action on that invoice. For example, drill down to pay that specific invoice. This dashboard also lists the recently paid invoices. You can track details of recently paid invoices.
Note: To view details of suppliers with open liabilities, see Open Liabilities Dashboard.
From the Payables Manager responsibility, navigate to the Supplier Balance dashboard:
(N) Payables Command Center > Supplier Balance
Important: To correctly display invoice validation statuses from Oracle Payables on the Supplier Balance dashboard, your system administrator must run the Payables Command Center Data Load concurrent program with the Full Load option. Otherwise, some components may show errors.
Supplier Balance Dashboard
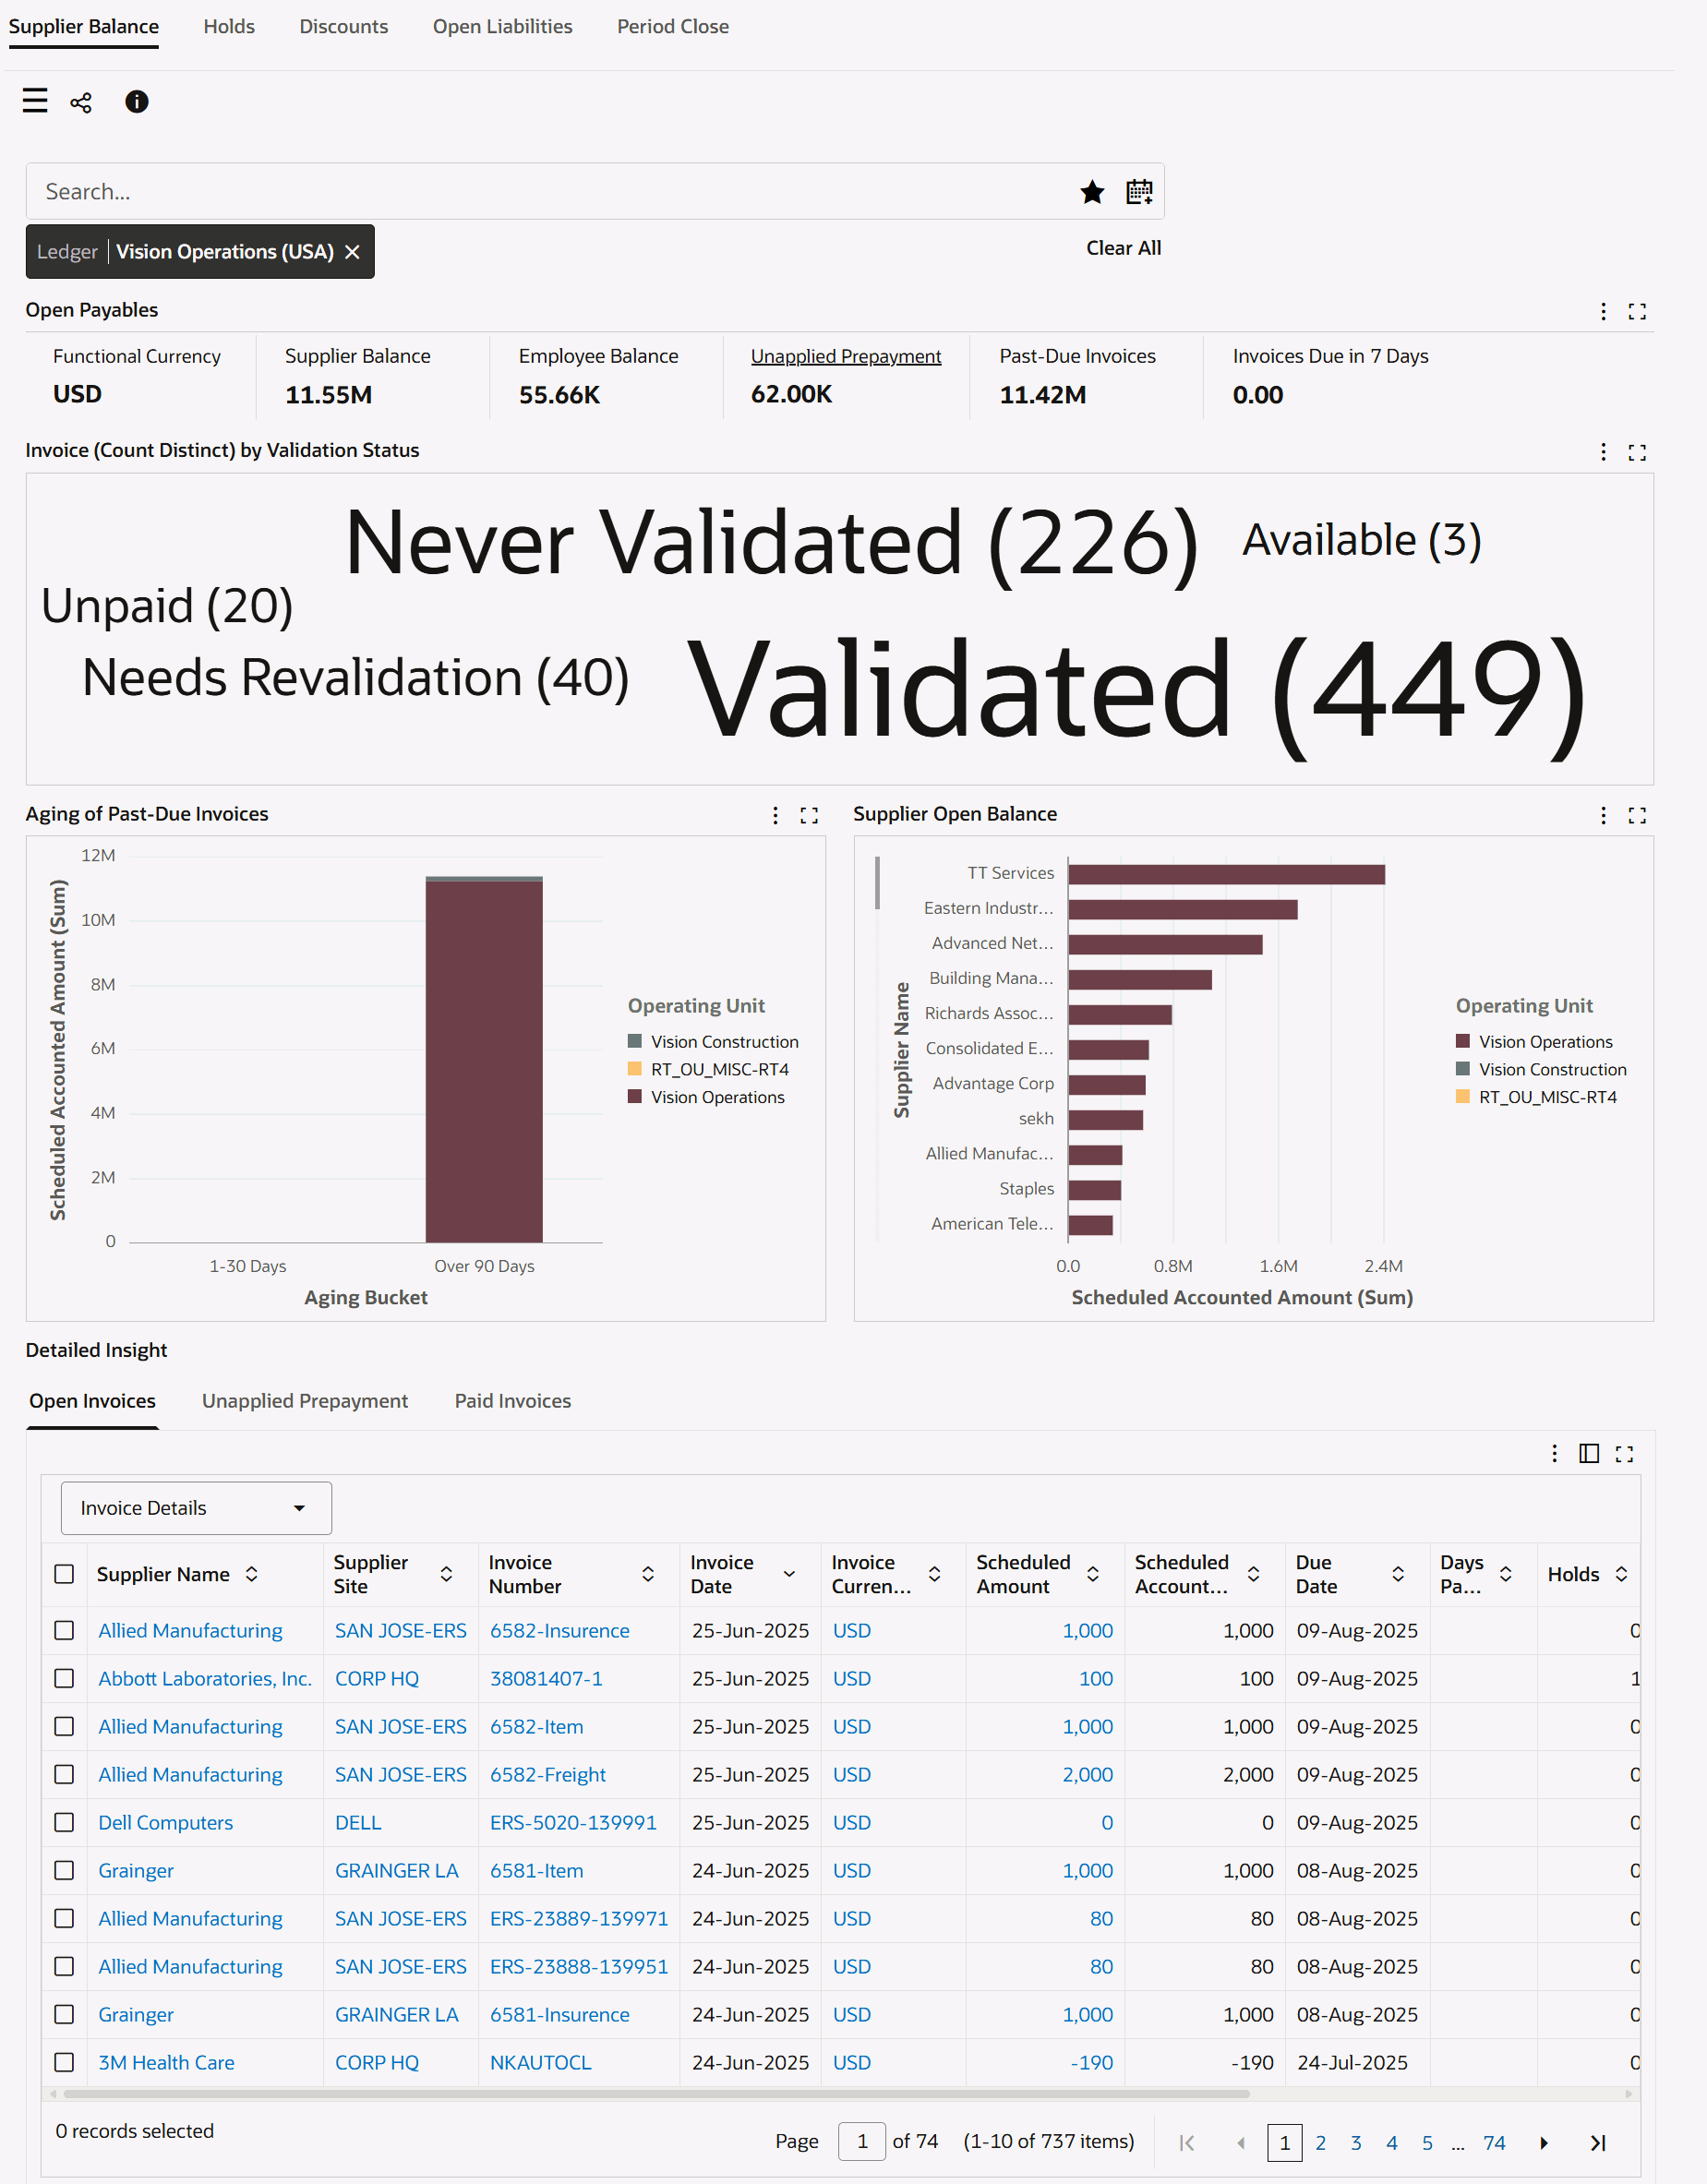
The following table describes the dashboard:
| Component | Description |
|---|---|
| Ledger (filter chip) | The Ledger filter displays the ledger that you can access. The supplier balance data is displayed in the context of a ledger. If you have access to multiple ledgers, then first select a ledger to display relevant data based on the selected filter. The Ledger list displays the ledgers that you can access with the invoices count. |
| Open Payables (summary bar)
Note: Amounts are displayed in the ledger currency, and the conversion of foreign currency invoices uses the invoice exchange rate. |
Use the metrics in this summary bar to monitor the health of open payables transactions.
|
| Invoice (Count Distinct) by Validation Status (tag cloud) | This tag cloud displays the top ten validation statuses for the open invoices with the number of invoices at each status and drill down to the invoice type. |
| Charts
Note: Amounts are displayed in the ledger currency, and the conversion of foreign currency invoices uses the invoice exchange rate. |
You can view the following charts:
|
| Detailed Insight (tabbed component) Open Invoices (results table) |
This table displays schedules for all unpaid or partially paid invoices that are accessible to you. You can perform the following row-level actions:
|
| Detailed Insight (tabbed component) Unapplied Prepayment (results table) |
Use this table to view details for the prepayment invoices that are available and are not fully applied. |
| Detailed Insight (tabbed component) Paid Invoices (results table) |
Use this table to view details for invoices or schedules that were partially paid or fully paid. To display the payment history, the dashboard considers the number of days specified in the AP: ECC Payment History Range profile option. To view the payment details for an invoice, click the link in the Invoice Number column to navigate to the Invoice Workbench (Payables Manager) window. |
| Options (table-level actions) | Export: Use this action to export the search results in a comma-separated values (CSV) file. |
Holds Dashboard
See Payables Command Center Overview.
Use the Holds dashboard to see payables invoices that are currently on hold. Identify and drill down on problematic invoices to resolve issues such as supplier disputes. The dashboard shows purchase-order matched and non-matched invoices.
From the Payables Manager responsibility, navigate to the Holds dashboard:
(N) Payables Command Center > Holds
Holds Dashboard
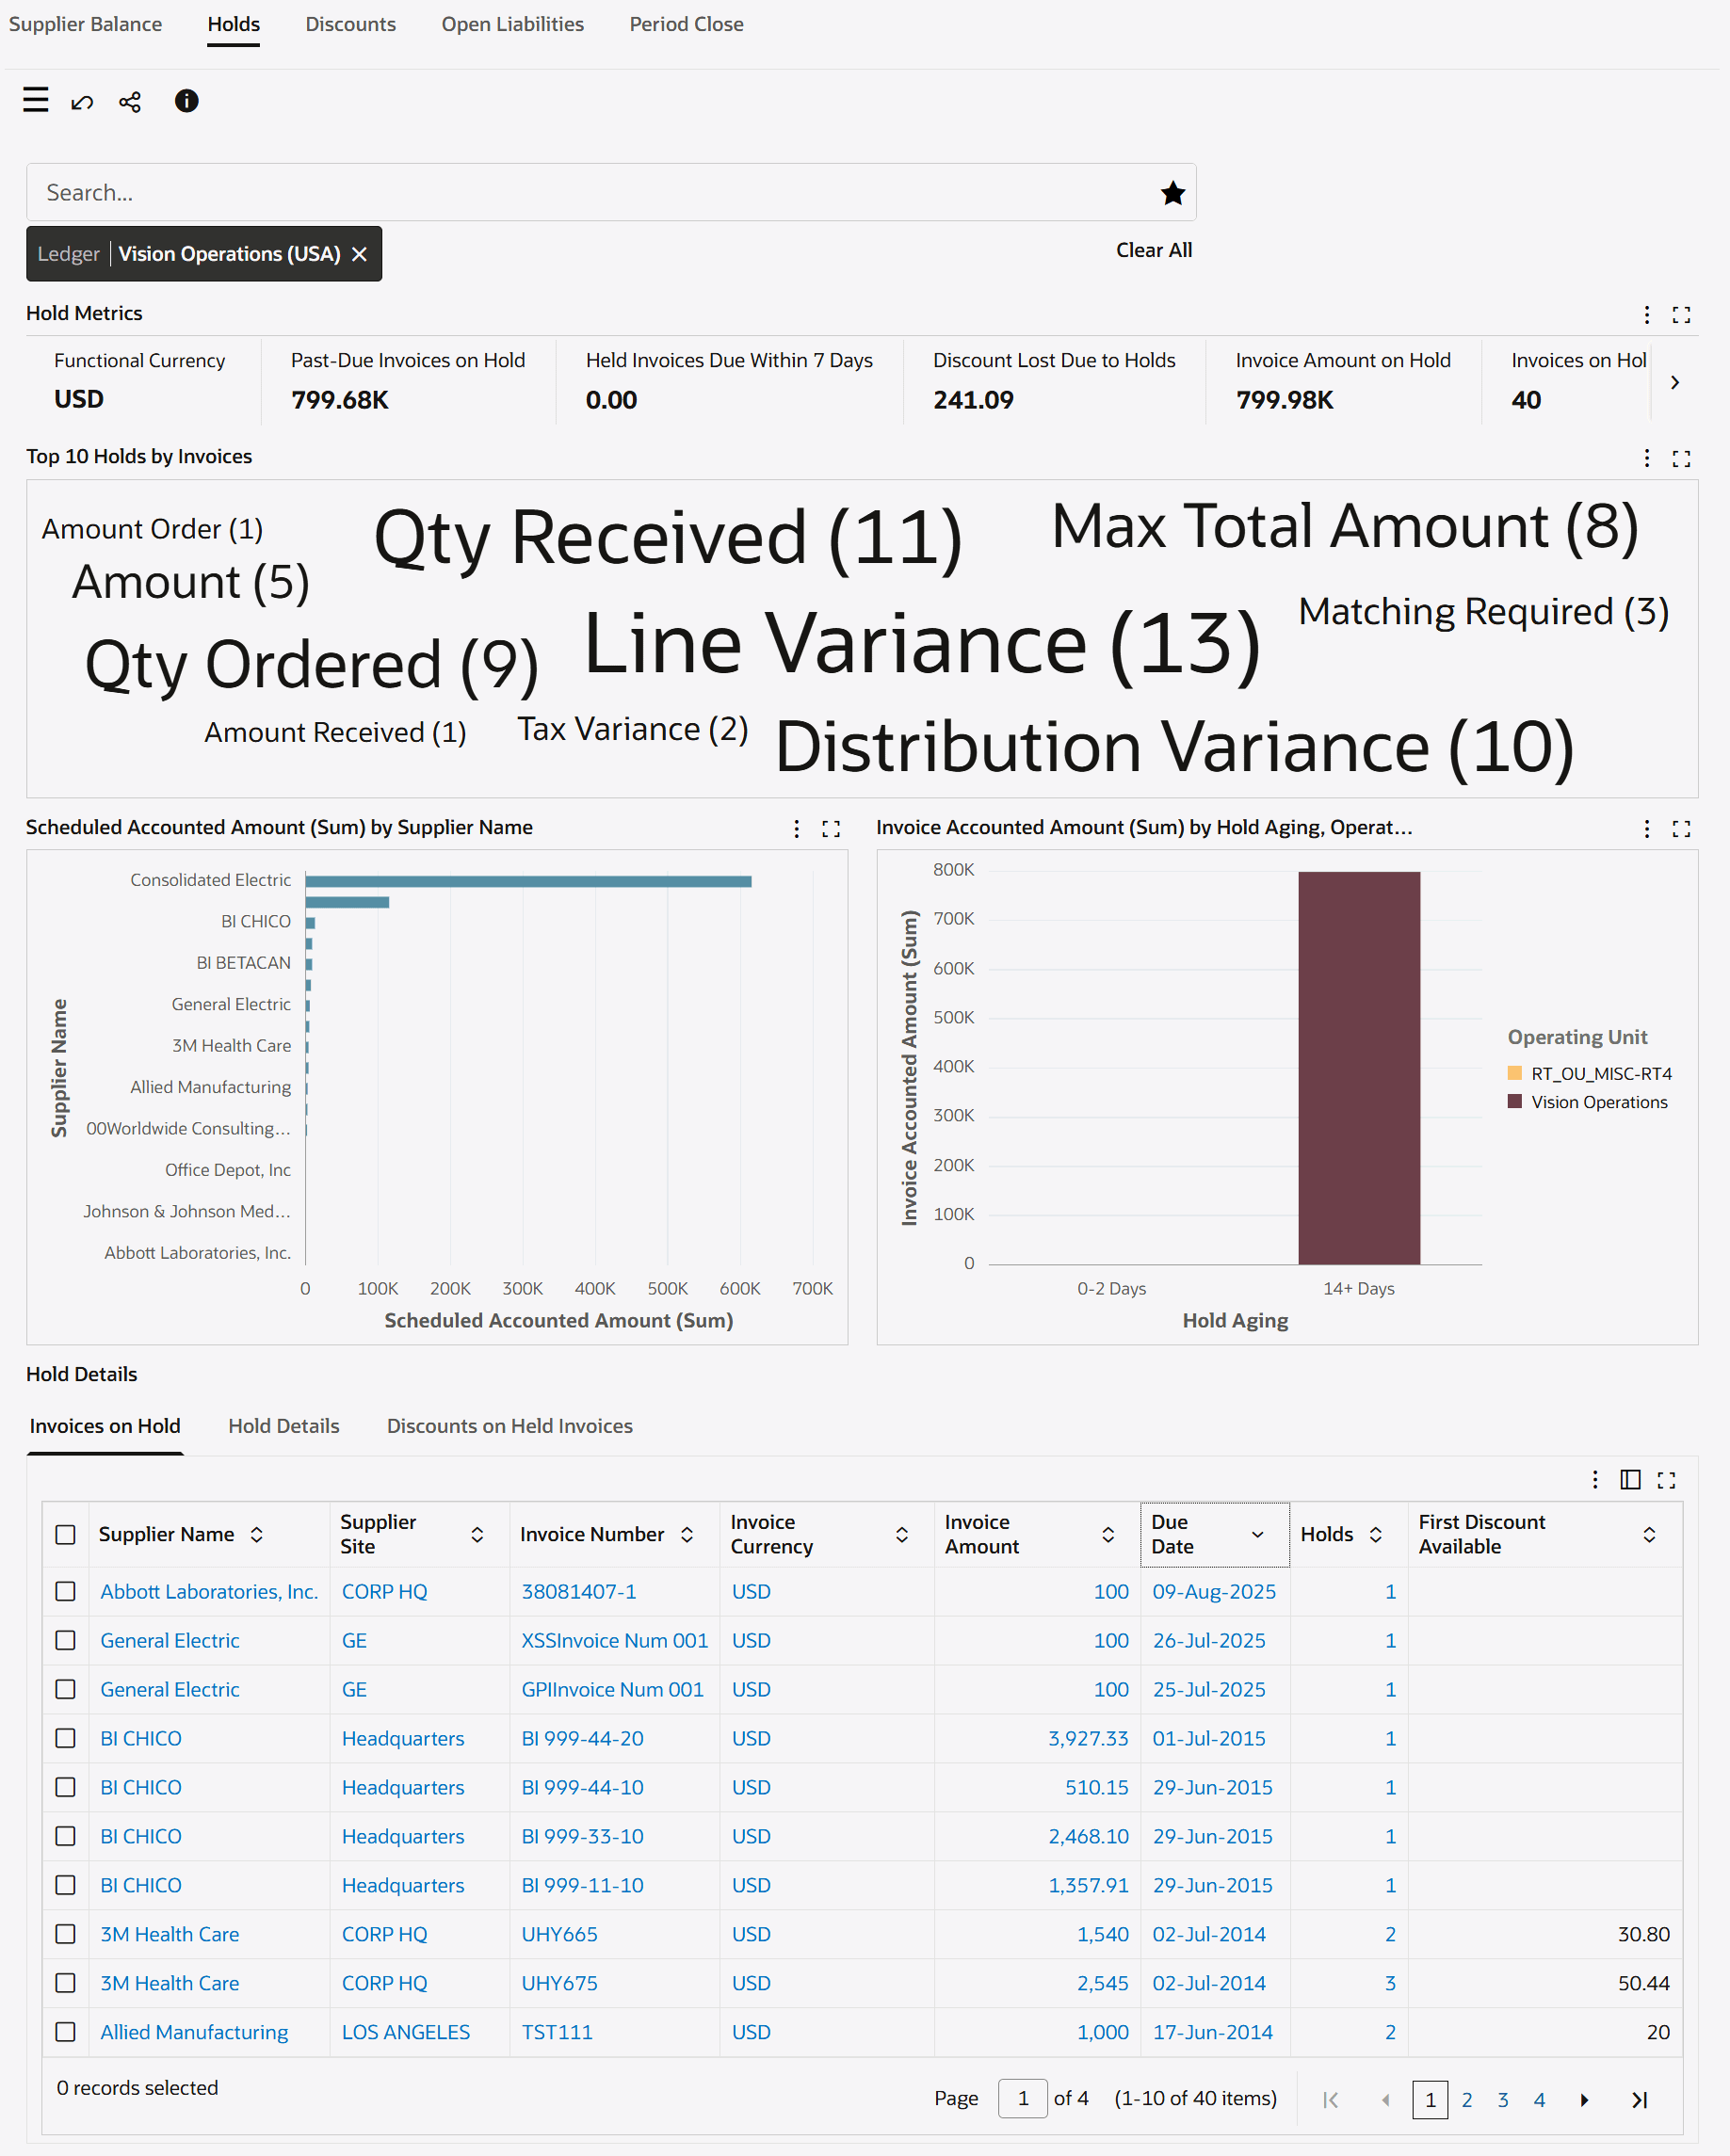
The following table describes the dashboard:
| Component | Description |
|---|---|
| Ledger (filter chip) | The Ledger filter displays the ledger that you can access. The holds data is displayed in the context of a ledger. If you have access to multiple ledgers, then first select a ledger to display relevant data based on the selected filter. The Ledger list displays the ledgers that you can access with the invoices count. |
| Hold Metrics (summary bar)
Note: The invoice date is displayed at the schedule level. Note: Amounts are displayed in the ledger currency, and the conversion of foreign currency invoices uses the invoice exchange rate. |
This summary bar displays the following metrics:
|
| Top 10 Holds by Invoices (tag cloud) | This tag cloud shows the ten holds most frequently applied, sized by frequency. |
| Charts
Note: Amounts are displayed in the ledger currency, and the conversion of foreign currency invoices uses the invoice exchange rate. |
The following charts are available:
|
| Hold Details (tabbed component) Invoices on Hold, Hold Details, Discounts on Held Invoices (results tables) |
The results tables display details for invoices on hold and for discounts on held invoices. To perform invoice actions, in the Invoices on Hold table, click the Invoice Number link to navigate to the Invoice Workbench (Payables Manager) window. |
| Options (table-level actions) | Export: Use this action to export the search results in a comma-separated values (CSV) file. |
Discounts Dashboard
See Payables Command Center Overview.
Use the Discounts dashboard to review the discounts that are available on unpaid invoices. The dashboard includes a breakdown of the discount amounts by invoices and discount expiration dates, and so on. Use this information available, maximize discounts by managing the timing of invoice payments.
From the Payables Manager responsibility, navigate to the Discounts dashboard:
(N) Payables Command Center > Discounts
Discounts Dashboard
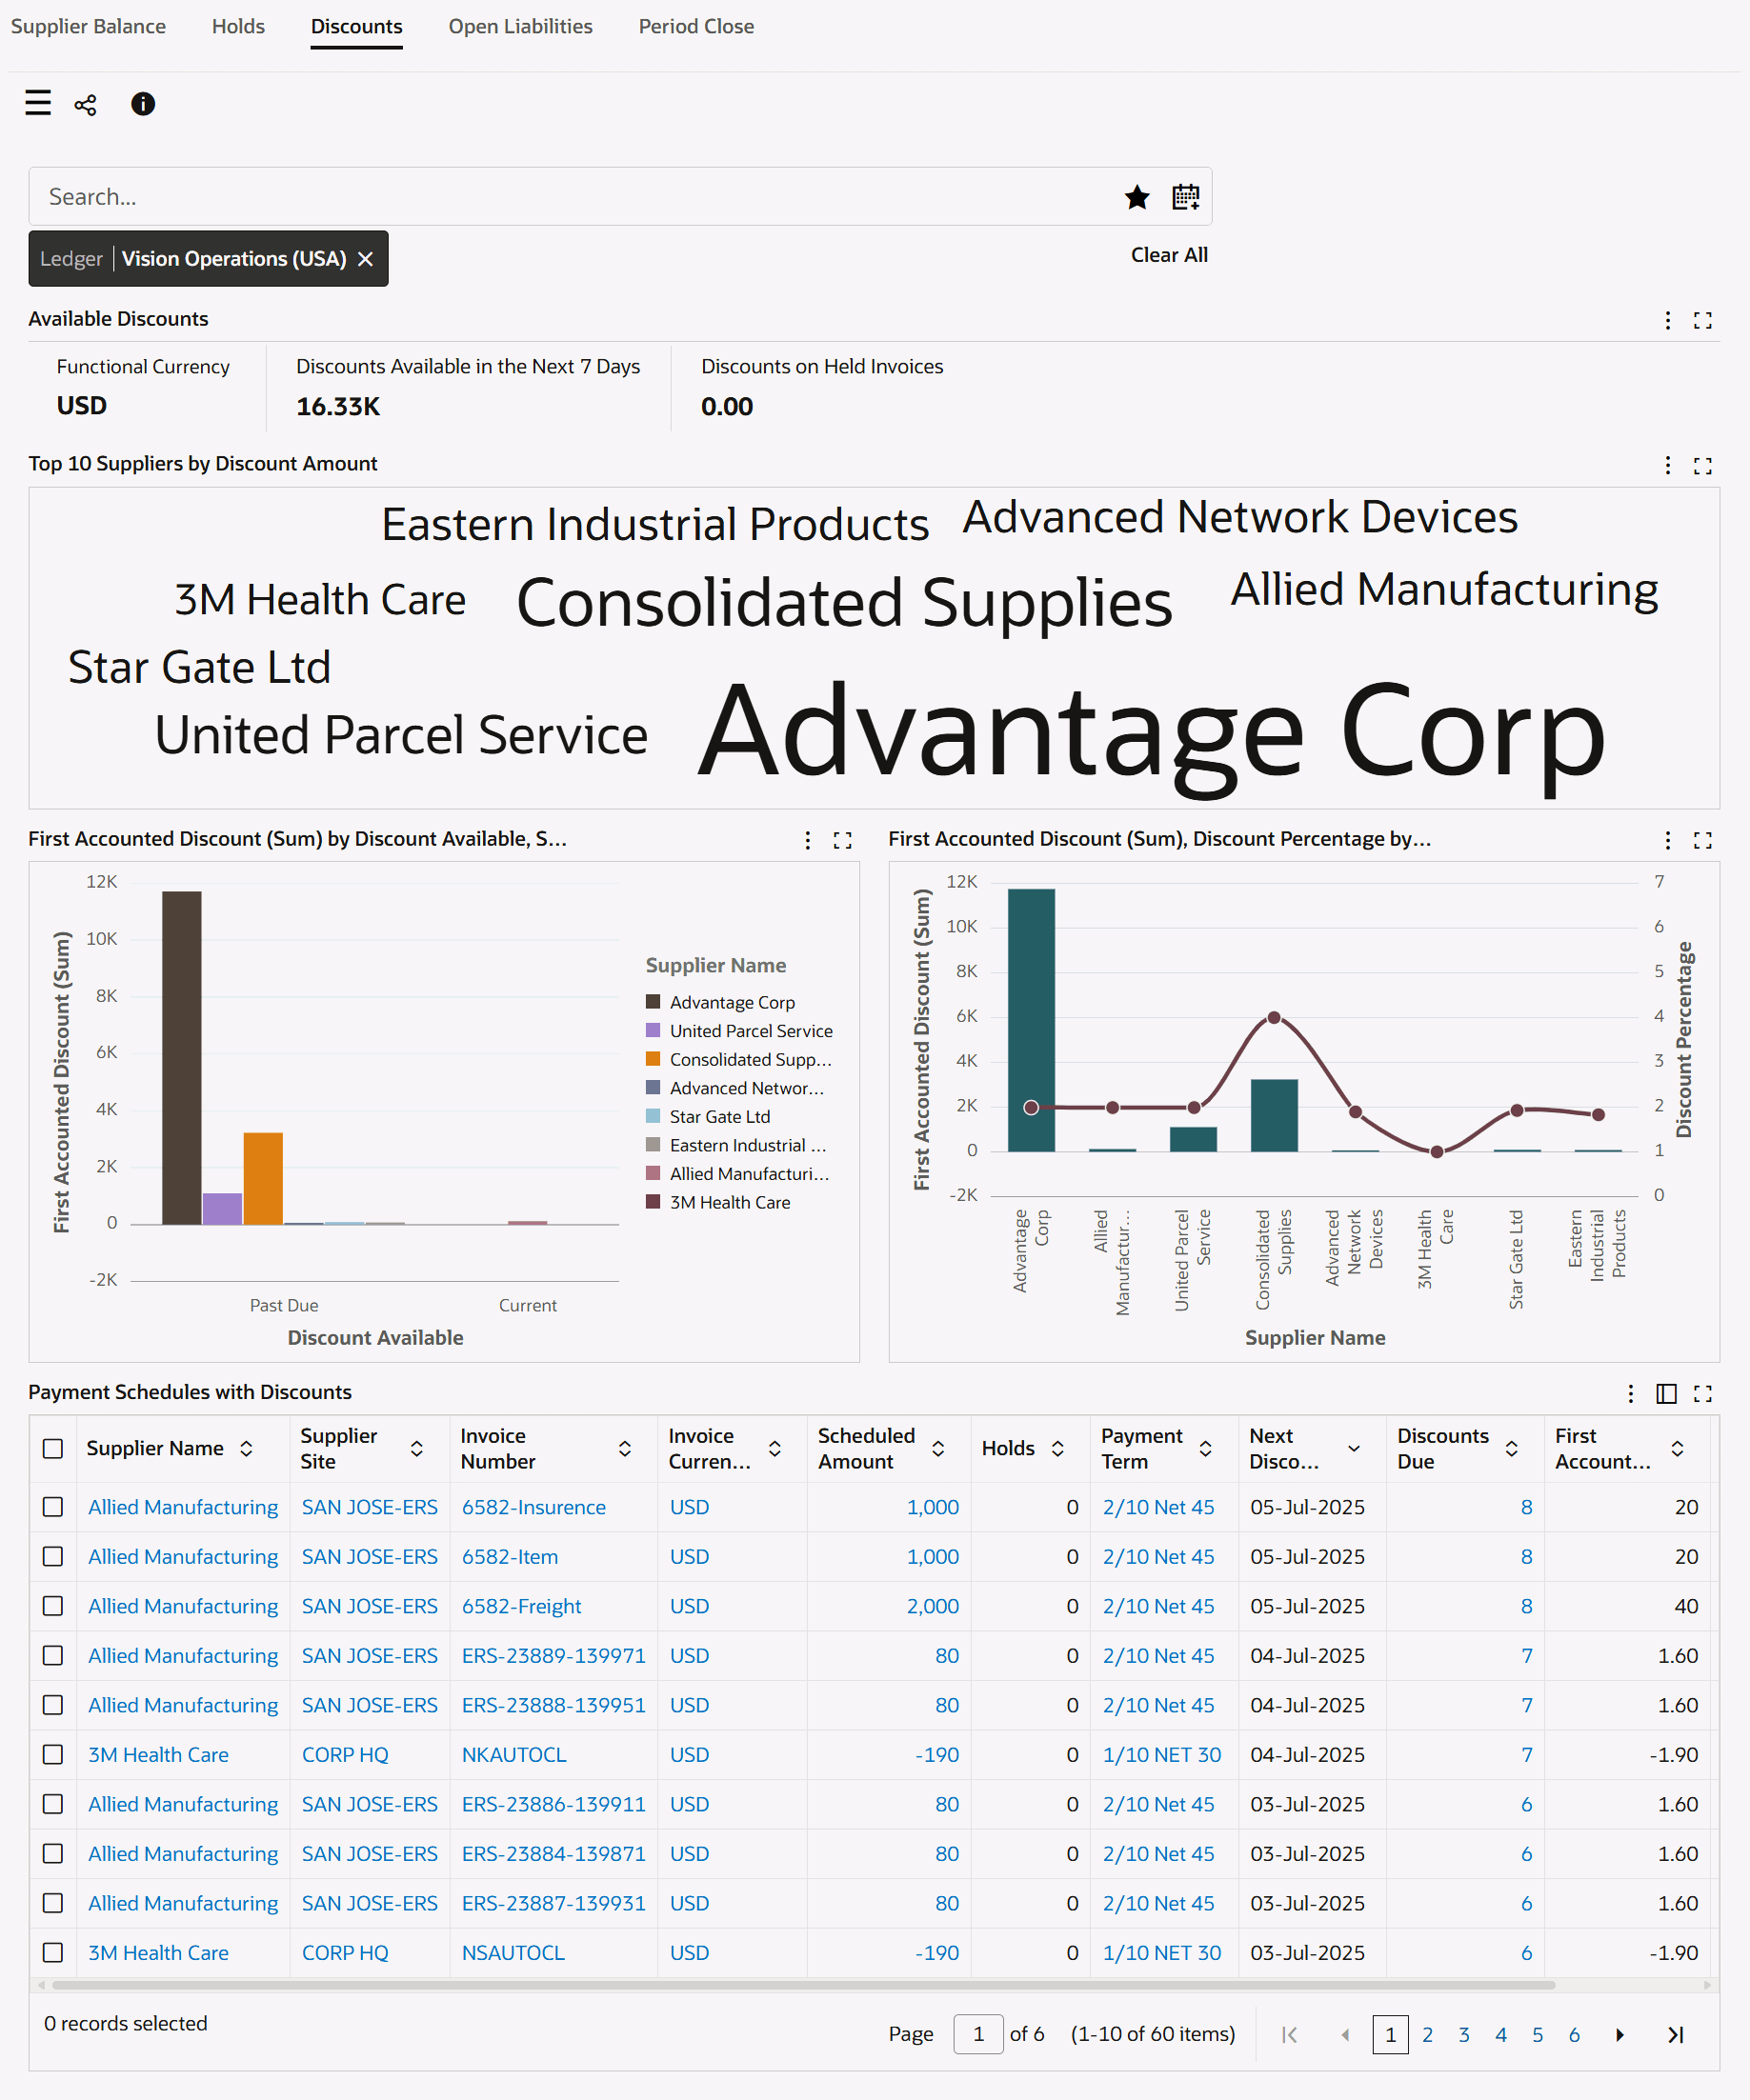
The following table describes the dashboard:
| Component | Description |
|---|---|
| Ledger (filter chip) | The Ledger filter displays the ledger that you can access. The discounts data is displayed in the context of a ledger. If you have access to multiple ledgers, then first select a ledger to display relevant data based on the selected filter. The Ledger list displays the ledgers that you can access with the invoices count. |
| Available Discounts (summary bar)
Note: Amounts are displayed in the ledger currency, and the conversion of foreign currency invoices uses the invoice exchange rate. |
These metrics help you to review the discount opportunities available on unpaid invoices.
|
| Top 10 Suppliers by Discount Amount (tag cloud) | This tag cloud displays the ten suppliers with the highest number of discountable schedules available on outstanding balances. |
| Charts
Note: Amounts are displayed in the ledger currency, and the conversion of foreign currency invoices uses the invoice exchange rate. |
|
| Payment Schedules with Discounts (results table) | This table displays invoices with discount terms. You can perform the following row-level actions:
|
| Options (table-level actions) | Export: Use this action to export the search results in a comma-separated values (CSV) file. |
Open Liabilities Dashboard
See Payables Command Center Overview.
Use the Open Liabilities dashboard to review open liabilities resulting from validated invoices that are unpaid or partially paid. You can focus on General Ledger liability accounts and Chart of Accounts segments (COA) to assess financial exposure from payable obligations.
Use the dashboard to:
-
Filter open liabilities by the liability account and chart of accounts segments.
-
Evaluate the open liabilities through review of metrics.
-
Trace payables balances at the liability account and chart of accounts segment level.
-
Review the open liability amount for each open liability account.
-
Track open liabilities for a fiscal year, fiscal quarter, fiscal period, or General Ledger date.
-
Identify where liabilities are accumulating to monitor payable exposures by business unit.
-
Examine details of invoices with liabilities such as supplier name, cost center, account, and schedule accounted amount.
-
Review the payment status of invoices with liabilities.
From the Payables Manager responsibility, navigate to the Open Liabilities dashboard:
(N) Payables Command Center > Open Liabilities
Important: The dashboard shows the default liability account assigned at the invoice header level. The dashboard includes invoices with the Validated or Unpaid validation status. In addition to the Multi-Org Access Control (MOAC) security that is applied at the operating unit level, this dashboard implements the Segment Value Security for chart of accounts (COA) segments. Therefore, you can access only a segment value or ranges of segment values associated with your user responsibility. The Segment Value Security does not restrict your view of invoices associated with segments for which you do not have access.
Open Liabilities Dashboard
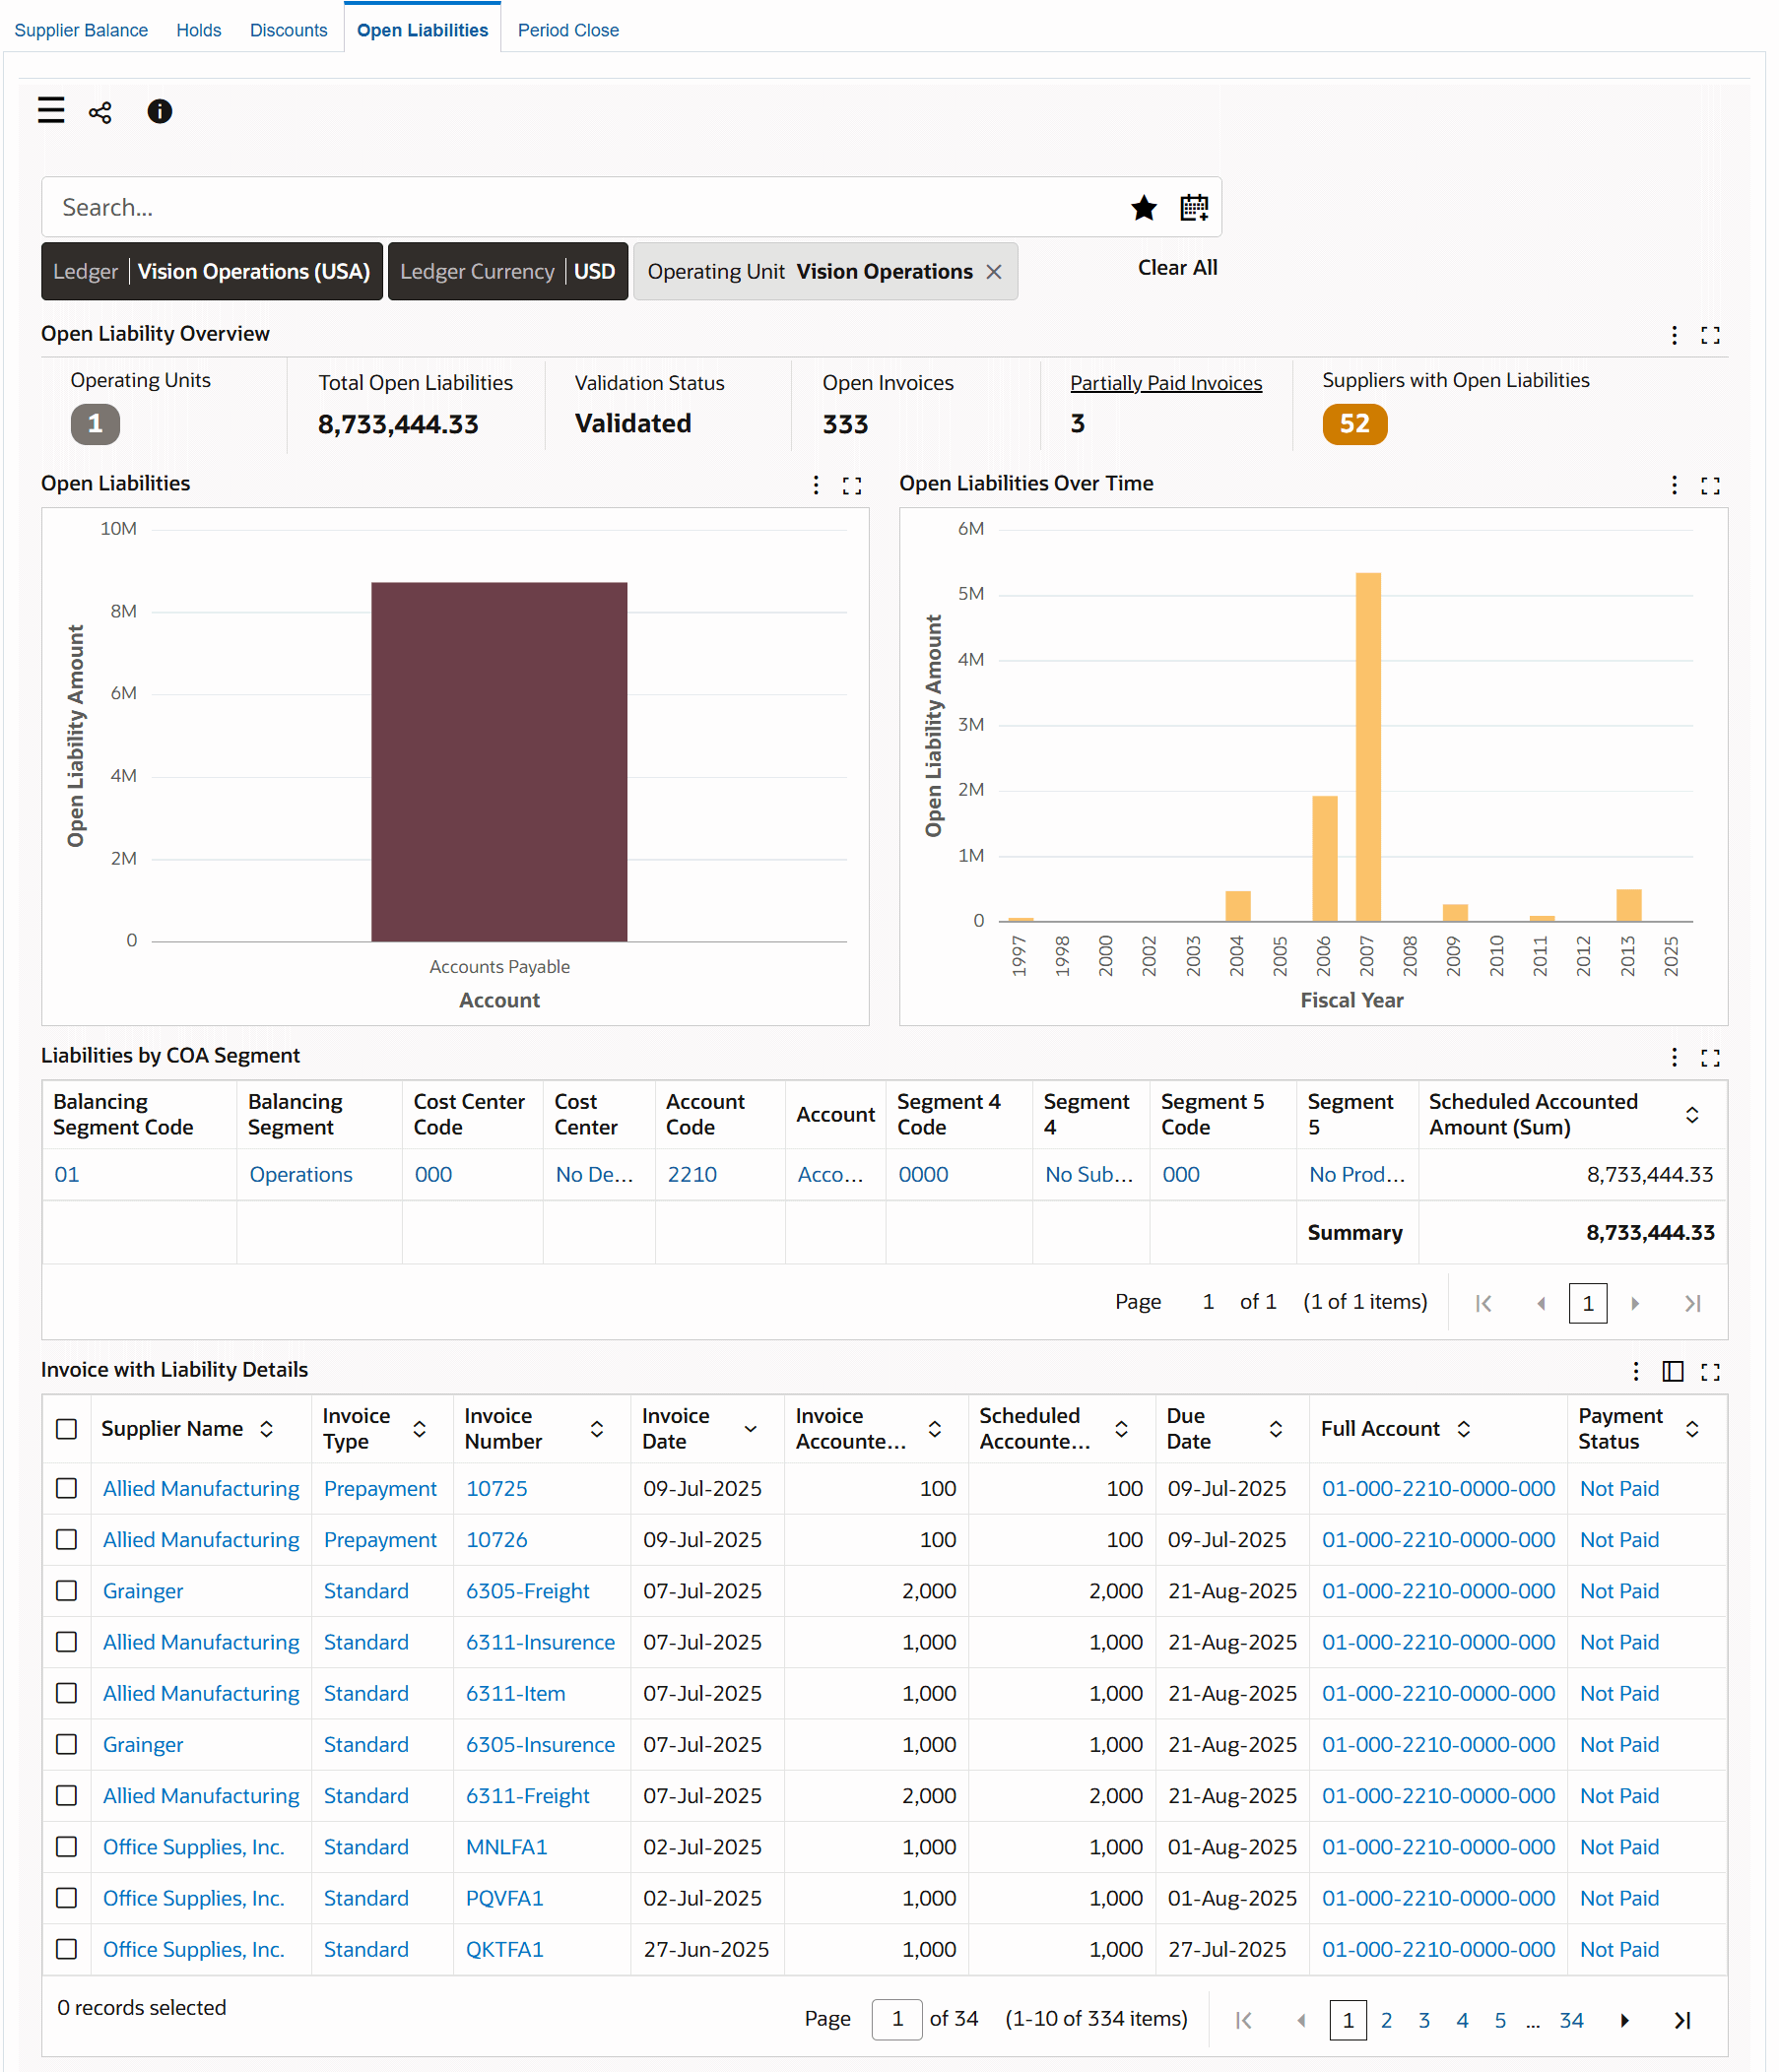
The following table describes the dashboard:
| Component | Description |
|---|---|
| Ledger (filter chip) Ledger Currency (filter chip) |
The Ledger filter displays the ledger that you can access. The open liabilities data is displayed in the context of a ledger. If you have access to multiple ledgers, then first select a ledger to display relevant data based on the selected filter. The Ledger list displays the ledgers that you can access with the total open liability amount. The ledger currency filter chip shows the ledger currency and ledger count. |
| Open Liability Overview (summary bar) | Use the metrics in this summary bar to monitor open liabilities.
|
| Open Liabilities (chart) | This chart shows the General Ledger account-level breakdown of the total unpaid or partially paid invoice amounts for different liability accounts assigned at the invoice header level. Use this chart to get an insight into the liability accounts. The Dimension list includes all chart of account segments as defined in your system, such as Account, Department, Sub Account, and Product. Select a dimension to view the open liability amount for that segment. |
| Open Liabilities Over Time (chart) | This is a trend chart that enables you to track open liabilities using the following dimensions:
You can compare the open liabilities data over the years, quarters, or periods. You can analyze how unpaid or partially paid validated invoices are distributed across fiscal years to identify potential issues that are tied to specific fiscal periods. For example, when you select the fiscal year dimension, you can view the breakdown of the liability amounts across different liability accounts in the Open Liabilities chart. |
| Liabilities by COA Segment (aggregate table) | This table displays open liabilities across different chart of accounts (COA) segments. You can view break down of unpaid or partially paid invoice amounts by charts of accounts segments. Use the Hide/Show Attributes components to select the segments for which you want to analyze data. |
| Invoice with Liability Details (results table) | Use this table to review the source transactions or invoices that contribute to the liability amount. The table shows details such as the supplier's name, invoice type, invoice number, invoice date, invoice accounted amount, scheduled account amount, due date, full account, and payment status. Use the Hide/Show Attributes components to select the columns for which you want to view data. |
Period Close Dashboard
See Payables Command Center Overview.
The Period Close dashboard shows data for open accounting periods and offers insight into the period close process in your enterprise to ensure that all transactions are processed, accounted, and transferred to Oracle General Ledger (GL). If the accounting transactions are not closed during the subledger period, then new transactions in the past periods are affected, which invalidates the already accounted and reported results in GL.
Use the dashboard to:
-
Review all invoices and payments created in the period.
-
Manage period close process proactively.
-
Gain visibility into the accounting process and subledger accounting events.
-
Review and analyze period close exceptions for a ledger, an operating unit, and an accounting period.
-
Drill down to the source transaction to review unaccounted transactions (invoices or payments).
-
Drill down to subledger journal lines and journal errors.
-
Identify any potential bottlenecks early in the closing cycle.
-
Reduce adjustments by identifying missed and incorrect posted entries.
-
-
Increase efficiency.
-
Reduce period close time.
-
Accelerate delivery of financial results to internal management.
-
Identify improvements that need to be made over the next period.
-
-
Optimize month-end processes and improve accounting cycle.
-
Track period close process.
-
Complete the accounting process.
-
Solve accounting errors.
-
Transfer accounted journals to GL.
-
From the Payables Manager responsibility, navigate to the Period Close dashboard:
(N) Payables Command Center > Period Close
The Period Close dashboard shows data in the context of the selected ledger and the associated operating units. To calculate accounted and untransferred events, the dashboard considers the primary, secondary, and reporting currency ledgers' data including that of the subledger and journal.
Period Close Dashboard
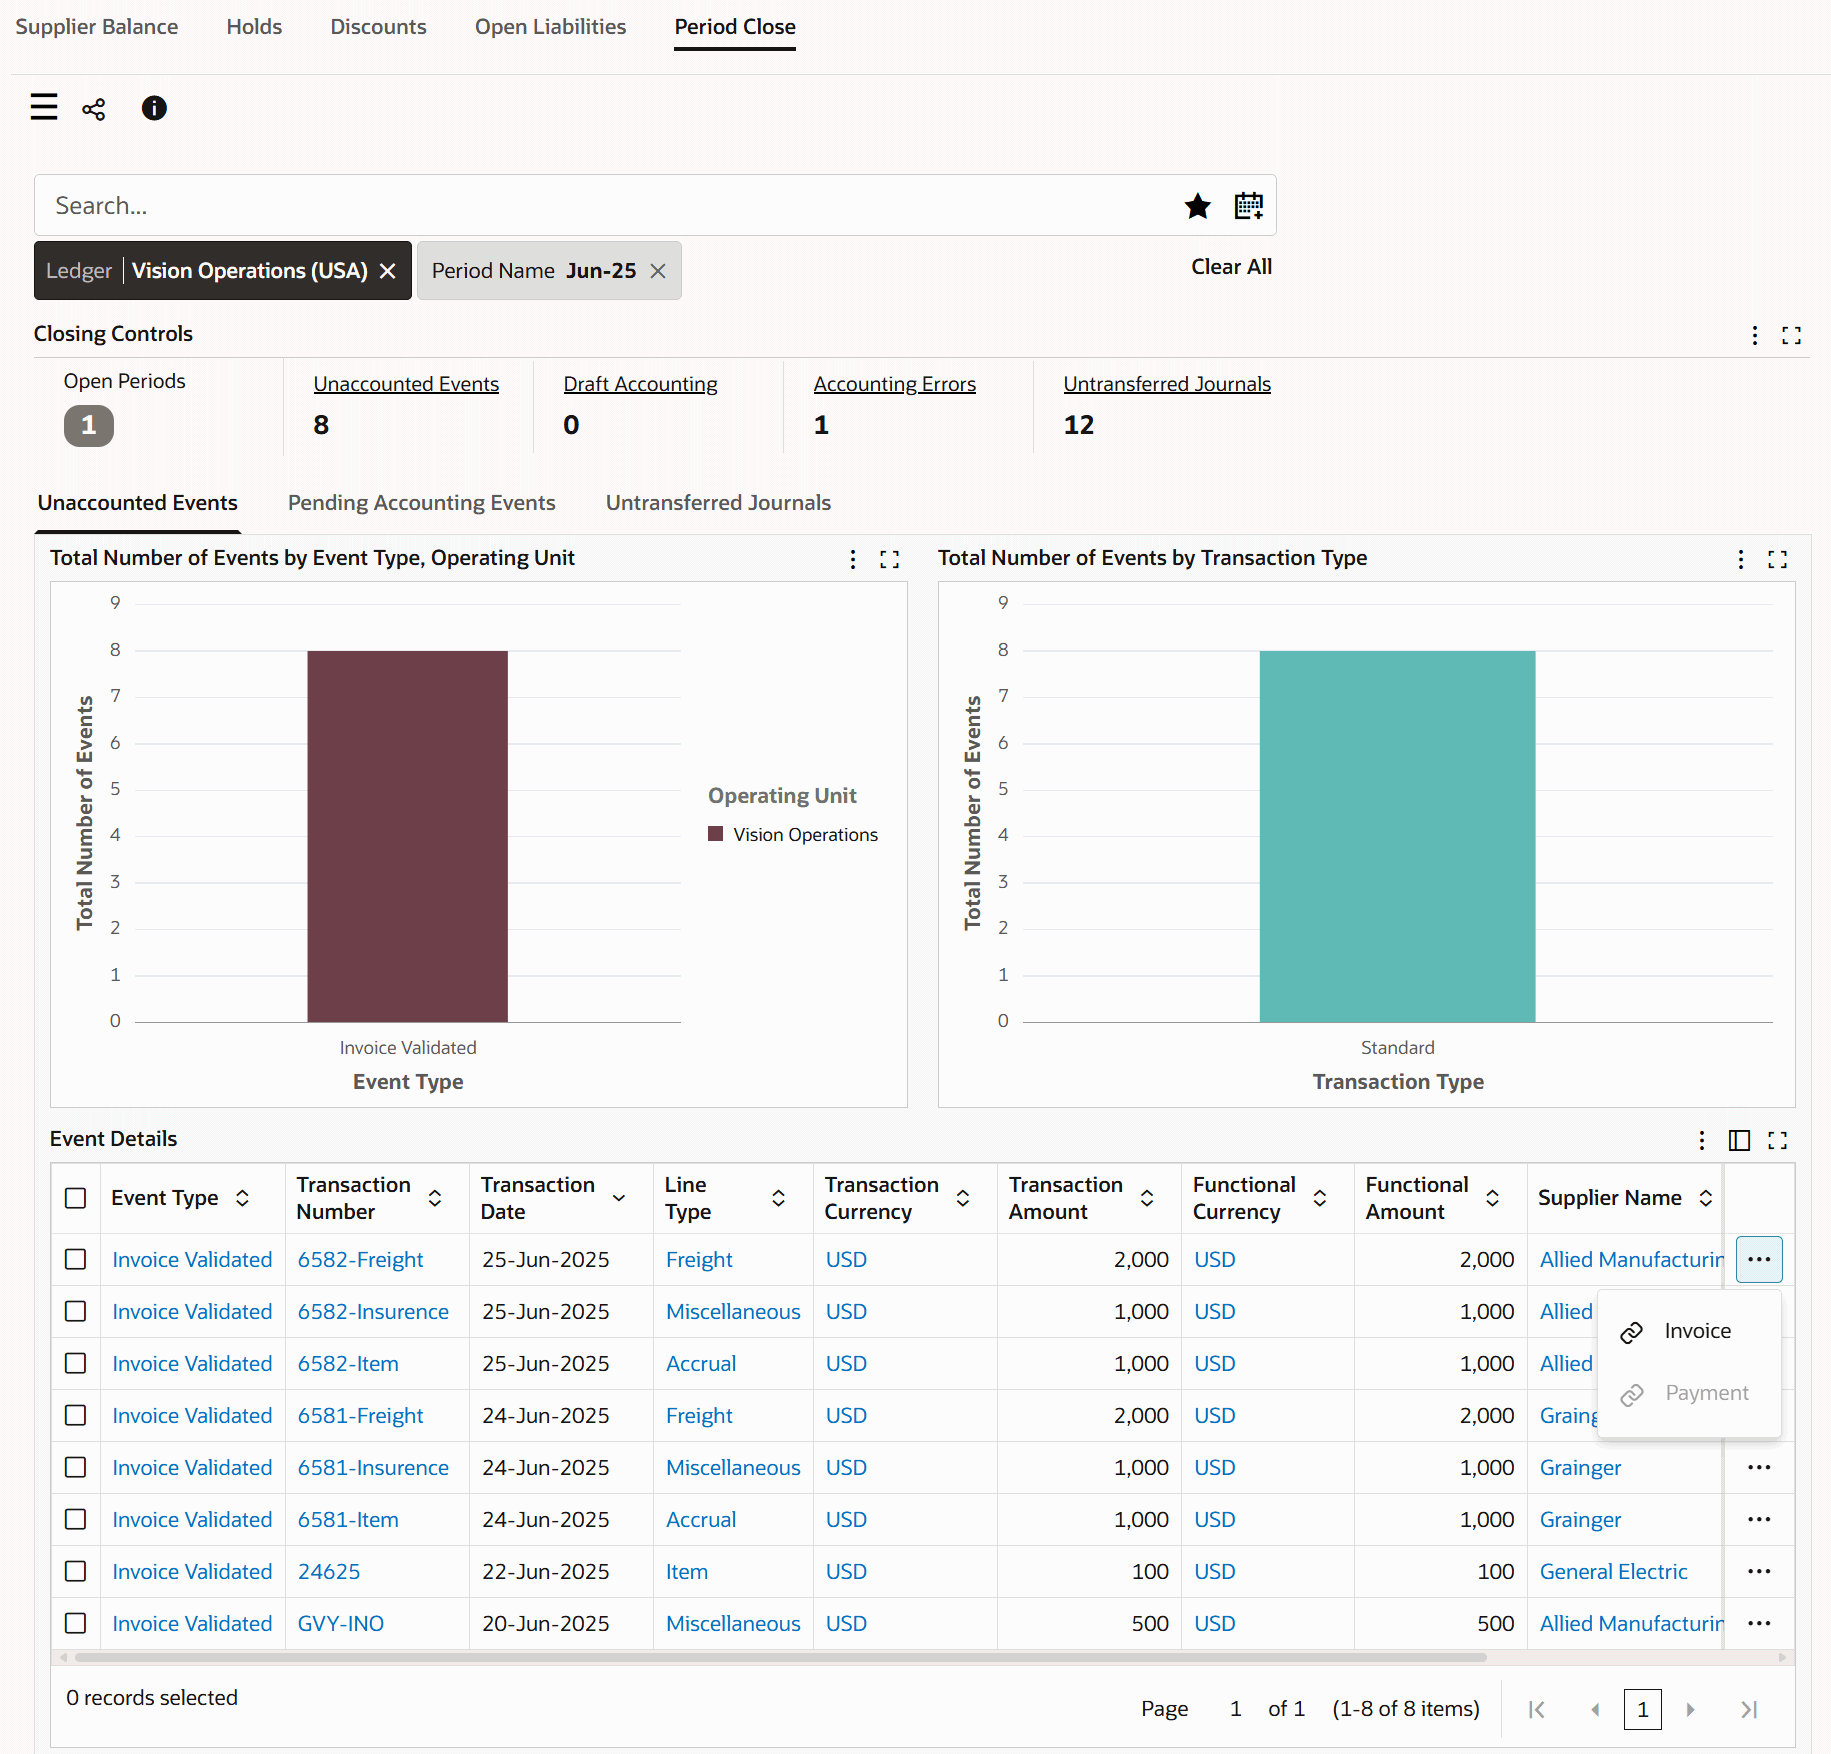
The following table describes the dashboard:
| Component | Description |
|---|---|
| Ledger (filter chip) | The Ledger filter displays the ledger that you can access. The period close data is displayed in the context of a ledger. If you have access to multiple ledgers, then first select a ledger to display relevant data based on the selected filter. The Ledger list displays the ledgers that you can access with the events count. |
| Closing Controls (summary bar) | The summary bar shows the following key metrics to investigate the period close process for the selected ledger.
|
| Unaccounted Events (tab) | This tab contains the following charts and a results table.
|
| Pending Accounting Events (tab) | This tab contains the following charts and a results table.
|
| Untransferred Journals (tab) | This tab contains the following charts and a results table.
|
| Options (table-level actions) | Export: Use this action to export the search results in a comma-separated values (CSV) file. |