Oracle Inventory Management Command Center - Movement Statistics Dashboards
This chapter covers the following topics:
Movement Statistics Dashboard
See Inventory Management Command Center Overview, Oracle Inventory User's Guide.
The Movement Statistics dashboard provides visibility into extensive and wide-ranging statistical data associated with your trade movement. Use different combinations of key trade attributes to review movement statistics data, and analyze transactions across legal entities.
Use the dashboard to:
-
Review the status of movement records by all transactions and specific transaction types.
-
Find the number of movement records that are open, verified, or have an exception.
-
-
Analyze trade volumes and trend.
-
Analyze trade volume across legal entities by source types using the time dimension.
-
Perform detailed analysis of trade volumes and trends using different dimensions such as vendors and customers.
-
Review transactions using attributes such as item description, commodity description, dispatch country, and destination country.
-
-
Get insight into the trade direction.
-
Focus on trade statistics in a specific quarter for a specific country, and for a particular transaction type.
-
Review trade trends and find the items that contribute to the spike or fall in trade volumes.
-
Review trade concentration in geographical locations.
-
Review source and destination of goods.
-
-
Perform returns analysis.
-
Focus on records with exception errors to resolve and clear reporting bottlenecks.
-
Use the movement statistics data to streamline your supply chain process.
Access the Movement Statistics dashboard using the following navigation:
(N) Inventory (responsibility) > Transactions > Movement Statistics Dashboards
Important: The dashboard displays movement statistics data based on a legal entity (which is a business division). Your access to movement records of a legal entity depends on the MO: Security Profile option value set by your system administrator.
Movement Statistics Dashboard
The following table describes the Movement Statistics dashboard components:
| Components | Description |
|---|---|
| Transaction Types (tabbed component) | The Transaction Types tabbed component includes the following tabs:
Each tab presents the following components:
|
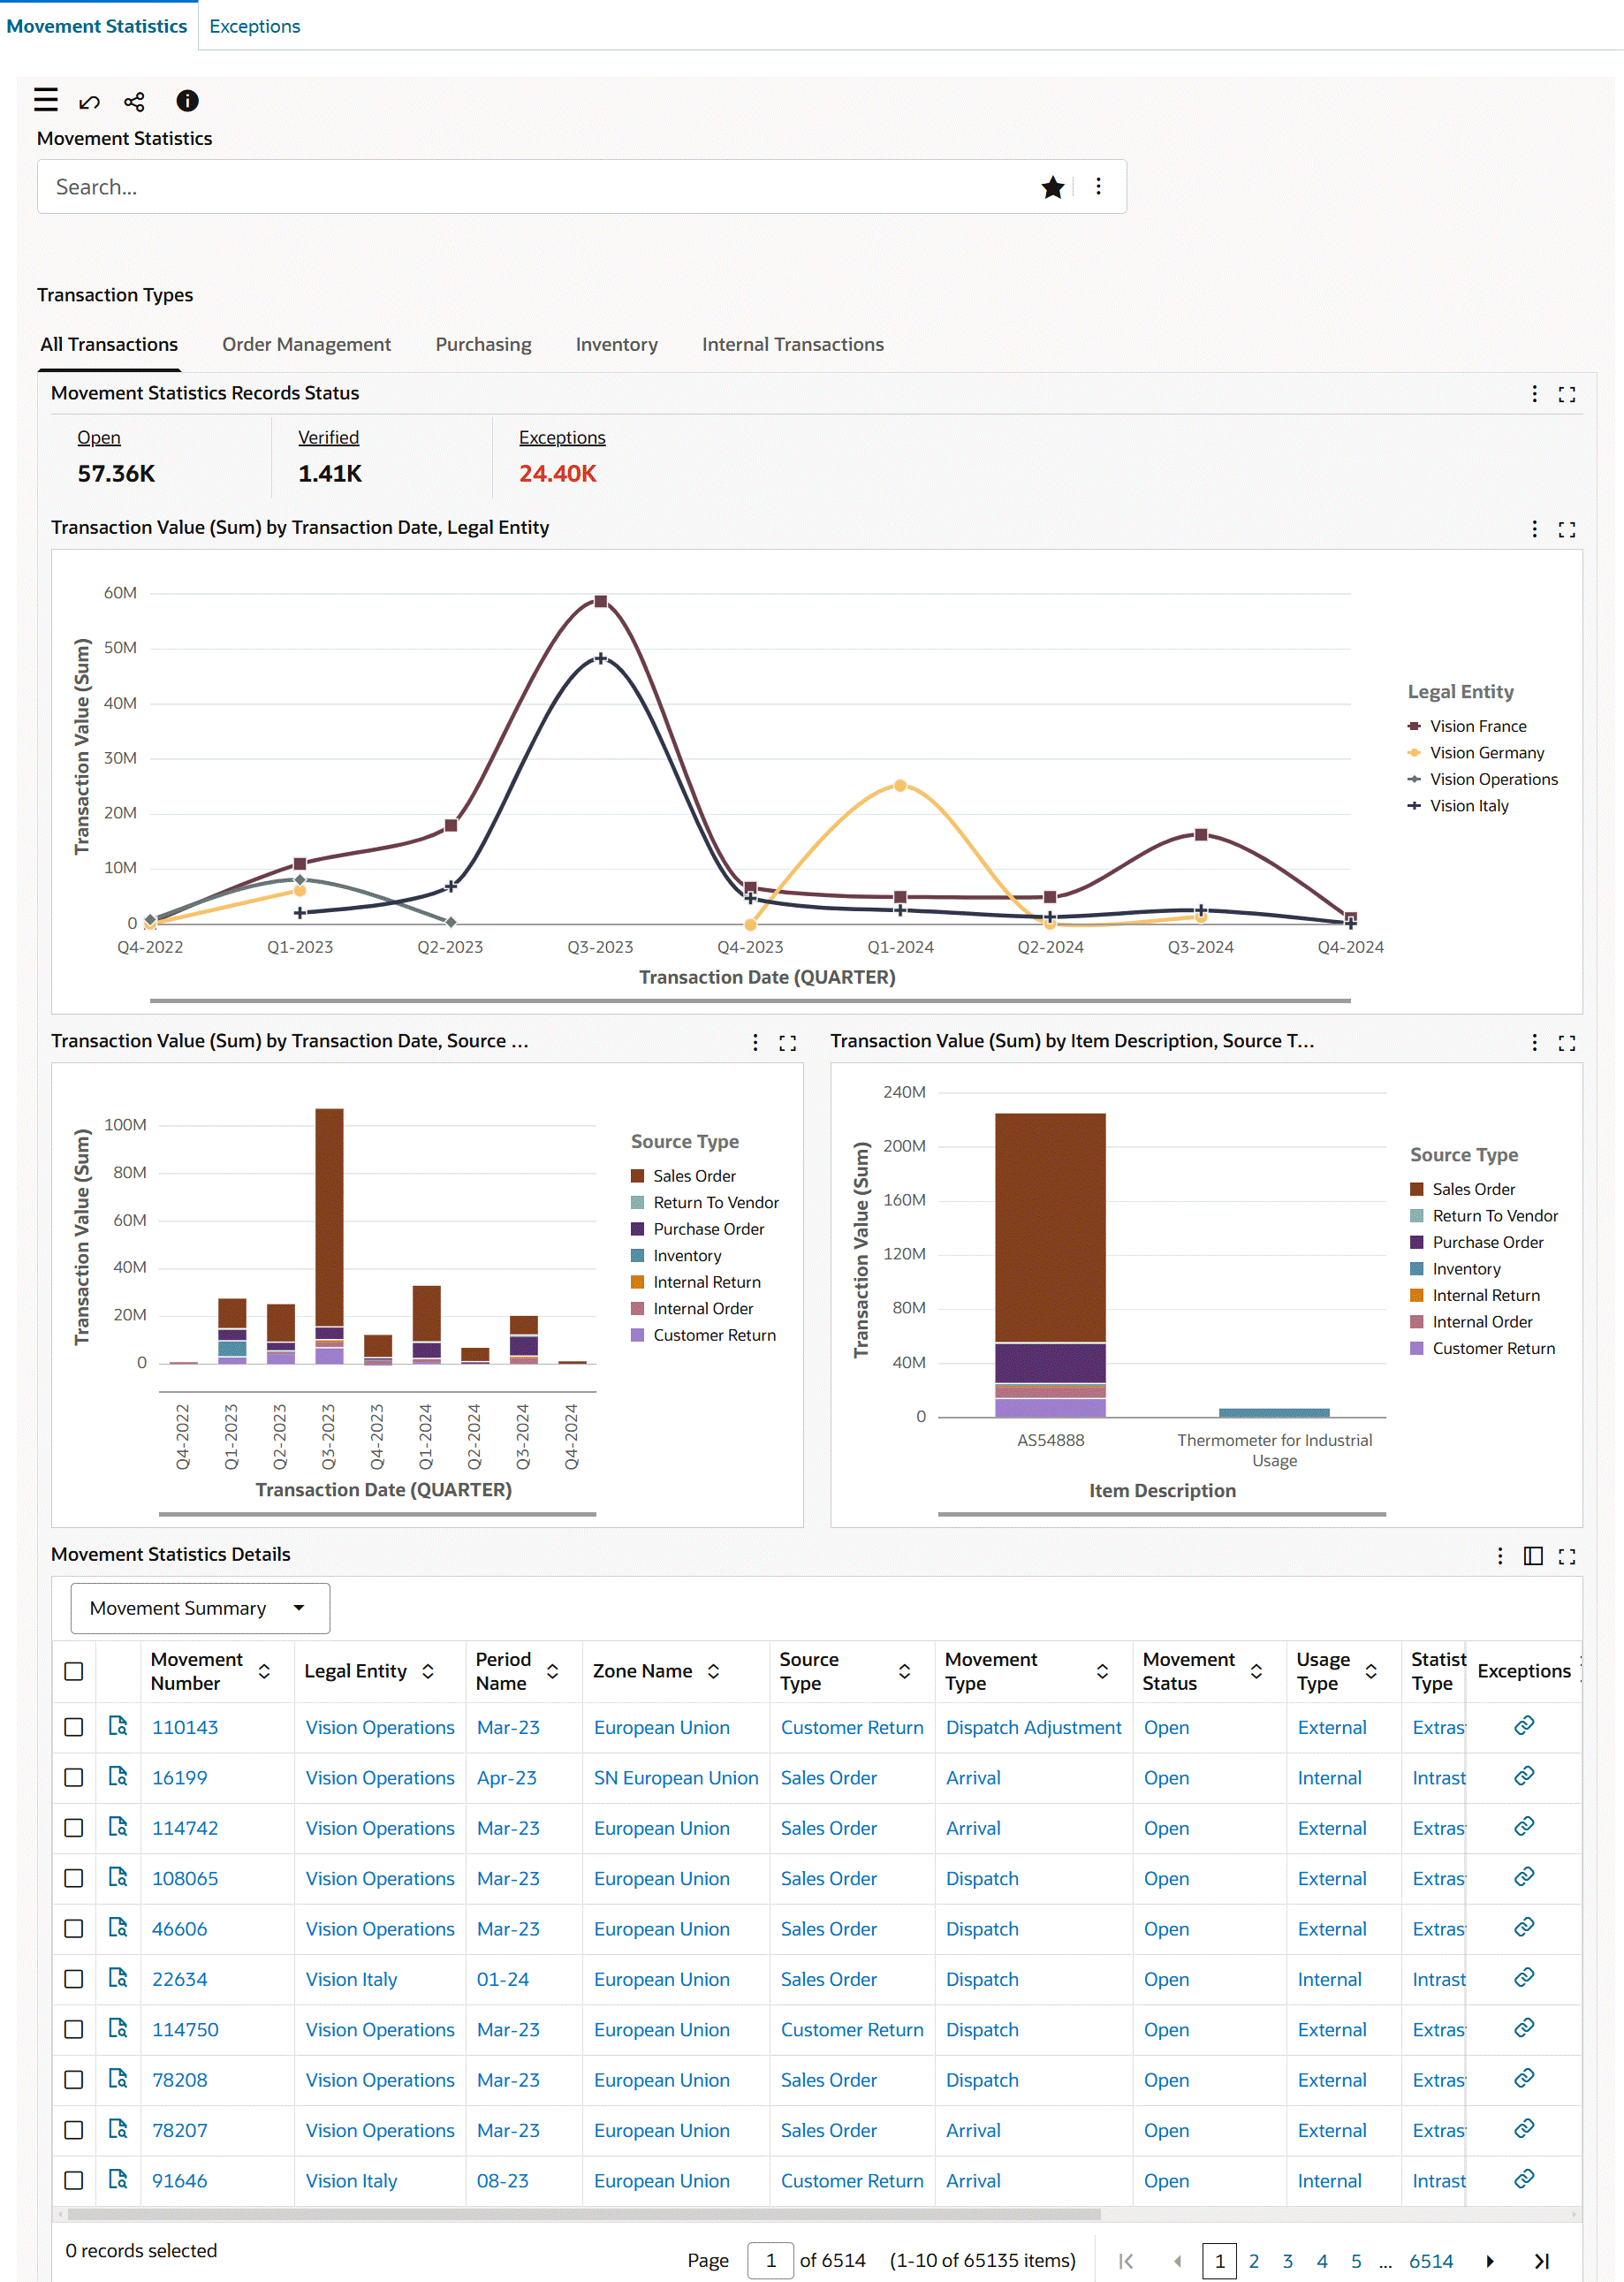
| Movement Statistics Records Status (summary bar) | The Movement Statistics Records Status summary bar is available in the All Transactions, Order Management, Purchasing, Inventory, and Internal Transactions tabs with the following key metrics. To refine the data, click a metric value.
|
| All Transactions (tab) | The All Transactions tab provides metrics and charts to review movement statistics data for Order Management, Purchasing, Inventory, and Internal Transactions. For details, see All Transactions Tab. |
| Order Management (tab) | The Order Management tab provides metrics and charts to review movement statistics data for Oracle Order Management transactions. For details, see Order Management Tab. |
| Purchasing (tab) | The Purchasing tab provides metrics and charts to review movement statistics data for Oracle Purchasing transactions. For details, see Purchasing Tab. |
| Inventory (tab) | The Inventory tab provides metrics and charts to review movement statistics data for Oracle Inventory transactions. For details, see Inventory Tab. |
| Internal Transactions (tab) | The Internal Transactions tab provides metrics and charts to review movement statistics data for inter-org transactions. For details, see Internal Transactions Tab. |
| Movement Statistics Details (results table) | Use this table to review the movement statistics details for movement records. For details, see Movement Statistics Details Results Table. |
All Transactions Tab
The All Transactions tab shows metrics and charts for the following source types:
-
Sales Order
-
Customer Return
-
Purchase Order
-
Return To Vendor
-
Inventory
-
Inventory Return
-
Internal Order
-
Internal Return
The following table describes the All Transactions tab components:
| Components | Description |
|---|---|
| Movement Statistics Records Status (summary bar) | For details about the metrics, see Movement Statistics Records Status. |
| Transaction Value (Sum) by Transaction Date, Legal Entity (chart) | This chart displays divisional trade statistics. By default, the chart shows the transaction value of trade across quarters for legal entities. Select Invoice from the Group Dimension menu. The metrics are Transaction Value (Sum) and Statistical Value (Sum). By default, the time grain is set to quarterly, and you can change the time grain to daily, weekly, monthly, or yearly. |
| Transaction Value (Sum) by Transaction Date, Source Type (chart) | By default, this chart shows the transaction value for source types across quarters by transaction date. Select a different group dimension to view the transaction value for source types by invoice date. The Dimension menu includes Statistical Type, Movement Type, Item Description, Commodity Description, Dispatch Country, and Destination Country. The metrics are Transaction Value (Sum) and Statistical Value (Sum). |
| Transaction Value (Sum) by Item Description, Source Type (chart) | By default, this chart shows the transaction value of trade by item in each source type across quarters. The Group Dimension menu includes Item Description, Commodity Description, Source Type, Statistical Type, Movement Type, Destination Country, and Dispatch Country. The Dimension menu includes Statistical Type, Movement Type, Item Description, Commodity Description, Dispatch Country, and Destination Country. The metrics are Transaction Value (Sum) and Statistical Value (Sum). |
See Movement Statistics Dashboard.
Order Management Tab
The Order Management tab shows metrics and charts for the following source types:
-
Sales Order
-
Customer Return
Order Management Tab
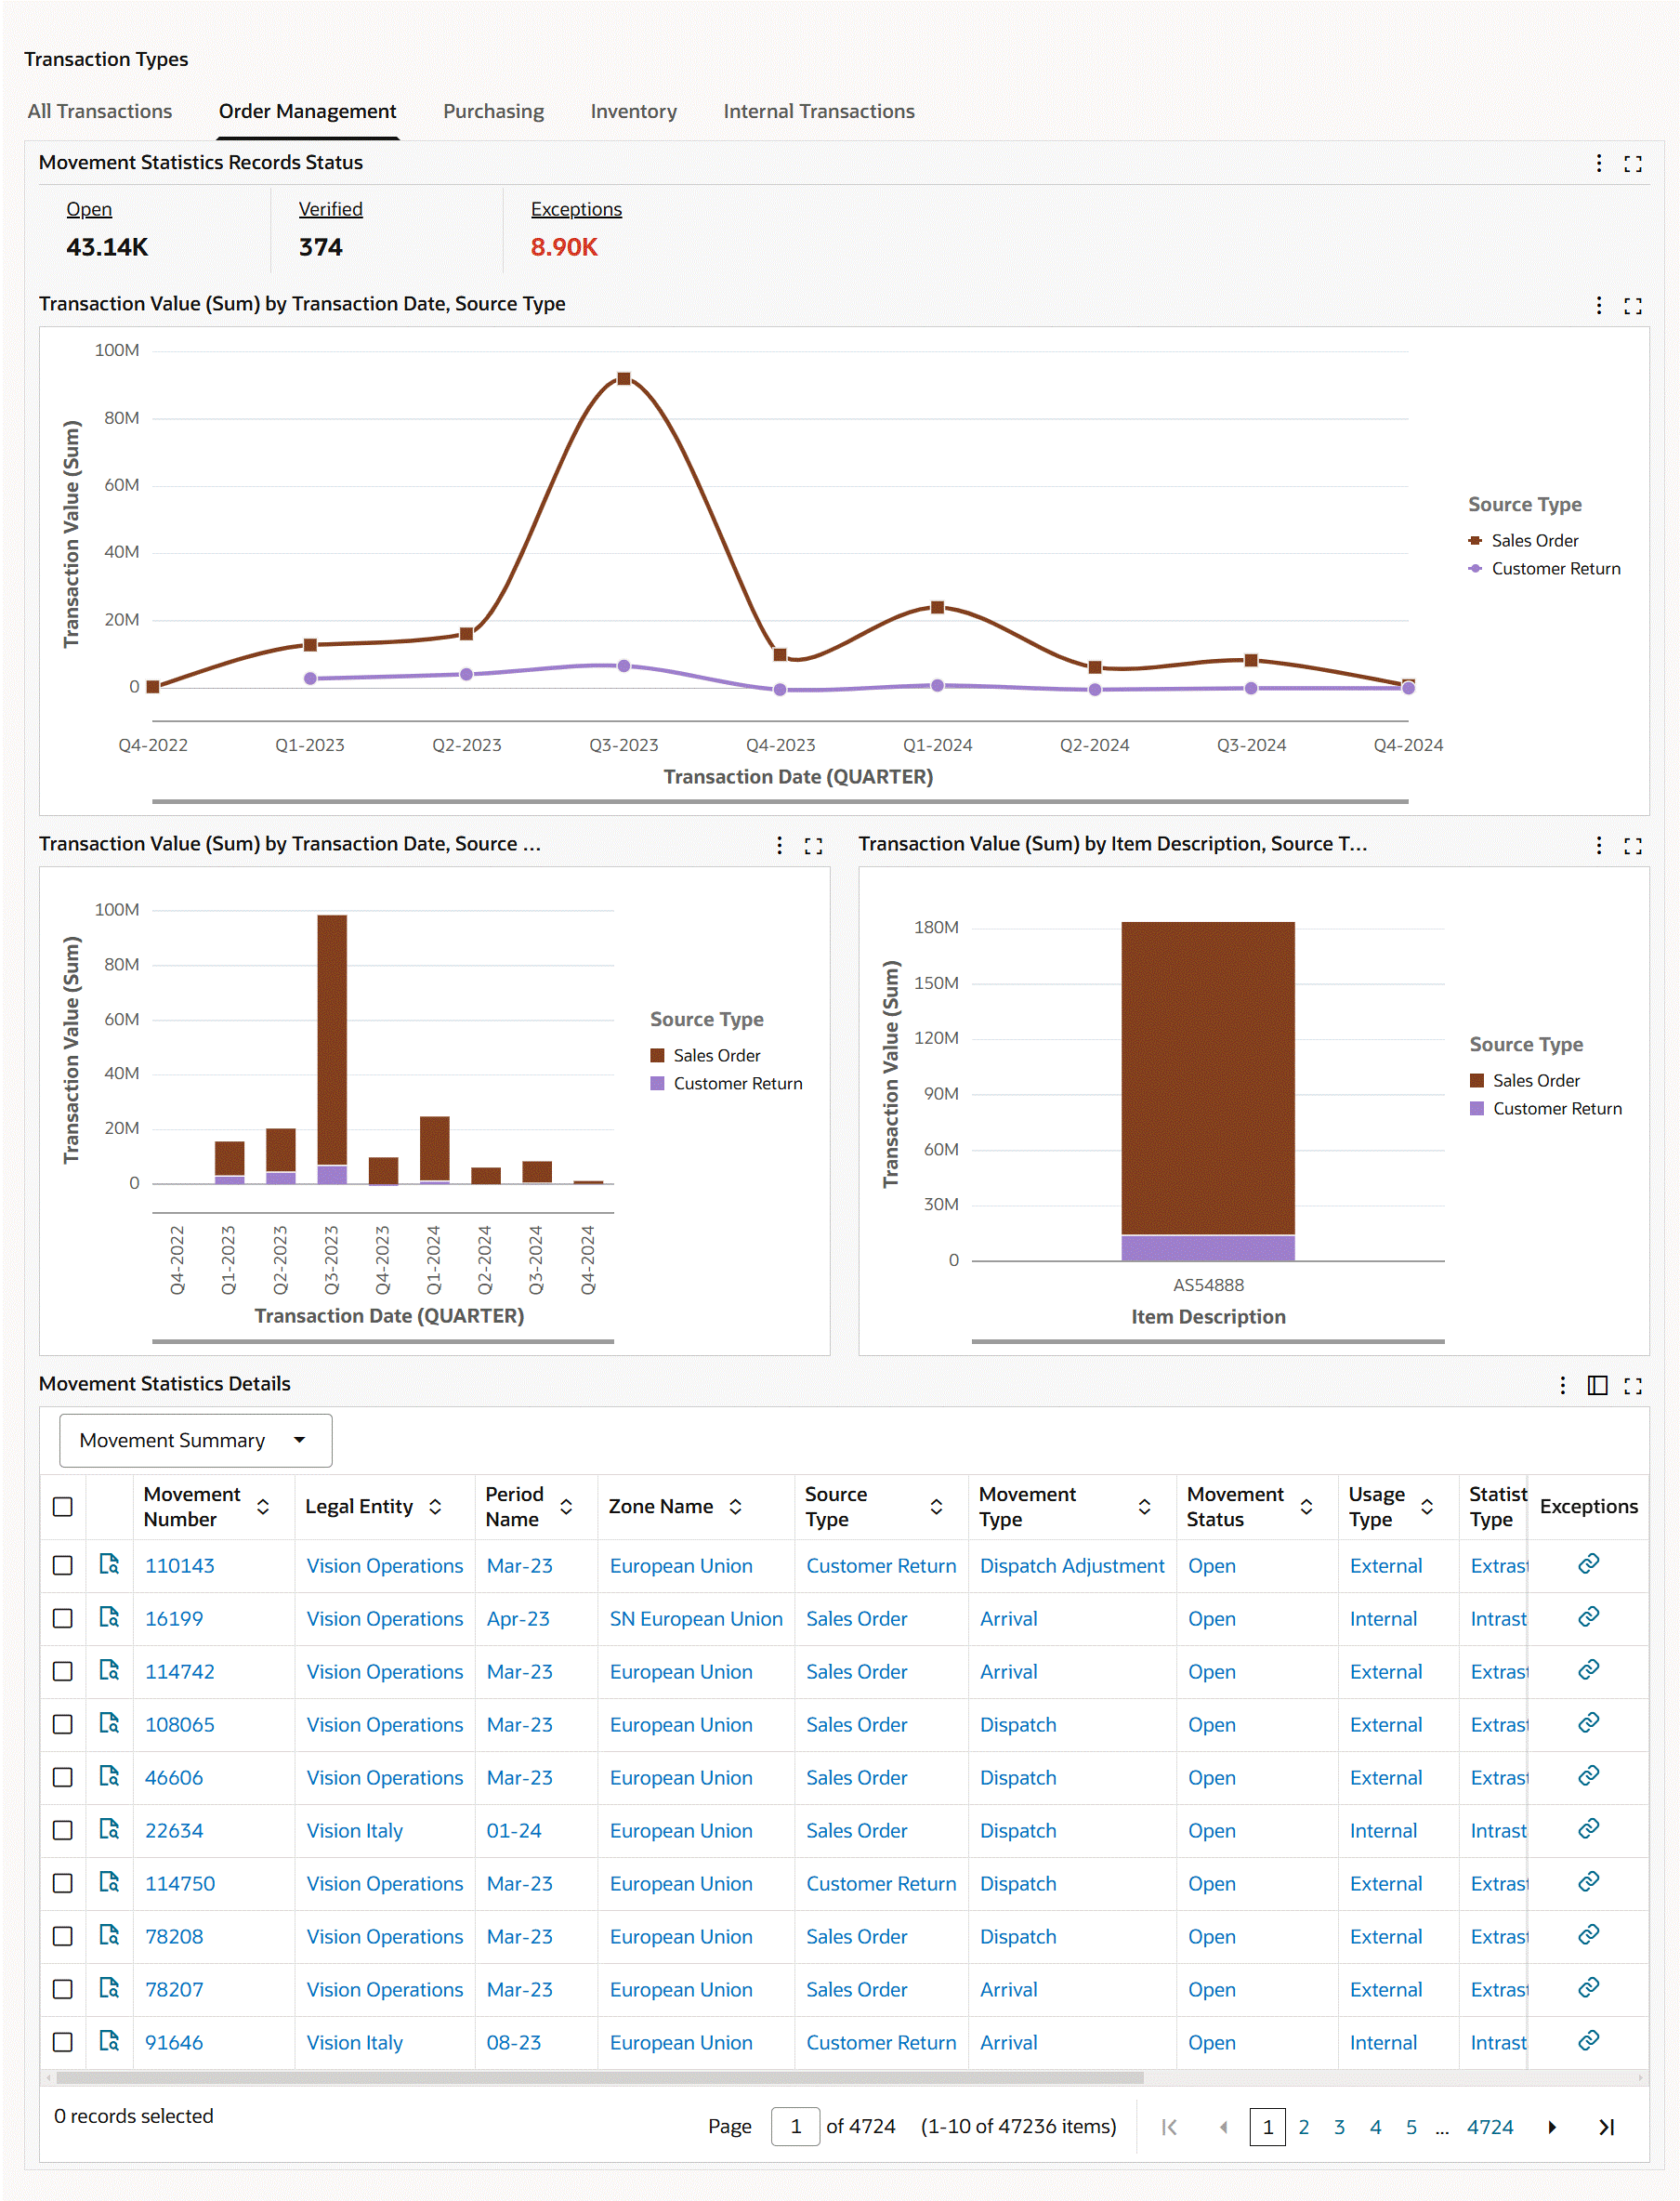
The following table describes the Order Management tab components:
| Components | Description |
|---|---|
| Movement Statistics Records Status (summary bar) | For details about the metrics, see Movement Statistics Records Status. |
| Transaction Value (Sum) by Transaction Date, Legal Entity (chart) | This chart displays divisional trade statistics. By default, the chart shows the transaction value of trade across quarters for legal entities. The Dimension menu includes Legal Entity and Source Type. The metrics are Transaction Value (Sum) and Statistical Value (Sum). By default, the time grain is set to quarterly, and you can change the time grain to daily, weekly, monthly, or yearly. |
| Transaction Value (Sum) by Transaction Date, Source Type (chart) | By default, this chart shows the transaction value for source types across quarters by transaction date. Select a different group dimension to view the transaction value for source types by invoice date. The Dimension menu includes Source Type, Statistical Type, Movement Type, Item Description, Commodity Description, Customer Name, and Customer Location. The metrics are Transaction Value (Sum) and Statistical Value (Sum). |
| Transaction Value (Sum) by Item Description, Source Type (chart) | By default, this chart shows the transaction value of trade by item in each source type across quarters. The Group Dimension menu includes Item Description, Commodity Description, Source Type, Statistical Type, Movement Type, Destination Country, Dispatch Country, Customer Name, and Customer Location. The Dimension menu includes Statistical Type, Movement Type, Item Description, Commodity Description, Dispatch Country, and Destination Country. The metrics are Transaction Value (Sum) and Statistical Value (Sum). |
See Movement Statistics Dashboard.
Purchasing Tab
The Purchasing tab shows metrics and charts for the following source types:
-
Purchase Order
-
Return To Vendor
Purchasing Tab
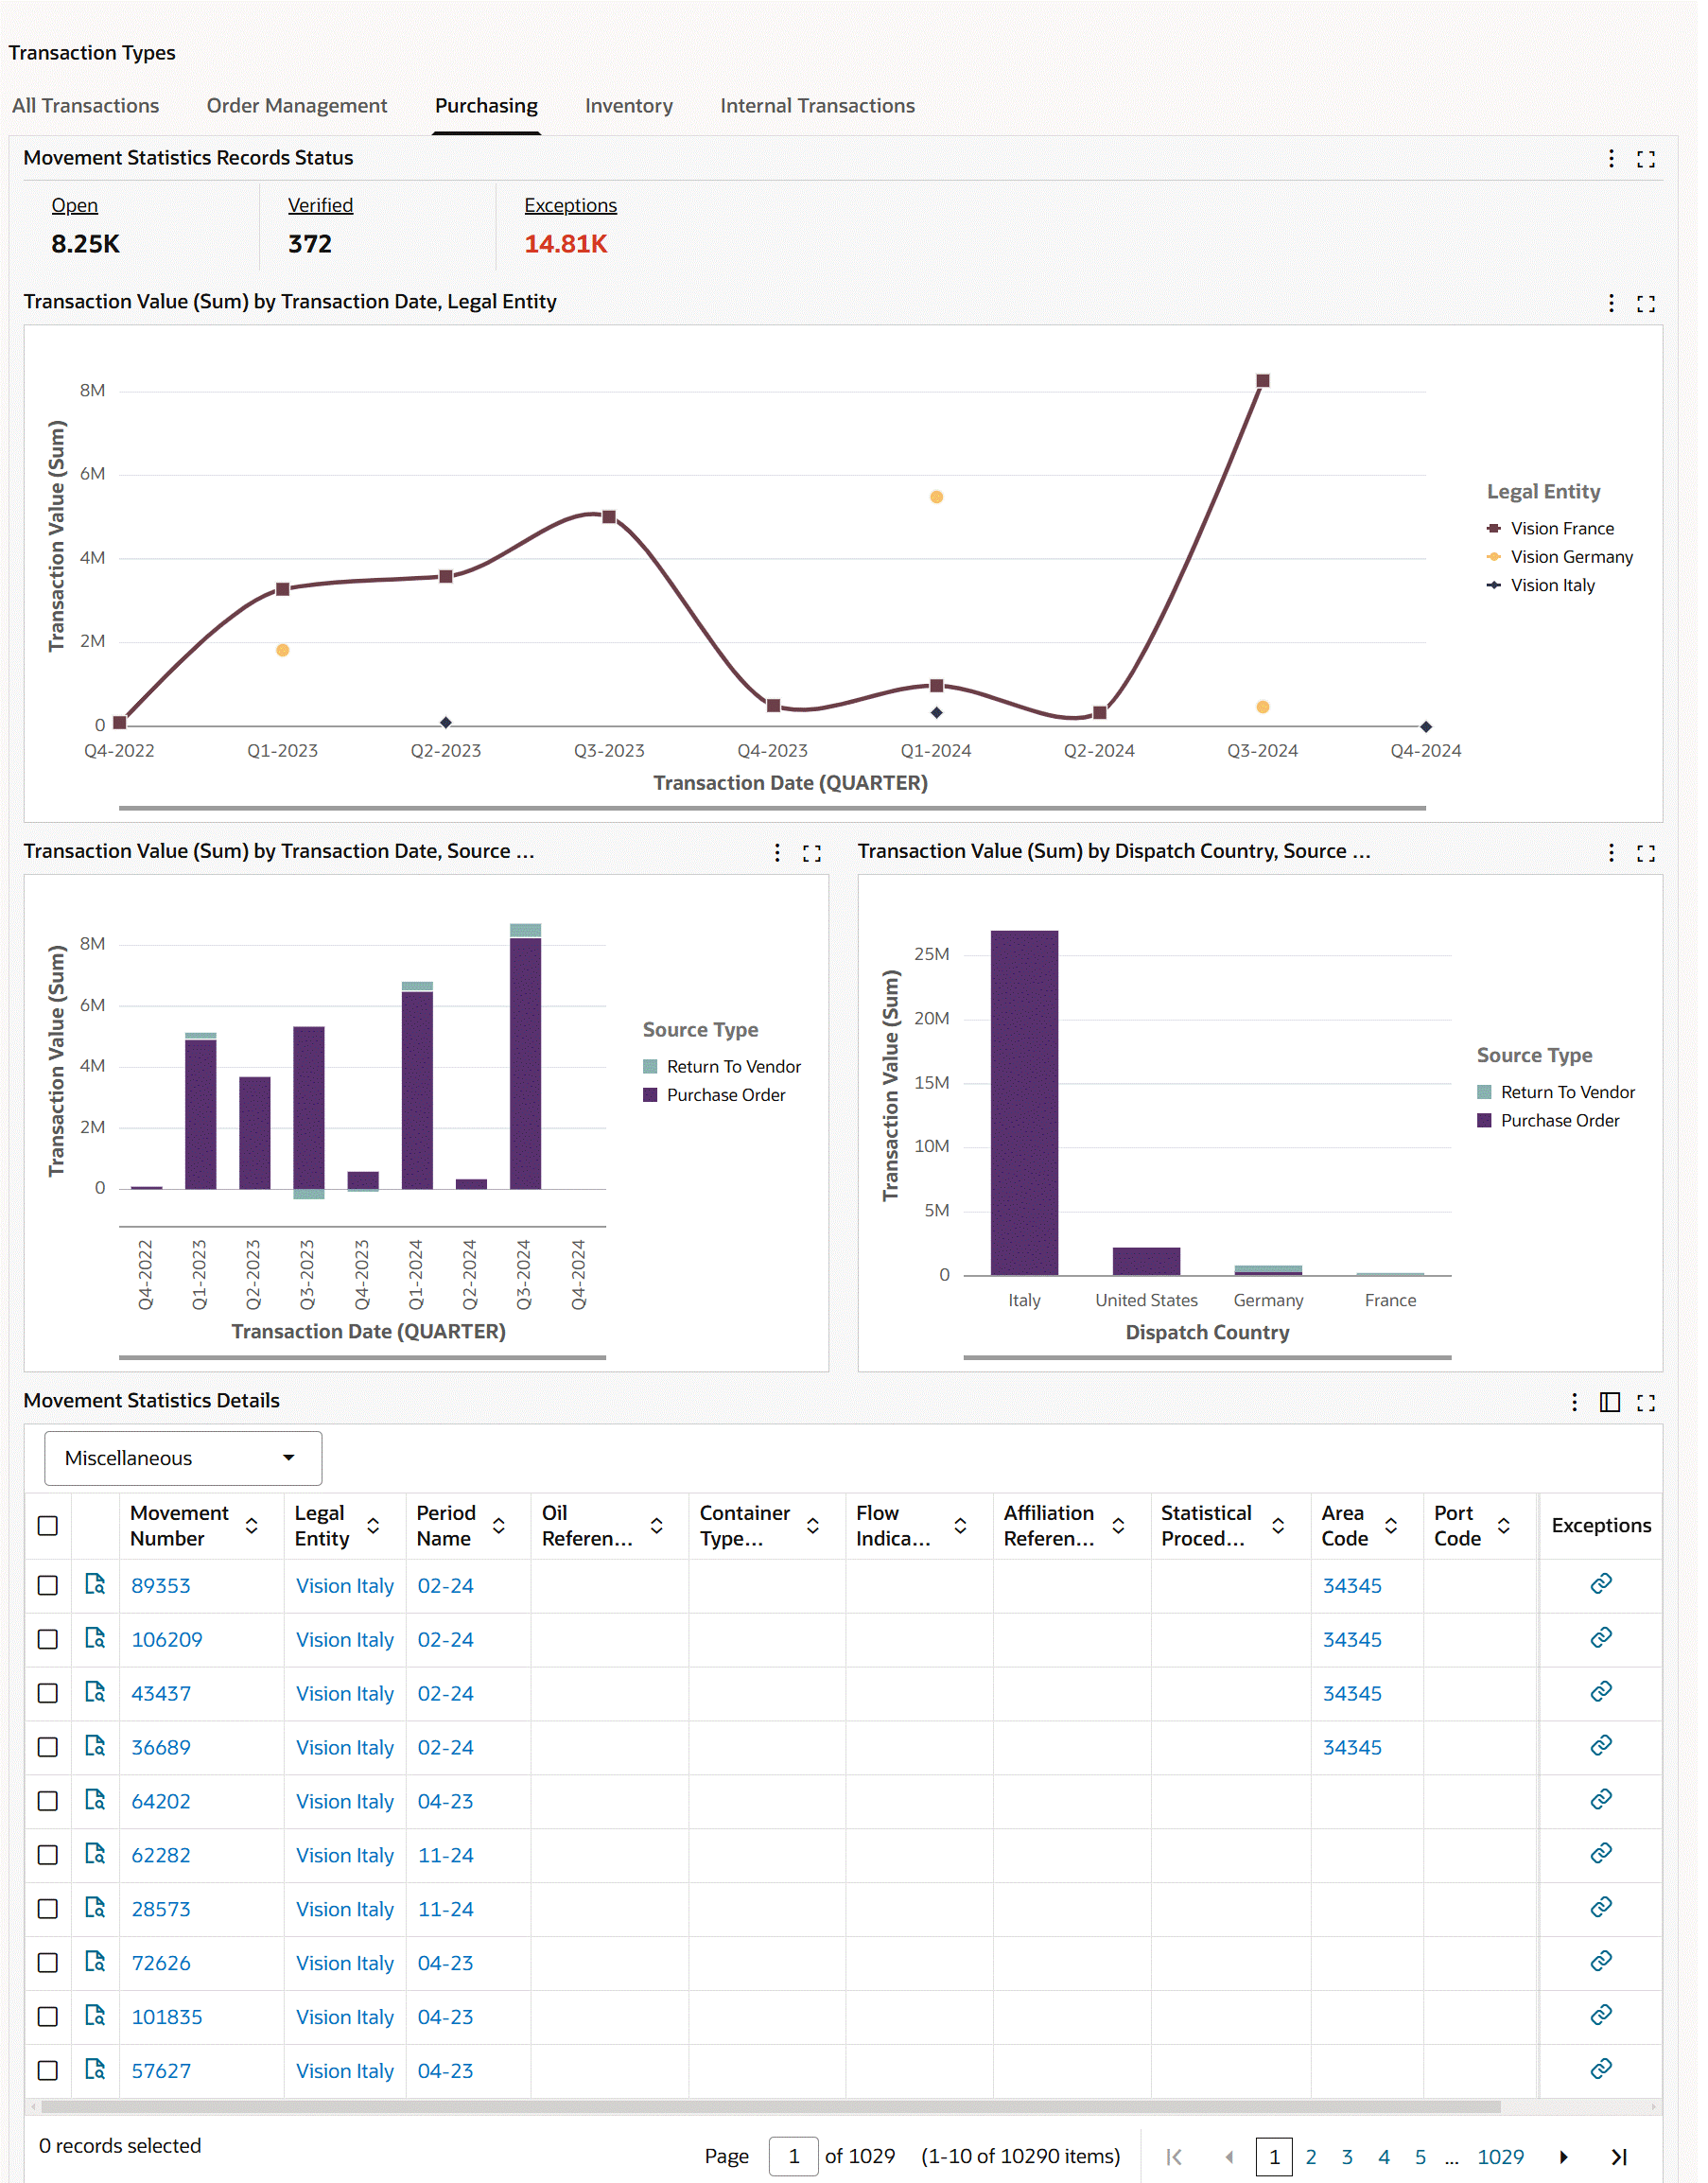
The following table describes the Purchasing tab components:
| Components | Description |
|---|---|
| Movement Statistics Records Status (summary bar) | For details about the metrics, see Movement Statistics Records Status. |
| Transaction Value (Sum) by Transaction Date, Legal Entity (chart) | This chart displays divisional trade statistics. By default, the chart shows the transaction value of trade across quarters for legal entities. The Dimension menu includes Legal Entity and Source Type. The metrics are Transaction Value (Sum) and Statistical Value (Sum). By default, the time grain is set to quarterly, and you can change the time grain to daily, weekly, monthly, or yearly. |
| Transaction Value (Sum) by Transaction Date, Source Type (chart) | By default, this chart shows the transaction value for source types across quarters by transaction date. Select a different group dimension to view the transaction value for source types by invoice date. The Dimension menu includes Source Type, Statistical Type, Movement Type, Item Description, Commodity Description, Destination Country, Dispatch Country, and Vendor Name. The metrics are Transaction Value (Sum) and Statistical Value (Sum). |
| Transaction Value (Sum) by Item Description, Source Type (chart) | By default, this chart shows the transaction value of trade by item in each source type across quarters. The Group Dimension menu includes Item Description, Commodity Description, Source Type, Statistical Type, Movement Type, Destination Country, Dispatch Country, and Vendor Name. The Dimension menu includes Source Type, Statistical Type, Movement Type, Item Description, Commodity Description, Dispatch Country, and Vendor Name. The metrics are Transaction Value (Sum) and Statistical Value (Sum). |
See Movement Statistics Dashboard.
Inventory Tab
The Inventory tab shows metrics and charts for the following source types:
-
Inventory
-
Inventory Return
Inventory Tab
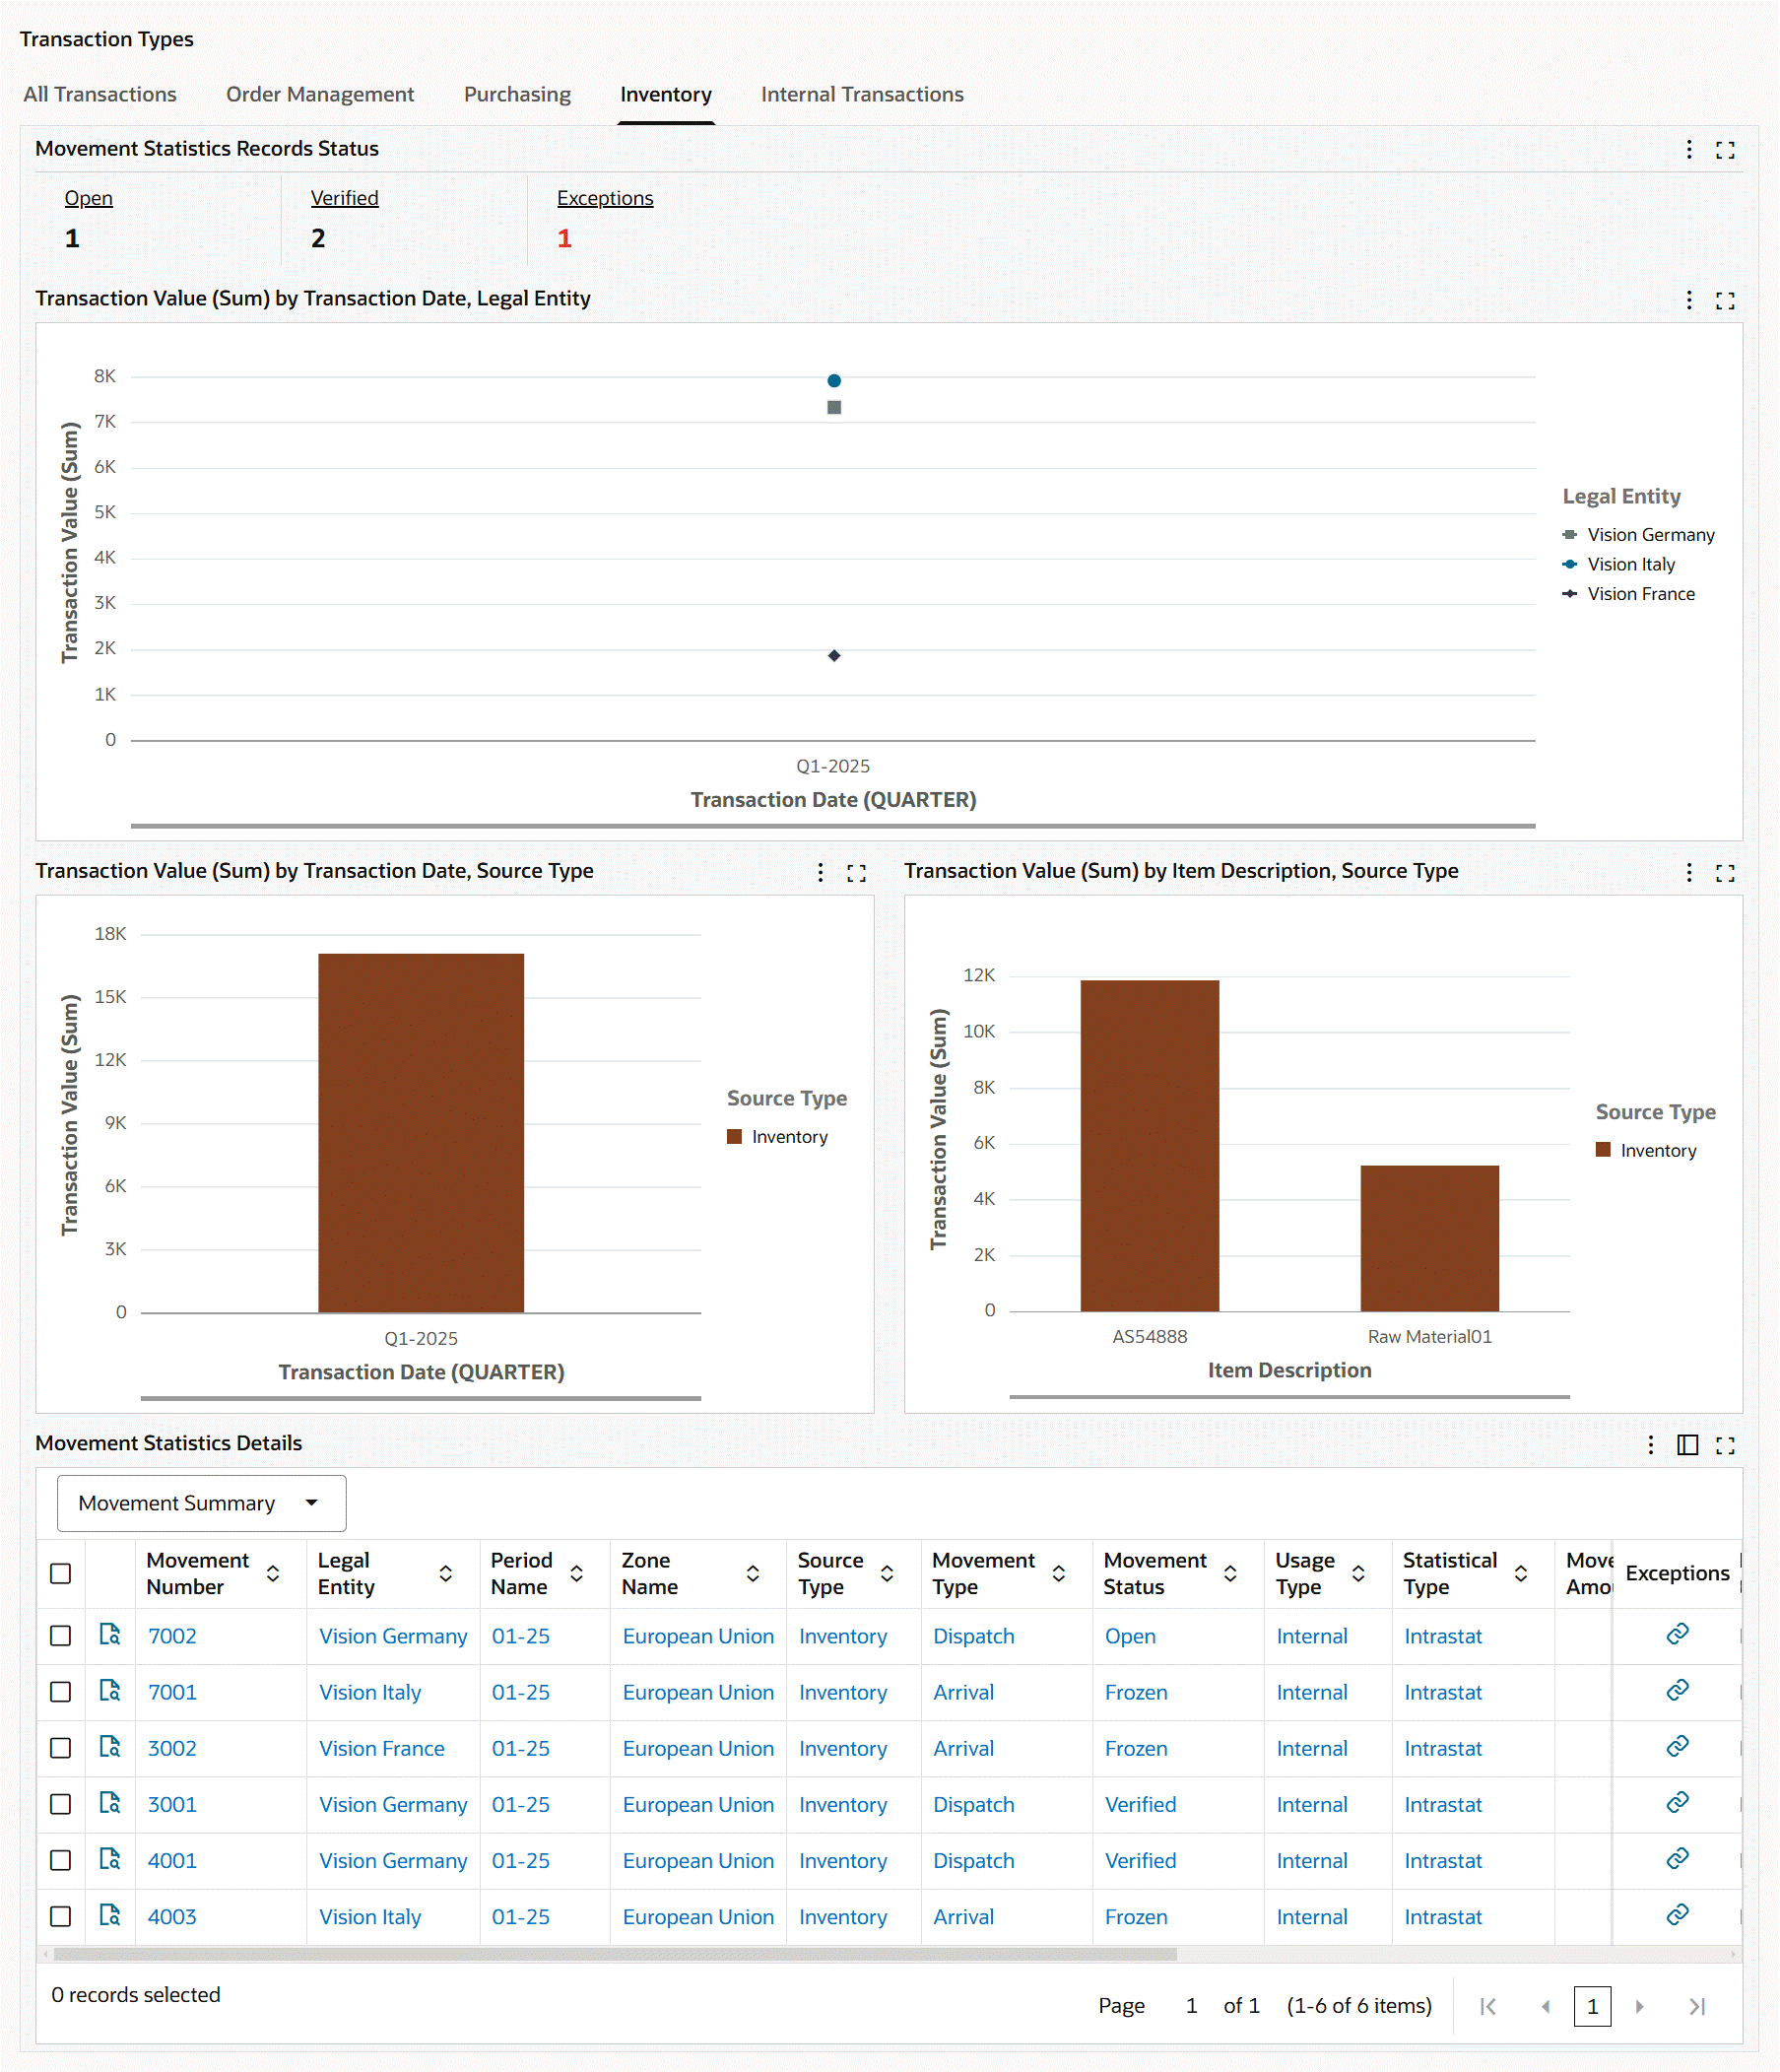
The following table describes the Inventory tab components:
| Components | Description |
|---|---|
| Movement Statistics Records Status (summary bar) | For details about the metrics, see Movement Statistics Records Status. |
| Transaction Value (Sum) by Transaction Date, Legal Entity (chart) | This chart displays divisional trade statistics. By default, the chart shows the transaction value of trade across quarters for legal entities. The Dimension menu includes Legal Entity and Source Type. The metrics are Transaction Value (Sum) and Statistical Value (Sum). By default, the time grain is set to quarterly, and you can change the time grain to daily, weekly, monthly, or yearly. |
| Transaction Value (Sum) by Transaction Date, Source Type (chart) | By default, this chart shows the transaction value for source types across quarters by transaction date. Select a different group dimension to view the transaction value for source types by invoice date. The Dimension menu includes Source Type, Statistical Type, Movement Type, Item Description, Commodity Description, Destination Country, Dispatch Country, From Organization, and To Organization. The metrics are Transaction Value (Sum) and Statistical Value (Sum). |
| Transaction Value (Sum) by Item Description, Source Type (chart) | By default, this chart shows the transaction value of trade by item in each source type across quarters. The Group Dimension menu includes Item Description, Commodity Description, Source Type, Statistical Type, Movement Type, Destination Country, Dispatch Country, From Organization, and To Organization. The Dimension menu includes Source Type, Statistical Type, Movement Type, Item Description, Commodity Description, Destination Country, Dispatch Country, From Organization, and To Organization. The metrics are Transaction Value (Sum) and Statistical Value (Sum). |
See Movement Statistics Dashboard.
Internal Transactions Tab
The Internal Transactions tab shows metrics and charts for the following source types:
-
Internal Order
-
Internal Return
Internal Transactions Tab
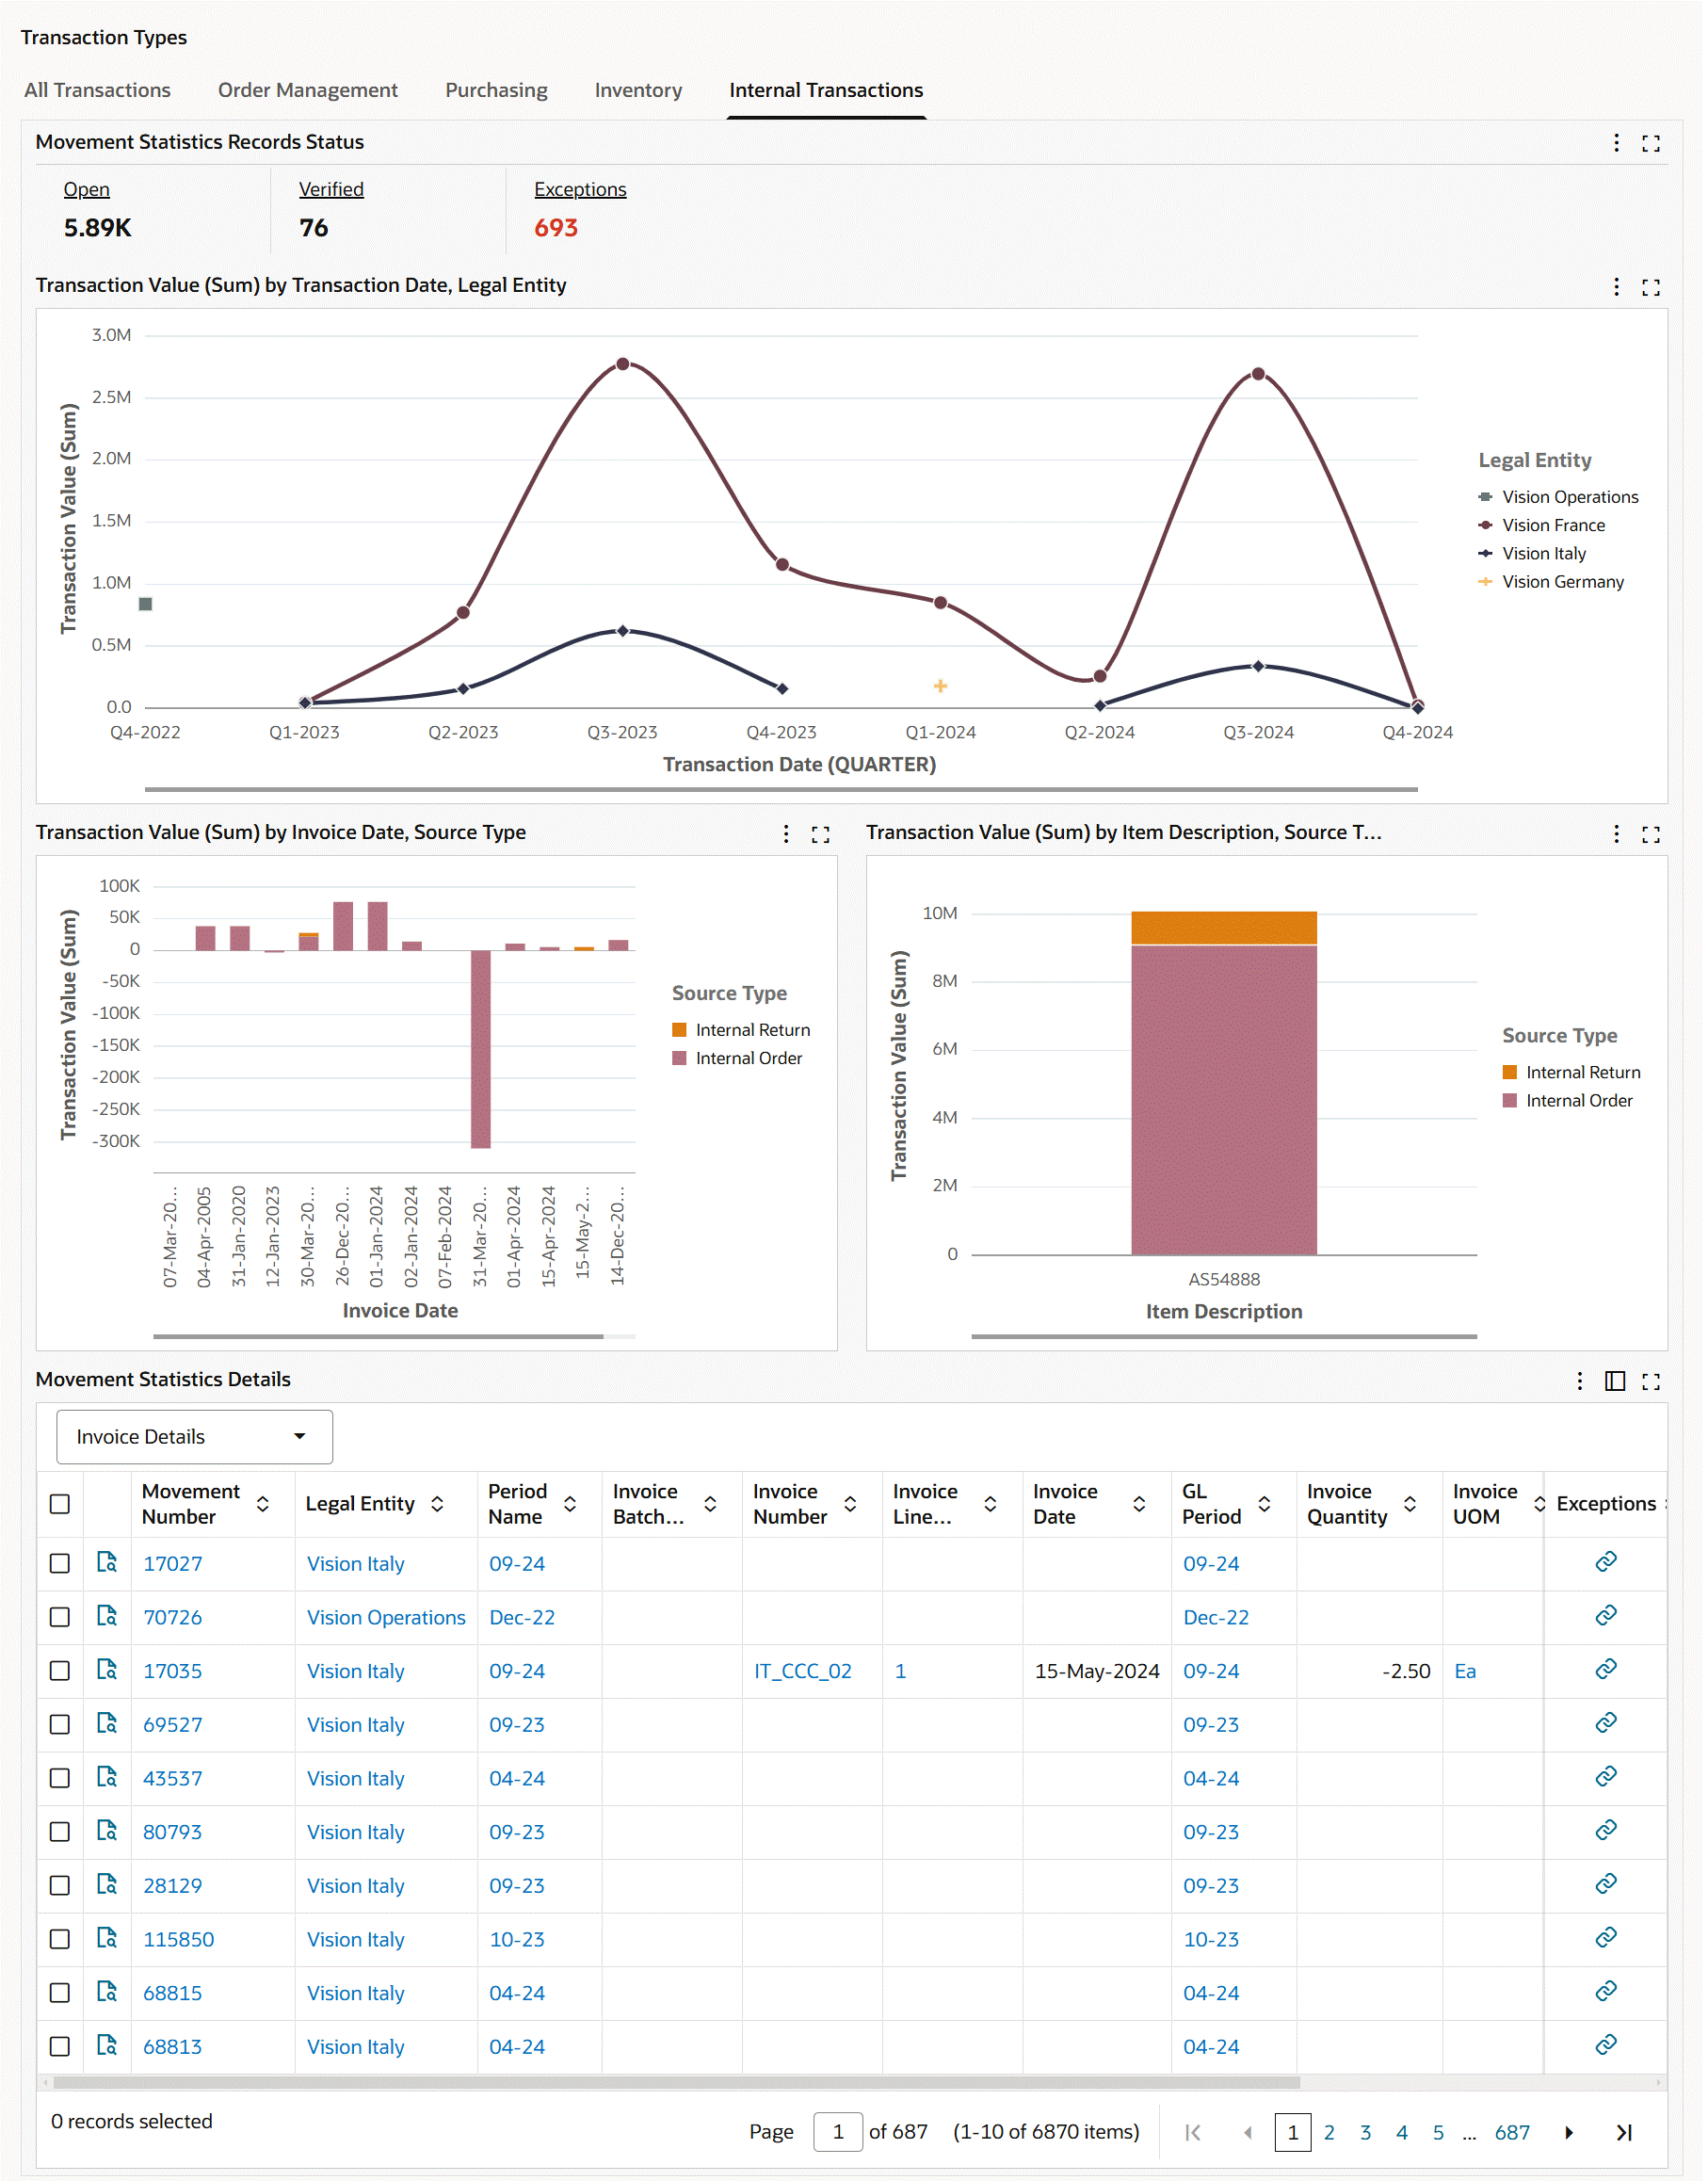
The following table describes the Internal Transactions tab components:
| Components | Description |
|---|---|
| Movement Statistics Records Status (summary bar) | For details about the metrics, see Movement Statistics Records Status. |
| Transaction Value (Sum) by Transaction Date, Legal Entity (chart) | This chart displays divisional trade statistics. By default, the chart shows the transaction value of trade across quarters for legal entities. The Dimension menu includes Legal Entity and Source Type. The metrics are Transaction Value (Sum) and Statistical Value (Sum). By default, the time grain is set to quarterly, and you can change the time grain to daily, weekly, monthly, or yearly. |
| Transaction Value (Sum) by Transaction Date, Source Type (chart) | By default, this chart shows the transaction value for source types across quarters by transaction date. Select a different group dimension to view the transaction value for source types by invoice date. The Dimension menu includes Source Type, Statistical Type, Movement Type, Item Description, Commodity Description, Destination Country, Dispatch Country, From Organization, To Organization, Customer Name, and Customer Location. The metrics are Transaction Value (Sum) and Statistical Value (Sum). |
| Transaction Value (Sum) by Item Description, Source Type (chart) | By default, this chart shows the transaction value of trade by item in each source type across quarters. The Group Dimension menu includes Item Description, Commodity Description, Source Type, Statistical Type, Movement Type, Destination Country, Dispatch Country, From Organization, To Organization, Customer Name, and Customer Location. The Dimension menu includes Source Type, Statistical Type, Movement Type, Item Description, Commodity Description, Destination Country, Dispatch Country, From Organization, To Organization, Customer Name, and Customer Location. The metrics are Transaction Value (Sum) and Statistical Value (Sum). |
See Movement Statistics Dashboard.
Movement Statistics Details Results Table
The Movement Statistics Details table shows information for movement records based on the selection of an attribute group. For all the attribute groups, the common columns are Movement Number, Legal Entity, and Period Name.
Movement Statistics Details Table
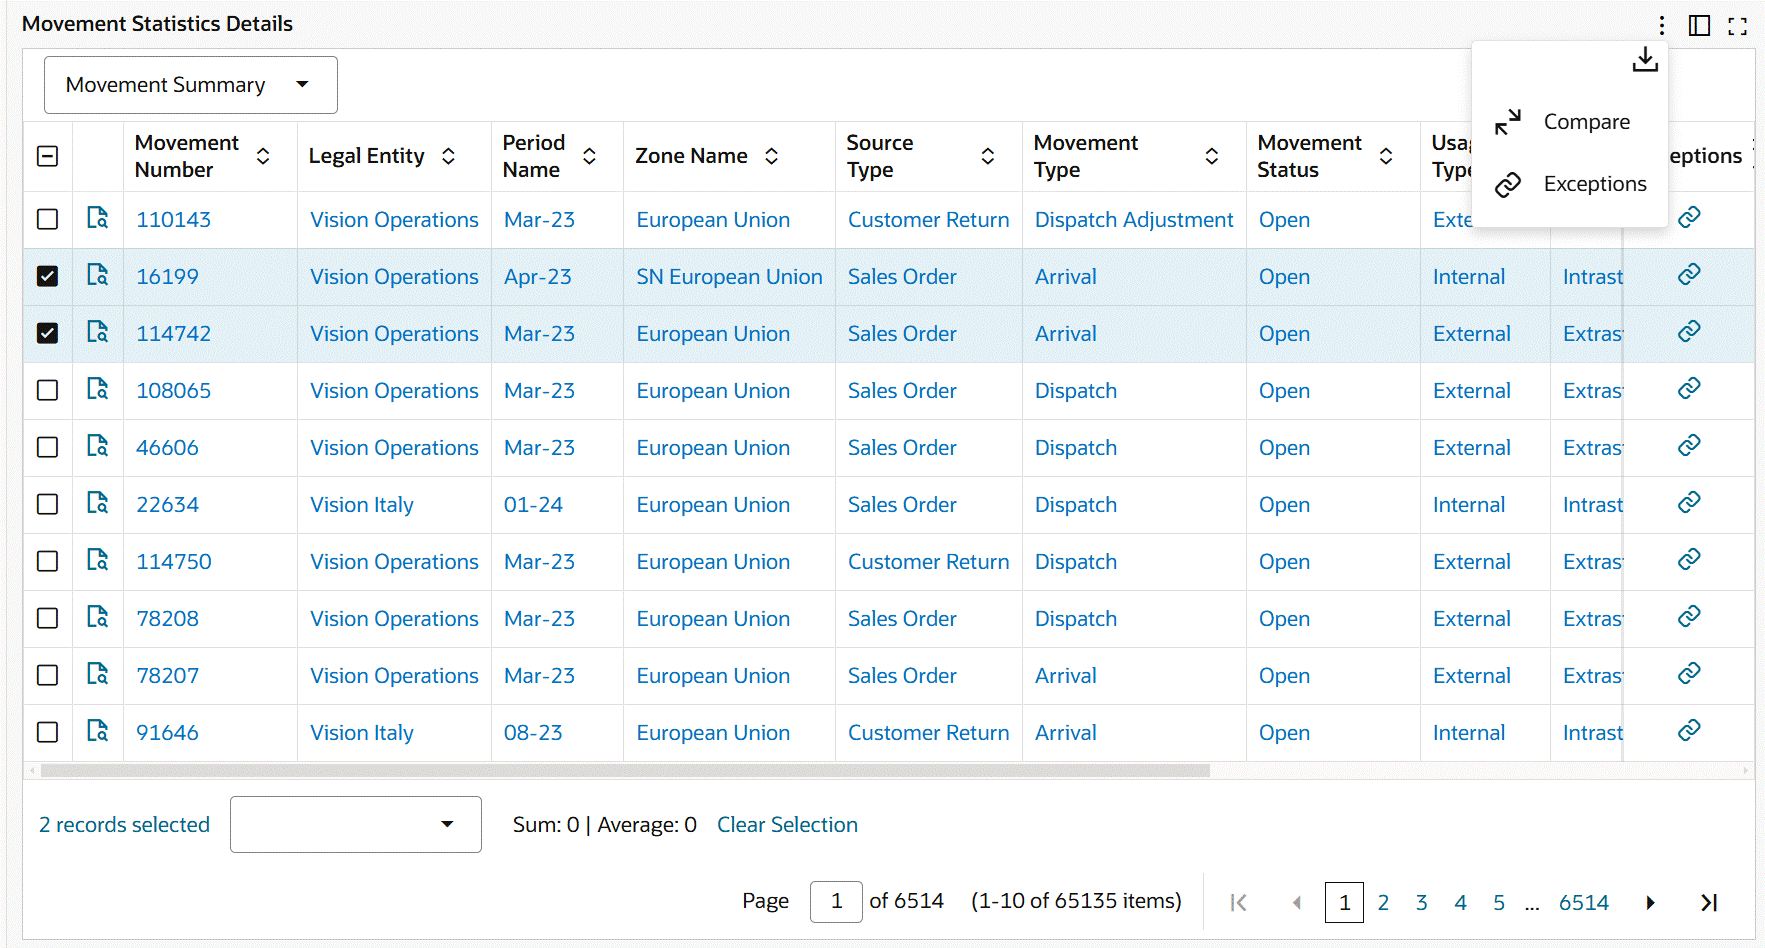
Note: The movement statistics information that you view in these attributes is defined in Oracle Inventory, Movement Statistics Summary window. See: Viewing and Maintaining Movement Statistics, Oracle Inventory User's Guide.
You can select from the following attribute groups to display details by:
-
Movement Summary
-
Movement Details
-
Country Details
-
Source Details: The source details that you view depend on the Source Type.
-
Invoice Details: This attribute group is not available for the Inventory source type.
-
Additional Details
-
Miscellaneous
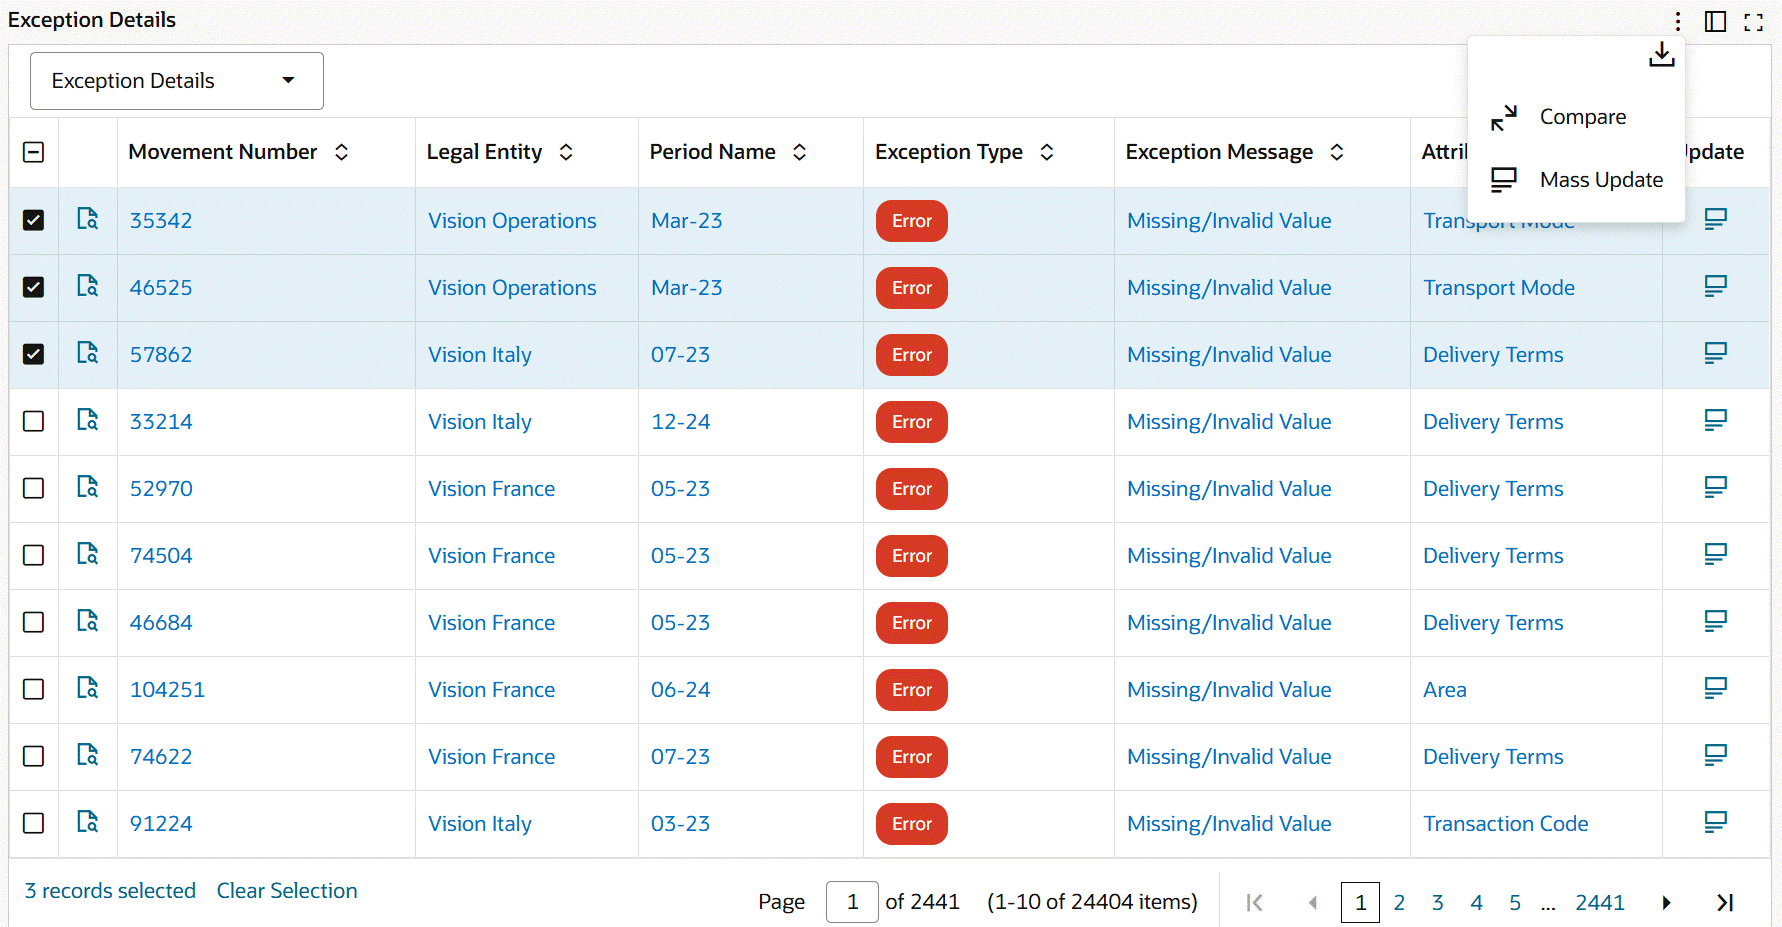
Performing Row-Level and Table Level Actions
The following row-level and table-level actions are available:
-
Compare (table-level action): Select multiple rows to compare information.
-
Export (table-level action): Click the Export icon to export the selected search results in a comma-separated values (CSV) file format.
-
Exceptions: In the results table, the Exceptions action link is available at the row-level and table-level for movement records. When you click the link, the Exceptions dashboard opens with the record or records in context. You can review the exception details such as the exception and exception message. See Exceptions Dashboard.
See Movement Statistics Dashboard.
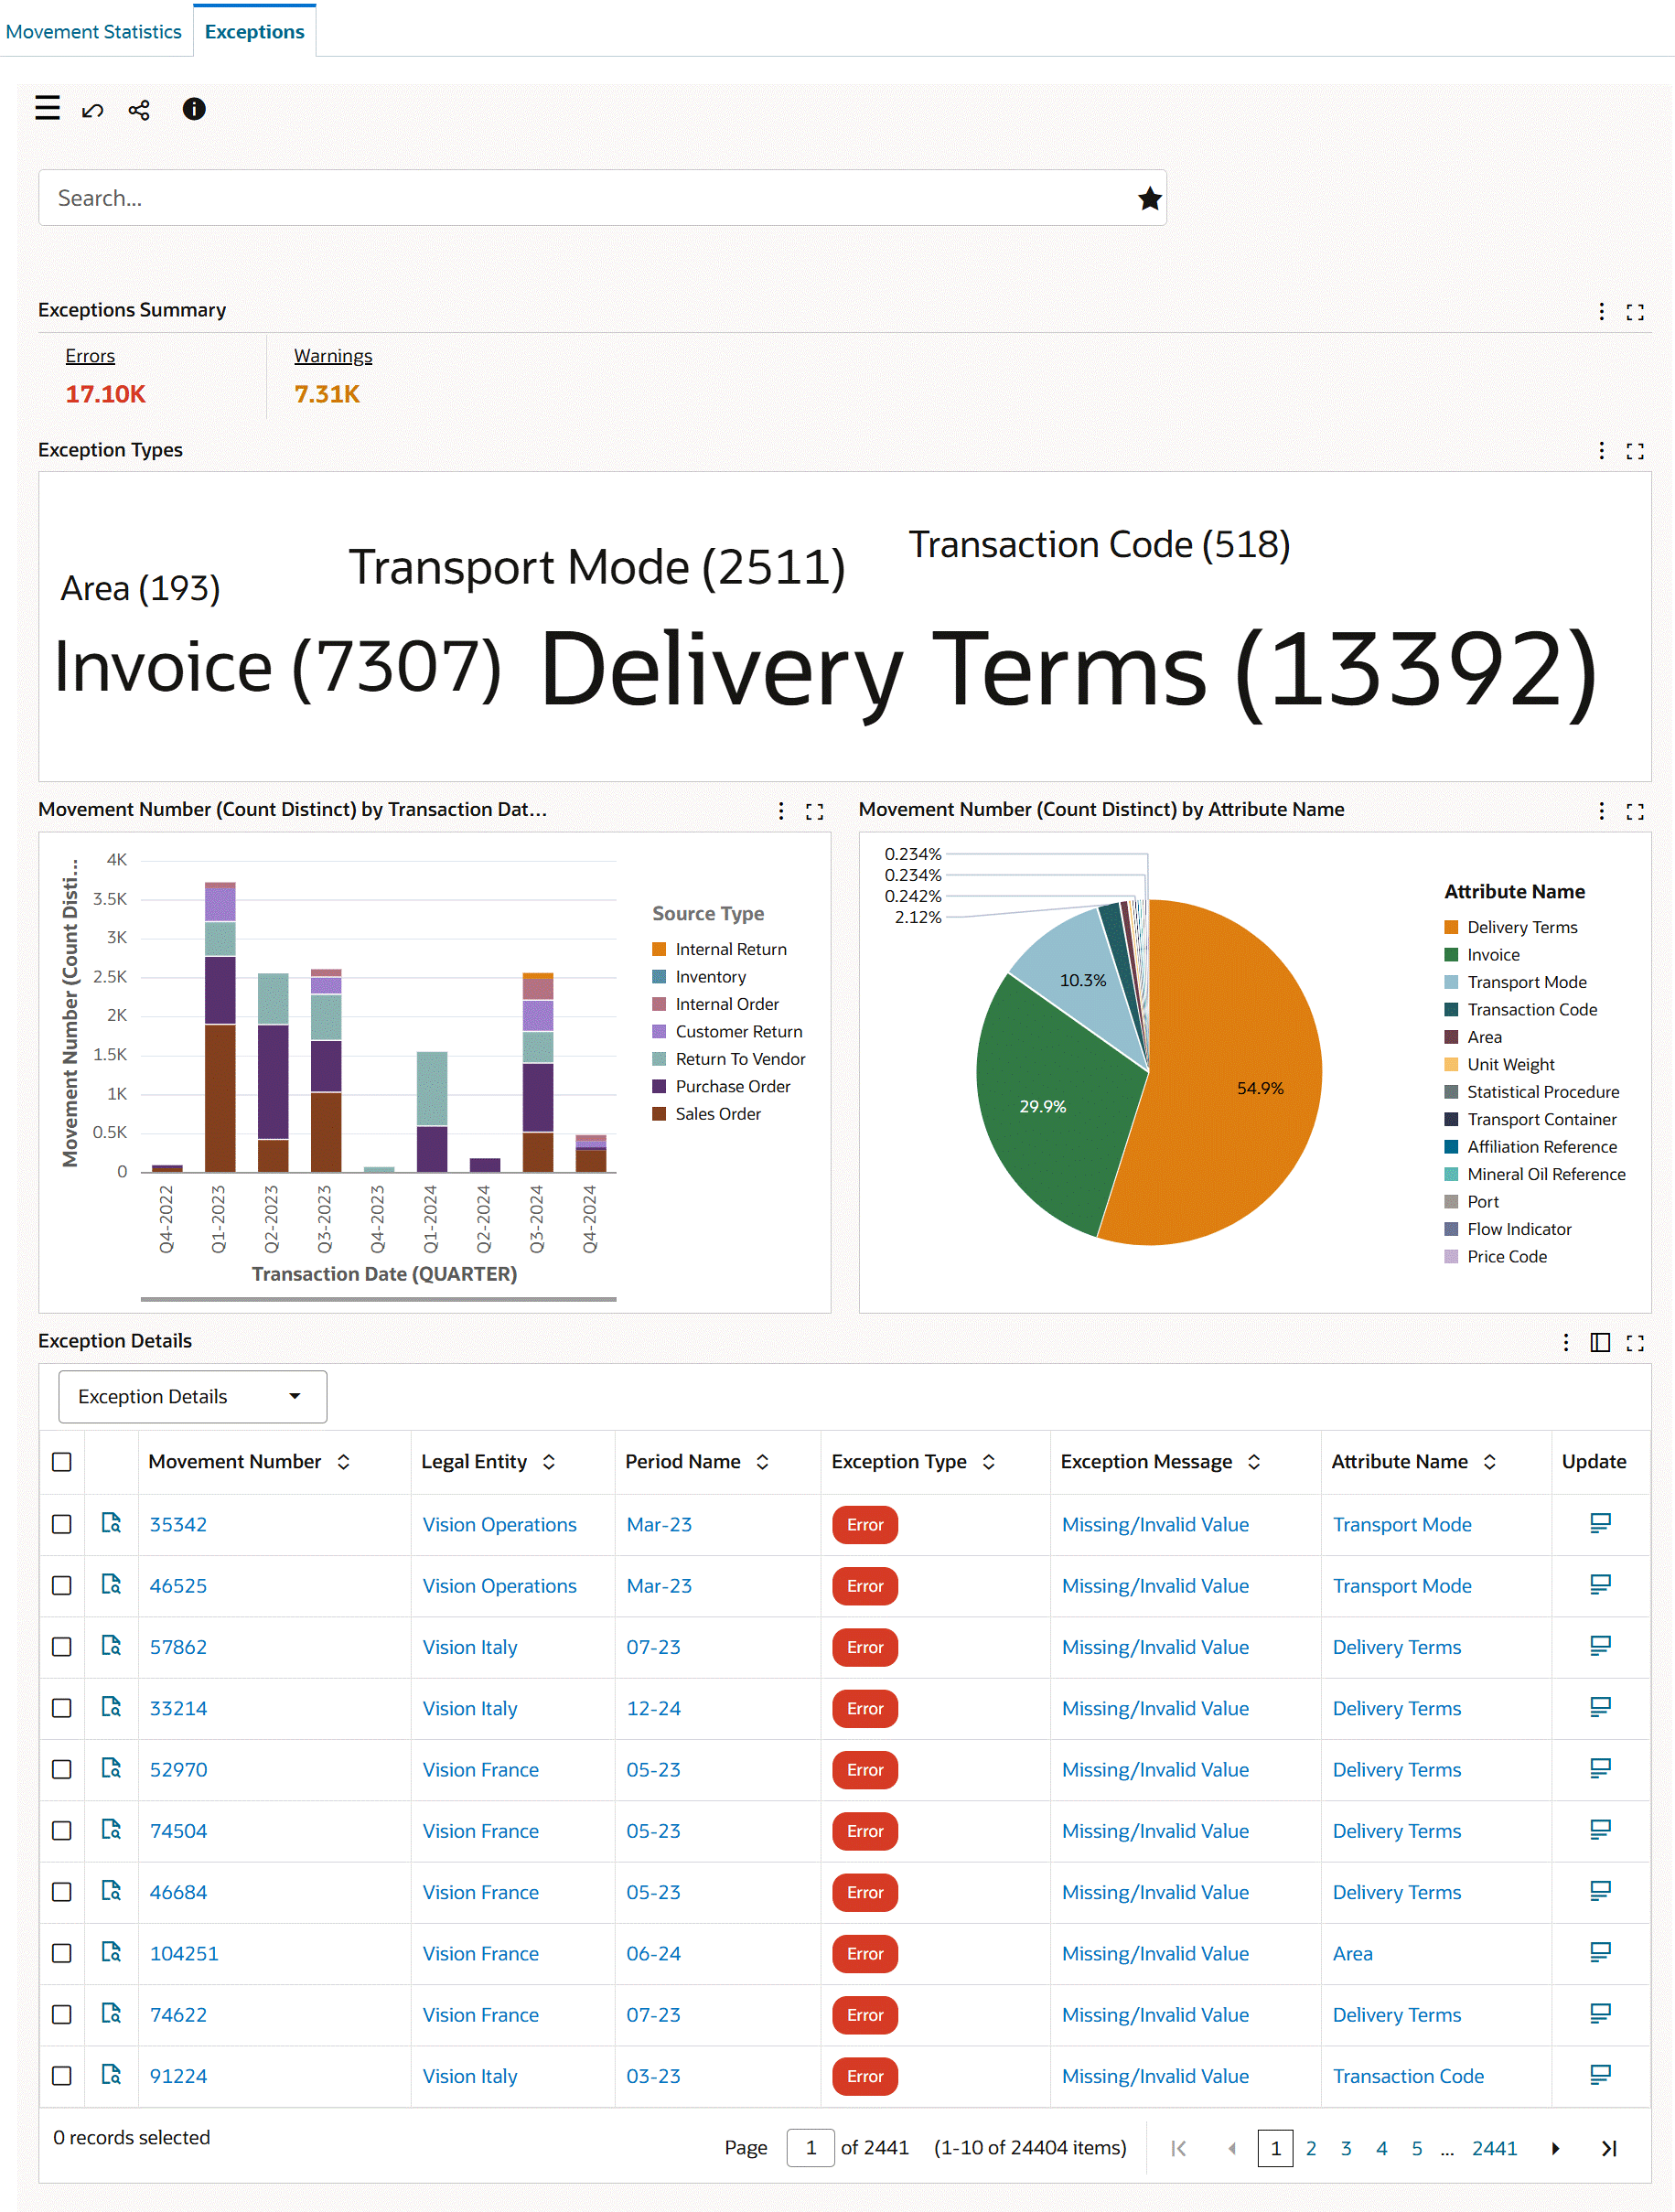
Exceptions Dashboard
See Inventory Management Command Center Overview, Oracle Inventory User's Guide.
The Exceptions dashboard is an operational dashboard that provides exception resolution process for movement records.
Use the dashboard to:
-
Review errors and warnings by period, source type, and exception type.
-
Manage trade movement exceptions.
-
Review errors.
-
Resolve an exception error or multiple exception errors at a time.
-
Access the Exceptions dashboard using the following navigation:
(N) Inventory (responsibility) > Transactions > Movement Statistics Dashboards
Exceptions Dashboard
Exception Details - Row-Level Actions
The following table describes the Exceptions dashboard components:
| Components | Description |
|---|---|
| Exceptions Summary (metrics) | The Exceptions Summary bar presents the following key metrics. Click the metric link to refine the dashboard data.
|
| Exception Types (tag cloud) | This tag cloud provides an overview of attributes with errors and warnings. This tag cloud shows attributes and the number of movement records with incorrect or missing values for attributes. For example, two tag clouds, Delivery Terms (2) and Commodity Code (4) mean that there are two movement records with incorrect or missing value for the Delivery Terms attribute and four movement records with missing value for the Commodity Code attribute. The tag cloud component displays the attributes in relative sizes based on the number of records with errors or warnings. Click a tag cloud to filter based on the relevant tag cloud and review the error exception type in the Exception Details table. |
| Movement Number (Count Distinct) By Transaction Date, Source Type (chart) | By default, this chart shows the number of movement records with exceptions by source type across quarters. You can select a different dimension to plot the chart by exception type, exception name, exception message, and attribute name. You can change the time grain to daily, weekly, monthly, or yearly. |
| Movement Number (Count Distinct) By Attribute Name (pie chart) | This pie chart shows the percentage of attributes with errors. Use this pie chart to identify the attributes that contribute to most of the exception errors. The hover text for each segment displays the attribute name and the number of records with the incorrect attribute value. |
| Exception Details (results table) | The Exception Details table contains the following attribute groups to examine exception details:
Important: If a movement record has multiple exceptions, then each exception appears in a separate row. Performing Actions
Important: After you fix errors, updates to the dashboards happen in real time.
|