Oracle Employee Expenses Command Center
This chapter covers the following topics:
Employee Expenses Command Center
Employee Expenses Command Center Overview
The Oracle Employee Expenses Command Center presents line managers or supervisors with complete data of expenses that employees submit through Oracle Internet Expenses. Use the metrics and graphs of the command center to track and manage employee expenses in your organization.
The command center enables you to:
-
Gain insights into employee spending habits.
-
Get better understanding of how department employees are spending money.
-
Identify areas where spending can be reduced or optimized.
-
-
Control department budget.
-
Track department expenses and stay within the budget.
-
-
Track expense patterns.
-
Track spending trends over time.
-
Identify areas where spending is increasing or decreasing.
-
The Employee Expenses Command Center includes the Employee Expenses dashboard to enable you to review employee expenses in your organization.
Note: You can use the Employee Expenses Command Center only after the installation and common configurations are completed as described in My Oracle Support Knowledge Document 2495053.1, Installing Oracle Enterprise Command Center Framework, Release 12.2. For additional ECC Overview information, see Overview of Enterprise Command Center Framework, Oracle E-Business Suite User's Guide.
Searching Enterprise Command Center Dashboards
To search for and refine (filter) the data on a dashboard, you can select a value from the Available Refinements component, or you can use the Search field to find a keyword, a value, or a specific record. When you submit a search, or select an available refinement, the search term or refinement is added to the Selected Refinements list, and all of the dashboard data is refined. You can add multiple refinements and remove any of them at any time. Use Saved Search to create and save your search. You can edit, delete, or refer to this saved search.
Use an asterisk (*) or a percent sign (%) to perform a partial keyword or record search that matches any string of zero or more characters. You can also use a question mark (?) to perform a partial search that matches any single character.
Additional Information: For more information about searching for and refining data in enterprise command centers, see Search in Highlights of an Enterprise Command Center, Oracle E-Business Suite User's Guide.
Employee Expenses Dashboard
See Employee Expenses Command Center Overview.
The Employee Expenses dashboard is an operational dashboard to enable to you to monitor employee expenses in your organization and to identify anomalies.
Use the dashboard to:
-
Review expenses for your organization and individual employees.
-
View the total expense amounts.
-
Identify the top spender in your organization.
-
Identify the top employee with highest expense policy violations across expense categories.
-
Identify the top policy violation reason.
-
Identify the expense item for which the highest expense amount is reported.
-
-
Use the actions on the network diagram to perform expense analysis for your organization and individual employees.
-
Identify the expenses trend by each expense item for a date range.
-
Gain insight into expenses for expense categories and for cost centers.
-
Identify the top spenders and top policy violators in each expense category.
-
Find the top spenders and top policy violators in each cost center.
-
-
-
Identify expense reports that are pending approval and follow-up on the approval process.
Access the Employee Expenses dashboard using the following navigation:
(N) Manager Self Service - Employee Expenses (responsibility) > Employee Expenses Command Center
Default Filters
When you navigate to the Employee Expenses dashboard, the Search text box displays the following predefined filters:
-
Employee Name: Shows the logged in user's (supervisor) name. The organization hierarchy is prefiltered by the hierarchy of the supervisor who logs in.
-
Expense Report Date: Shows the From and To dates for the last 30 days. These dates are dynamic. The dashboard prefilters expenses data by the last 30 days.
Important: If no data is available for the last 30 days or if you remove the predefined filters, then the dashboard displays data for the number of fiscal years that is set in the AP: Employee Expenses Historical Range for ECC profile option.
Employee Expenses Dashboard
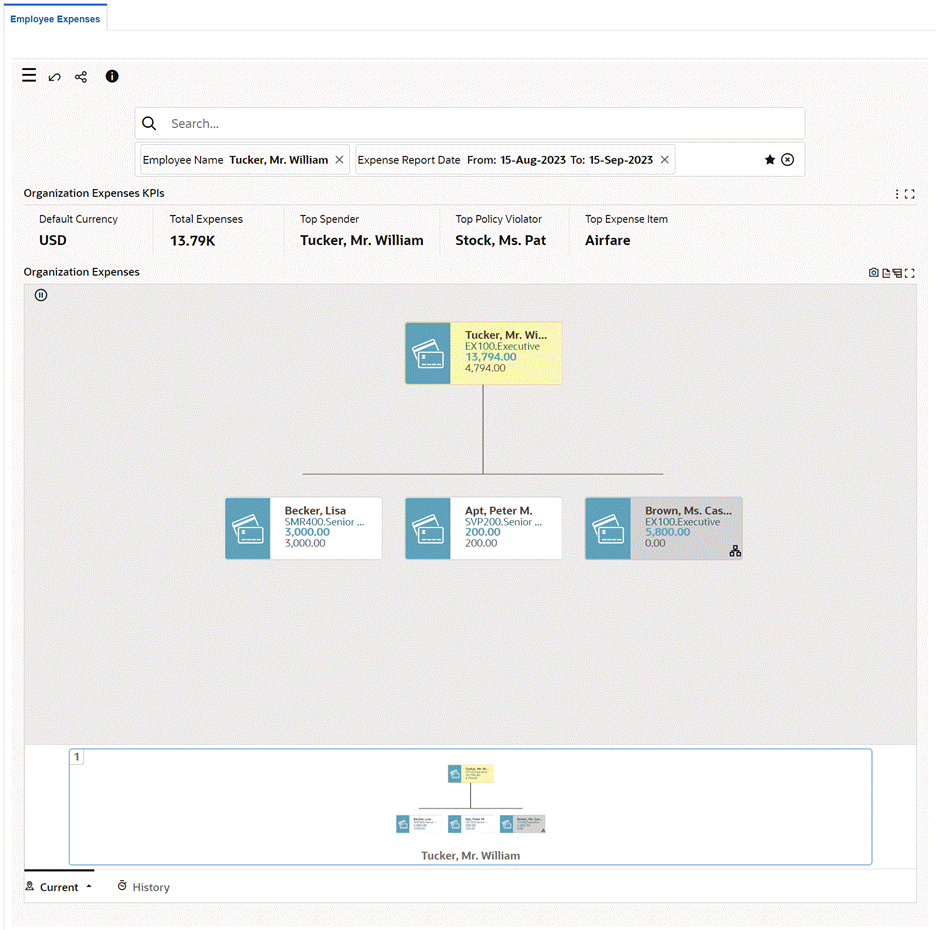
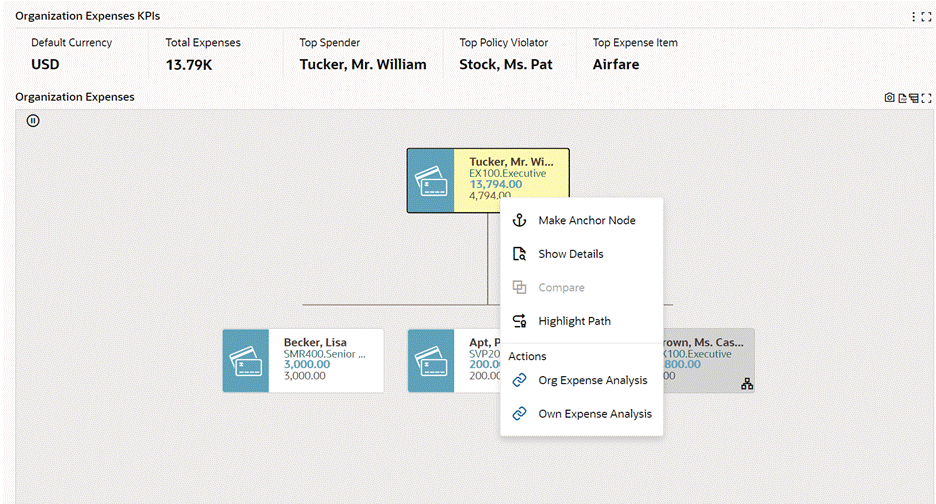
Organization Expenses Network Diagram: Node Actions
The following table describes the components of the dashboard:
| Component | Description |
|---|---|
| Organization Expenses KPIs (summary bar) | This summary bar lists the following key metrics to analyze employee expenses in the logged in supervisor's organization.
|
| Organization Expenses (network diagram) | The network diagram displays a hierarchical view of the supervisor's hierarchy. Each node in the network diagram shows the following information:
A hierarchy icon on a node indicates that a reporting hierarchy exists for an employee. When you click the hierarchy icon, the Search text box displays the selected employee's name, and the network diagram node is refreshed to display the selected employee's hierarchy. When you apply refinements to view the hierarchy of subordinates, the logged in supervisor's node remains the top node of the network diagram. Right-click a node to select the following options that are available for a node:
Row Expander View Select the Row Expander icon to switch between a diagram display or a multi-level hierarchy layout display. |
Using the Expense Analysis Drawer for an Organization
Org Expense Analysis Drawer
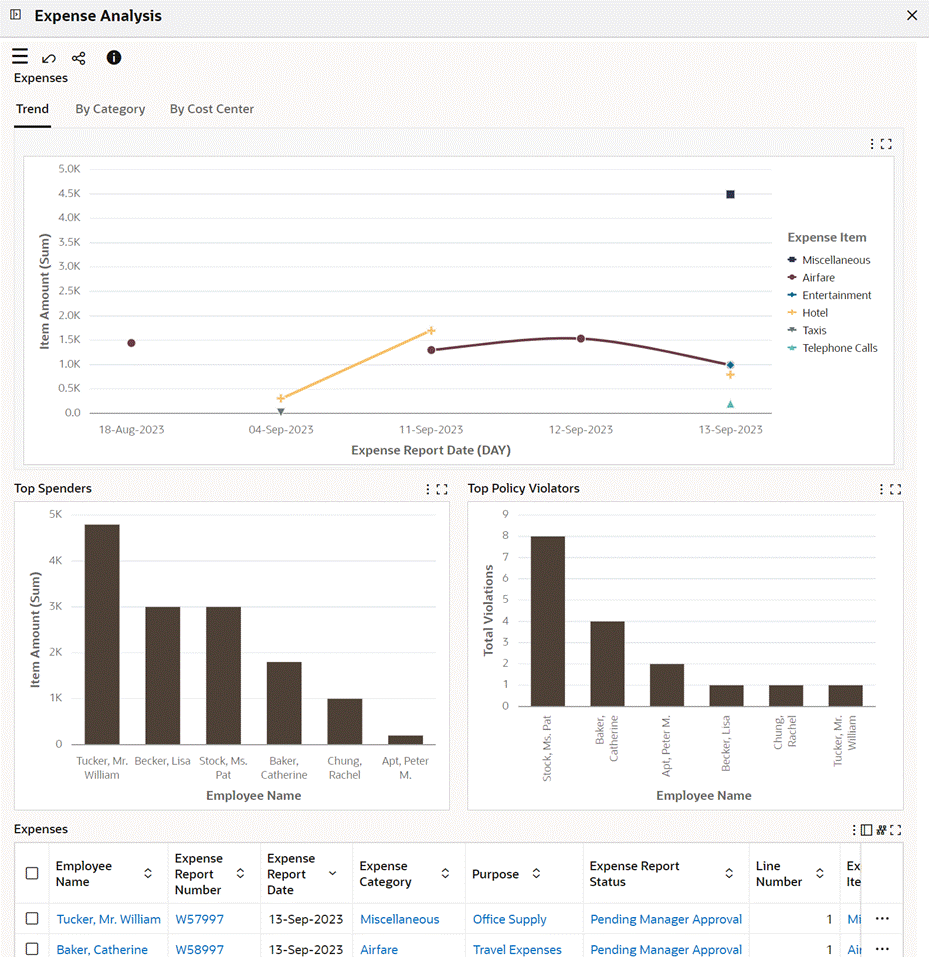
When you select the Org Expense Analysis action on a node in the network diagram, the Expense Analysis drawer for an organization appears. The data on the drawer's components is filtered by the selected organization. Use the Available Refinements attributes to further filter the expense analysis data. For example, you can select expense amount range, expense category, cost center, and purpose.
The following table describes the components of the expense analysis drawer for an organization.
| Component | Description |
|---|---|
| Trend (chart) | This chart helps you to get insight into the sum of item amount for each expense item over a period. Examine the change in spending on expense items. You can track trends in expenses by selecting one of the following time grains:
|
| By Category (chart) | Use this pie chart to perform expense analysis by an expense category. The hover text for each pie chart segment displays the expense item and the total expense amount for the expense item. You can drill down from a pie chart segment to focus on a specific expense item and total amount spent for it. By default, this chart displays data for the fiscal year. You can select different column dimensions to view by fiscal quarter-year or fiscal month-year. |
| By Cost Center (chart) | This pie chart provides expenses data to analyze expenses by cost centers in your organization. The hover text for each pie chart segment displays the cost center and the sum of item amount. You can drill down from a pie chart segment to focus on expenses for a specific cost center. By default, this chart displays the expenses data for the fiscal year. You can select different column dimensions to view expenses data by fiscal quarter-year or fiscal month-year. |
| Top Spenders (chart) | Use this chart to find the top employees with maximum expenses across expense categories. This chart shows the sum of item amount for each employee. Click an employee column on the bar chart to review details of an employee's expenses in the Expenses table. |
| Top Policy Violators (chart) | Use this chart to find the top policy violators in your organization. This chart shows the total number of policy violations for an employee. Click the employee column on the bar chart to review the details in the Expenses table. |
Using the Expense Analysis Drawer for an Employee
Own Expense Analysis Drawer
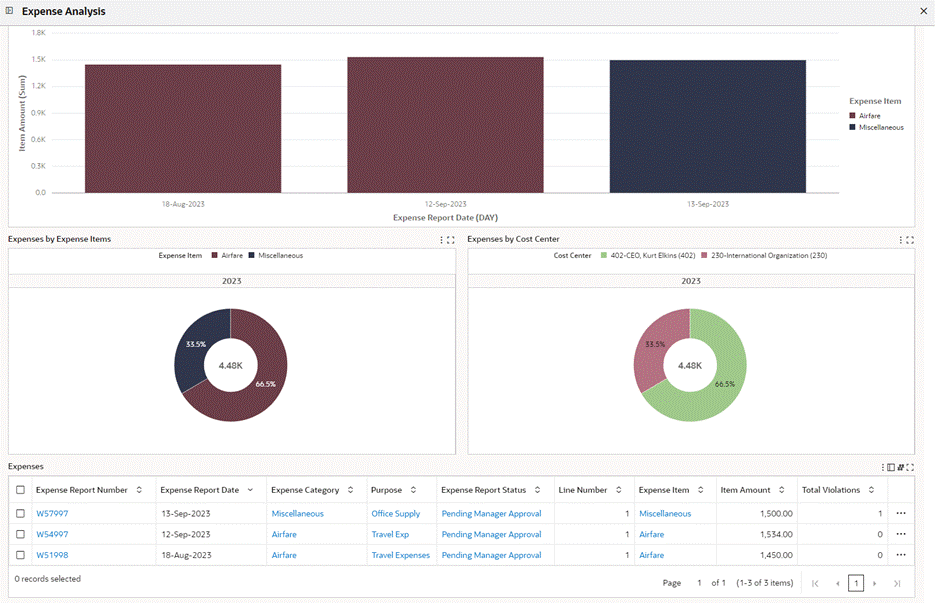
When you select the Own Expense Analysis action on a node in the network diagram, the Expense Analysis drawer for an employee appears. The data on the drawer's components is filtered by the selected employee. Use the Available Refinements attributes to further filter the expense analysis data. For example, you can select a specific expense category, such as Car Rental to review the expense trend.
The following table describes the components of the expense analysis drawer for an employee.
| Component | Description |
|---|---|
| Expenses KPIs (summary bar) | This summary bar shows the following key metrics to review an employee's expenses:
|
| Expense Trend (chart) | This chart shows the sum of item amount for an expense item over a period. Examine the change in spending on expense items. You can track trends in expenses by selecting one of the following time grains:
|
| Expenses By Expense Items (chart) | Use this pie chart to perform expense analysis by an expense item. The hover text for each pie chart segment displays the expense item and the sum of item amount. You can drill down from a pie chart segment to focus on a specific expense item and the total amount spent on it. By default, this chart displays data for the fiscal year. You can select different column dimensions to view by fiscal quarter-year or fiscal month-year. Review details of an employee's expenses in the Expenses table. |
| Expenses by Cost Center (chart) | This pie chart shows the sum of item amount for each cost center. The hover text for each pie chart segment displays the cost center and the sum of item amount. You can drill down from a pie chart segment to focus on expenses of a specific cost center. By default, this chart displays expenses data for the fiscal year. You can select different column dimensions to view expenses data by fiscal quarter-year or fiscal month-year. Review details of an employee's expenses in the Expenses table. |
Expense Analysis Drawer: Expenses Table
Expense Analysis Drawer: Expenses Table
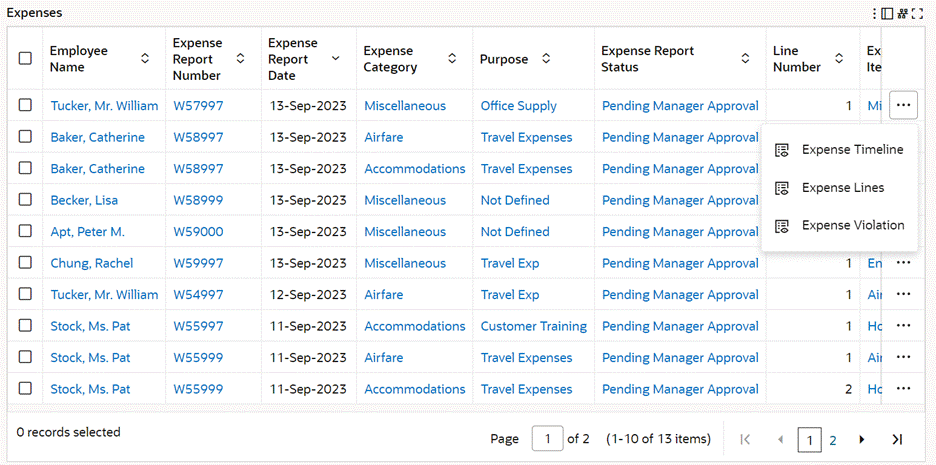
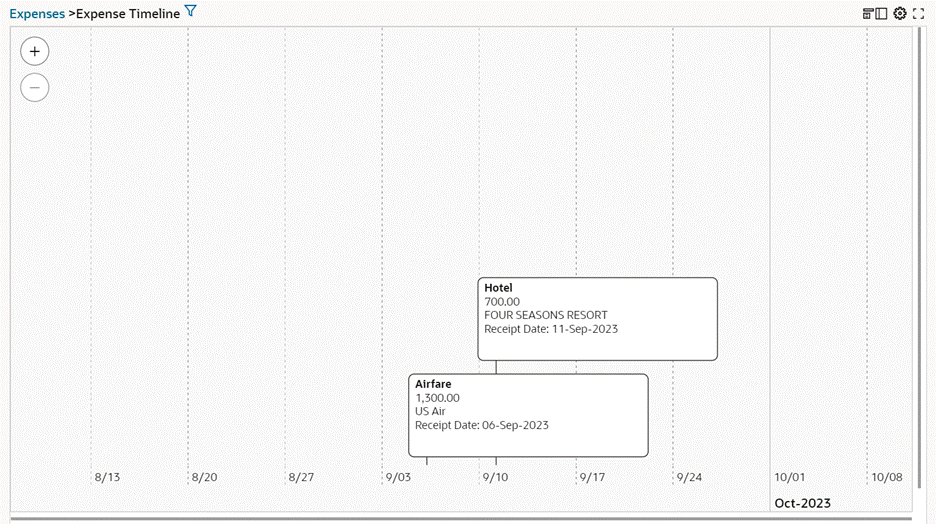
Expense Timeline
Expense Items Table

Expense Violation Table

The following table describes the Expenses table component of the Expense Analysis drawer.
| Component | Description |
|---|---|
| Expenses (results table) | This table shows details for employee expenses. To view details, select Table View or Timeline View. Switch between the views using icons. Use this table to review the expense category, purpose, expense item, expense report status, and total number of violations. You can apply filter on the table columns to review specific details, for example, expenses for an expense category such as Airfare or Car Rental. You can perform the following row-level actions. Select a row and then the action.
|