Mixed Model Map Workbench
This chapter describes the features of the Mixed Model Map Workbench, a graphical interface used to balance your production lines.
This chapter covers the following topics:
- Overview of the Mixed Model Map Workbench
- Viewing, Creating, and Updating Plans
- Viewing Plan Production Line and Line Operation Information
- Viewing Plan Resource Information
- Resource Assignment
- In Process Kanban Assignment
- Filtering and Sorting Information
Overview of the Mixed Model Map Workbench
The Mixed Model Map Workbench is a graphical interface for monitoring line balancing—the process of defining production lines by including the products made, operations performed, and resources and materials consumed at each step. It is used to balance a line against specified demand—and calculate process volume, machine and labor requirements, TAKT times, and In-Process Kanban (IPK) requirements. The Mixed Model Map Workbench provides:
-
A tree navigation graphical workbench displaying information at different detail levels for plans, lines, operations, resources.
-
Detail panes for each node selected on the navigation tree.
-
The ability to analyze and balance lines, or run simulations, considering both the assigned resources and the In Process Kanbans (IPK) available.
-
Both a line operation and process view enabling the assignment and analysis of resource demand across multiple production lines.
-
Support for multiple plans for simulation studies.
-
Identification of resource usage and problem operations.
-
The ability to use unscheduled planned orders and sales orders as a type of demand.
-
An engine using demand as input to calculate the resource/IPK usage as needed for each resource, at each operation.
-
Display and calculation of resource efficiency and resource total units for a plan.
-
Display of line demand and line capacity in summary view.
-
Update of item variable lead time using line TAKT.
The workbench displays a navigation tree, and a detail pane for each node selected on the tree. There are two tree tables enabling you to toggle between the Line Operation and Process regions. Both regions display a line and resource view:
-
The Line Operation region displays operations specific to the line, as derived and defined during line balancing. This region shows the resulting line information after mixed model map calculations.
-
The Process region displays the activities performed in defined processes on the line. This region shows the result of mixed model map runs for all the processes.
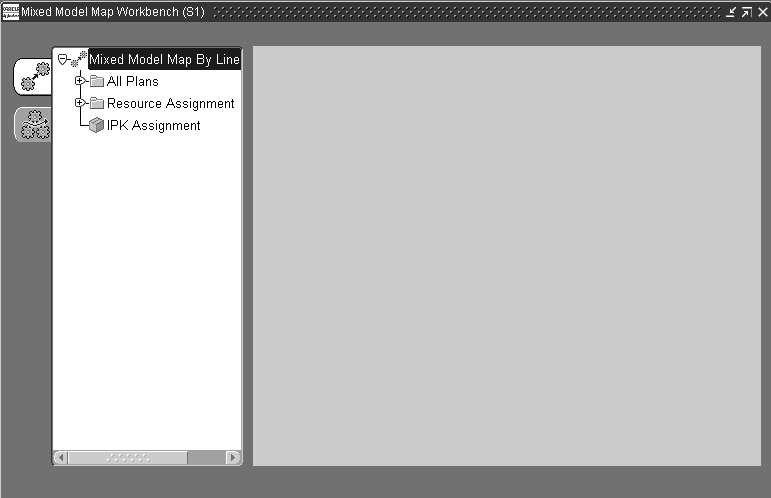
The Navigation tree contains three nodes—when a node is selected the corresponding detail pane displays:
-
All Plans—All the plans defined in the organization selected.
-
Resource Assignment—The total available units from applicable departments, and total assigned units to operations for a resource.
-
IPK Assignment—In Process Kanbans assigned, a summary of all the IPK master assignments.
Note: Mixed Model Map refers to Mixed Model Map Workbench.
Related Topics
Viewing, Creating, and Updating Plans
Viewing Plan Production Line and Line Operation Information
Viewing Plan Resource Information
Viewing, Creating, and Updating Plans
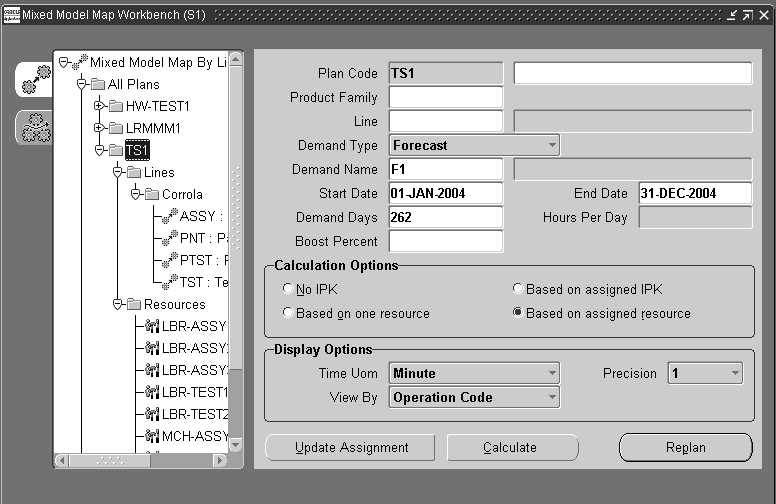
The Plans node displays all the plans in the selected organization. This enables you to view multiple plans using different line balancing techniques. You can view the details of a specific plan by selecting the node in the navigation tree, the data displays in the canvas.
To view or update a plan
-
Select the All Plans node, and expand the navigation tree to display the plans.
-
Select a plan to display the pane for this plan's definition.
-
Update the fields you want to change.
-
Choose Calculate or Replan
If you choose Calculate, the mixed model map calculation is performed based on the parameters specified for this plan. Calculations use master assigned values for resources and IPKs. A confirmation displays if the process is successful.
If you choose Replan, the plan assigned values for resource and IPKs are used for recalculation, along with the parameters specified in this plan. A confirmation displays if the process is successful.
-
Save your work.
To create a new plan
-
Select the All Plans node, and right click to display the Menu.
-
Choose New to display the pane for entering your plan definition.
-
Enter a unique name in the Plan Code field, and optionally any description for this plan.
-
Optionally, you can select values in the Product Family, a group of products with similar characteristics, and product Line fields for this plan.
-
In the Demand Type field, select a value representing the source of this demand. Your choices are:
-
Forecast—an estimate of future demand
-
MDS—master demand schedule, the anticipated forecasted ship schedule
-
MPS—master production schedule, the anticipated forecasted build schedule
-
Actual Production—demand generated from existing Flow schedules
-
Sales Orders
-
Planned Orders
-
-
If the value in the Demand Type fields is Forecast, MDS, or MPS, you are required to select a Demand Name value.
-
The Start and End Date values are derived from the forecasted demand, and can be changed.
Demand Days for this Demand Type display. Demand days are the number of working days in between specified demand start and end date.
-
The Hours Per Day field displays the working hours for this line. This value can be changed.
-
You can enter a Boost Percent value. This specifies an increase percentage of the demand in the plan.
-
Choose a Calculation Option. This region is used to select how operational cycle times, resource requests, and IPK values are calculated. Your choices are:
-
No IPK—resource requirements are calculated using the IPK value as zero on the line operation.
-
Based on one resource—the IPK needed on the line operation is calculated assuming one resource at each operation.
-
Based on assigned IPK—resources are calculated using the assigned IPK at the line operation.
-
Based on assigned resource—the IPK needed on the line operation is calculated using all the assigned resources.
-
-
The Display Options region is used for selecting viewing options for the generated mixed model map. Indicate how you want to display time in the Time Uom field. Your choices are Hour, Minute, or Second.
-
In the View By field, indicate the sort option, on the navigation tree, for this plan's process or line operation display. Your choices are Display Sequence, Operation Code, or Description.
-
The Precision field is the decimal setting for your calculation values. Your choices are 1,2,3, or 4 decimal places.
-
Choose Calculate to run the mixed model map calculation based on the parameters specified for this plan.
Calculations use master assigned values for resources and IPKs. A confirmation displays if the process is successful.
-
Optionally, choose Replan to use the plan assigned values for resource and IPKs in recalculation, along with the parameters specified in this plan. A confirmation displays if the process is successful.
-
Optionally, choose Update Assignment to copy the assigned resources and IPKs in this plan to the master resource and IPK assignments. A confirmation displays if the process is successful.
-
Save your work.
After you create or update information in this window, you can perform three processes.
Viewing Plan Production Line and Line Operation Information
Production line information is available on the workbench in summary, line detail and line operation, and graphical views. You can use the summary view to determine if there is an imbalance in the line, resource overload, or IPK assignment. You can then view the details of a specific line and line operation.
Line Operation views enable you to access resource and labor information.
The production line views enable you to copy the values that are required in the Needed fields to the Assigned fields. In the navigation tree, right click to display the menu, and choose. Select Copy Needed To Assigned.
You can also update item variable lead times by copying the line TAKT time. In the navigation tree, right click to display the menu, and choose Update Items Variable Lead Time. This function copies the value of the plan's:
-
(Line TAKT / Line hours per day) for each line to the corresponding Items' Variable Lead Time
Related Topics
Line Detail - Resource/IPK Table View
Line Operation - Graphical View
Mixed Model Map Workbench Calculations
Color Representation on the Mixed Model Map Workbench
Line Summary View
The Line Summary pane displays fields for Line name, Hours, Daily Demand, line TAKT time, Assigned TAKT time, Daily Capacity—and two regions—Resource Percentage and IPK Percentage. These regions display maximum Over and Under values for the line.
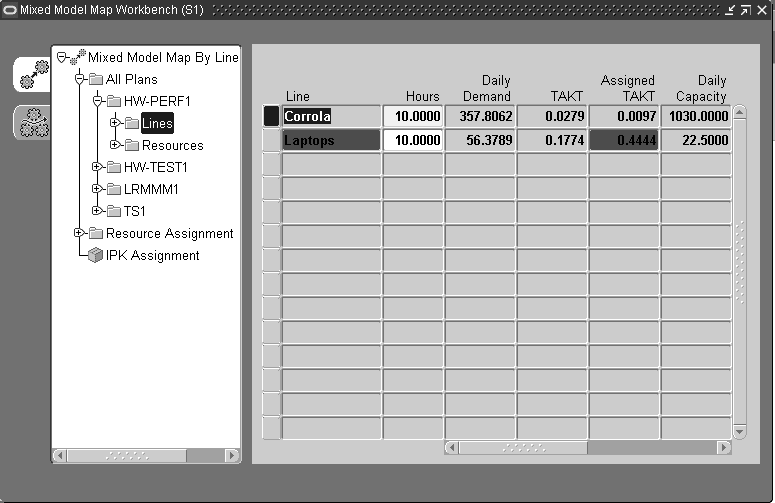
The Line Hours field can be updated. This is the continuous working hours for the line.
Line TAKT and Assigned TAKT fields display values so you can compare capacity. Line TAKT is the rate the line produces one item to fulfill demand. Assigned TAKT is the time per unit that each operation produces, given the number of resources assigned.
The Daily Capacity value is a statement of process capability. It is equal to the Assigned TAKT multiplied by the hours.
Color coding provides a visual display of these comparisons. See: Color Representation on the Mixed Model Map Workbench
In the Resource Percentage region, Over signifies a resource overload. That is, the resource needed is greater than the resource assigned in the line. Under signifies that the resource is not sufficiently used.
In the IPK Percentage region, Over means that there is IPK overload. That is, the IPK needed is greater than the IPK assigned in any of the line operations or processes. Under signifies that IPK are not sufficiently used.
Detail information for these values and modifications created here is available in tabbed regions for Summary, IPK Table, and Graph.
Line Detail - Summary View
The Line Detail panes are view only windows. In the Line Detail view, the Summary tabbed region shows line operation detail information in a table format. The line name, line hours, and line TAKT display.
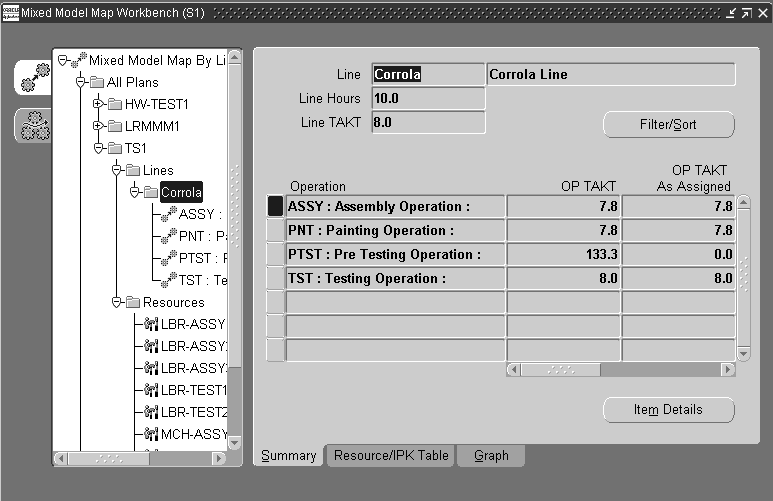
The table displays the operation information including Operation name, Operation TAKT, Operation TAKT as Assigned, Resource Capacity, and Process Efficiency. Both over-assigned and under-assigned resources display in the Resource Capacity column. Process Efficiency is a statement of value-added activities. It is equal to the line operation efficiency multiplied by the demand.
Color coding provides a visual display for comparisons of values needed and exceeded. See: Color Representation on the Mixed Model Map Workbench
You can filter or sort the data displayed in the table by choosing Filter/Sort. See: Filtering and Sorting Information
You can view item demand details of the line operation and operation TAKT for the line by choosing Item Details from the Summary tabbed region. See: Viewing Item Details for a Line
You can copy the values that are in the required in the Needed fields to the Assigned fields. In the navigation tree, right click to display the menu, and choose. Select Copy Needed To Assigned.
You can also update item variable lead times by copying the line TAKT time. In the navigation tree, right click to display the menu, and choose. Update Items Variable Lead Time.
Line Detail - Resource/IPK Table View
The Resource/IPK Table tabbed regions contain two table areas—Resources and In Process Kanbans regions.
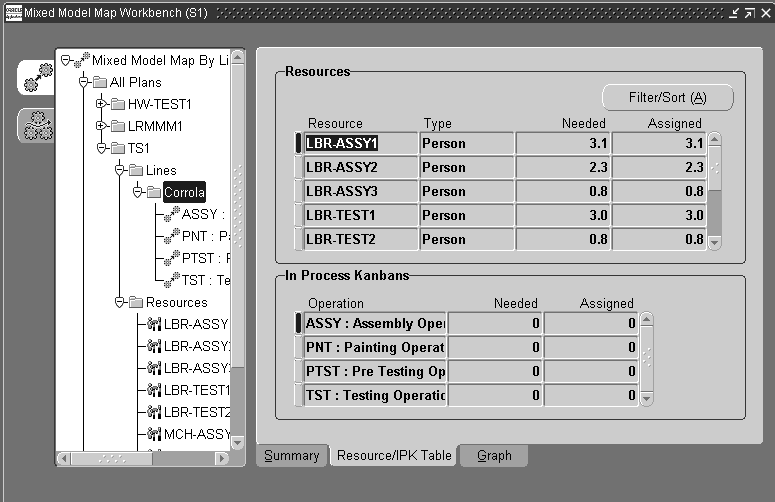
The Resources region displays line resource details including fields for Resource, resource Type, resources Needed, and resources Assigned. You can filter or sort the data displayed in the table by choosing Filter/Sort. See: Filtering and Sorting Information
The In Process Kanban regions displays a table showing the line operation, and values needed and assigned.
The production line views enable you to copy the values that are in the needed fields to the assigned fields. In the navigation tree, right click to display the menu, and choose. Select Copy Needed To Assigned.
You can also update item variable lead times by copying the line TAKT time. In the navigation tree, right click to display the menu, and choose. Update Items Variable Lead Time.
Line Detail - Graphical View
The Graph tabbed region of the line detail displays a graphical view of the line resource and IPK values. In the View By field, you can change the graph information from percentage values or absolute values. There is a choice of three views including:
-
Percentage Needed: the percentage difference between Assigned and Needed values—divided by the Needed value. Over-assigned and under-assigned resources display on this view.
-
Percentage Assigned: the percentage difference between Assigned and Needed values—divided by the Assigned value. Over-assigned and under-assigned resources display on this view.
-
Absolute Value: Needed and Assigned values display for comparison.
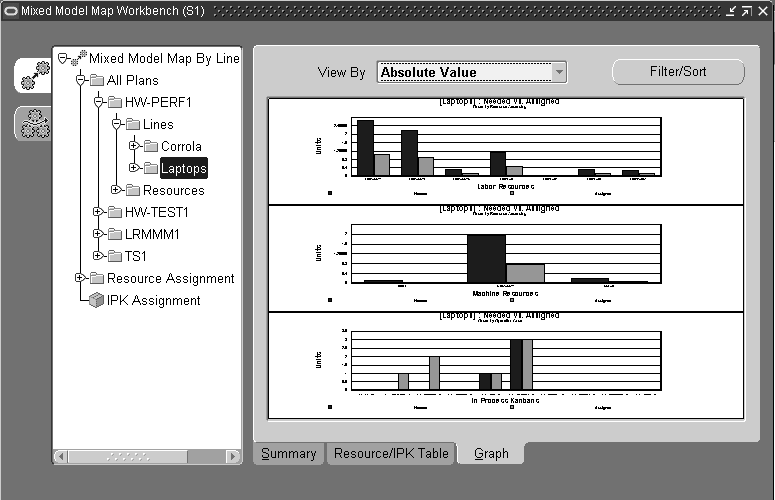
You can modify the display by filtering or sorting the data by choosing Filter/Sort. See: Filtering and Sorting Information
You can enlarge the graph by double-clicking on the graph. Double click again to return to the original view. You can also use the cursor to drag over a region to enlarge a section of the graph. Use your cursor to rollover text details on the graph to display tooltip information.
Color coding provides a visual display for comparisons of values needed and exceeded. See: Color Representation on the Mixed Model Map Workbench
Line Operation - Detail View
Line Operation Detail views display specific data for the operation node selected. The Detail tabbed region displays fields for this line operation for Operation TAKT, Line TAKT, IPK Needed and IPK Assigned.
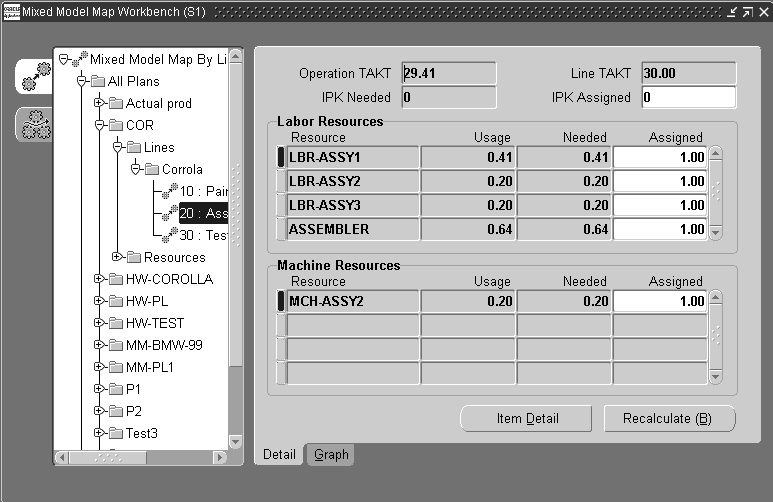
There are two regions—Labor Resources and Machine Resources region. Both regions display fields for Resource name, Usage, Needed, and Assigned.
These fields enable you to compare and assign resource capacity values. Color coding provides a visual display for comparisons of values needed and exceeded. See: Color Representation on the Mixed Model Map Workbench
You can view item demand details of the line operation and operation TAKT for the line operation choosing Item Details from the Summary tabbed region. See: Viewing Item Details for a Line
You can copy the values that are in the required in the Needed fields to the Assigned fields. In the navigation tree, right click to display the menu, and choose. Select Copy Needed To Assigned.
Values can be changed in the Assigned fields and recalculated for a line operation. Enter the value you want to change, and choose Recalculate. Resources are calculated and new values display in the usage and needed fields. The plan assigned values for resource and IPKs are used for recalculation, along with the parameters specified in this plan.
Line Operation - Graphical View
The Graph tabbed region of the line operation detail displays a graphical view of labor resources and machine resources.
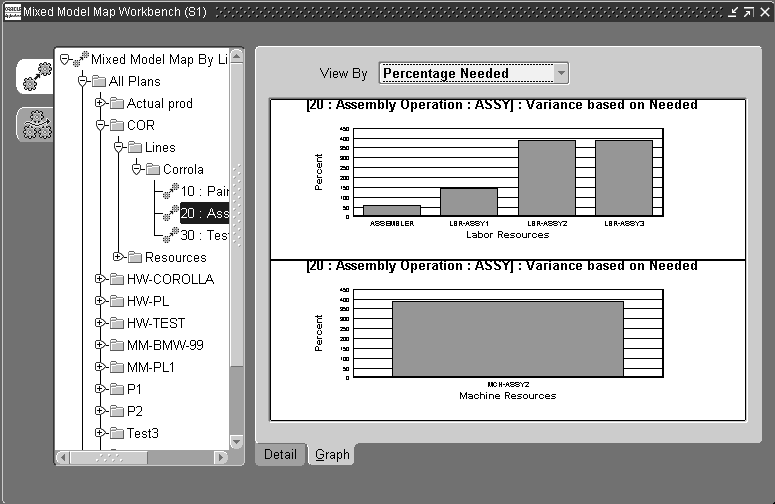
In the View By field, you can change the graph information from percentage values or absolute values. There is a choice of three views including:
-
Percentage Needed: the percentage difference between Assigned and Needed values—divided by the Needed value. Over-assigned and under-assigned resources display on this view.
-
Percentage Assigned: the percentage difference between Assigned and Needed values—divided by the Assigned value. Over-assigned and under-assigned resources display on this view.
-
Absolute Value: Needed and Assigned values display for comparison.
You can copy the values that are in the required in the Needed fields to the Assigned fields. In the navigation tree, right click to display the menu, and choose. Select Copy Needed To Assigned.
You can enlarge the graph display by double-clicking on the graph. Double click again to return to the original view. You can also use the cursor to drag over a region to enlarge a section of the graph. Use your cursor to rollover text details on the graph to display tooltip information.
Color coding provides a visual display for comparisons of values needed and exceeded. See: Color Representation on the Mixed Model Map Workbench
Viewing Item Details for a Line
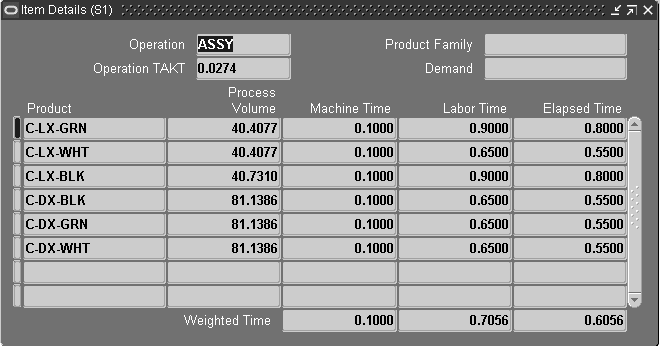
The Item Details window display line operation and operation TAKT details for a specific line. This is a view only window that displays fields for Product, Process volume, Machine Time, labor time, and Elapsed Time. The Weighted Time values also display for the time fields.
This window is accessed from the Line Detail view, the Summary tabbed region—and the Line Operation Detail views by choosing Item Details.
Viewing Plan Resource Information
You can view resources needed and assigned for a particular plan—and filter and sort the displayed information. Resources are displayed in summary and individual resource detail views.
Resources Summary Views
The Resource Summary views are a view only panes displaying Summary and Graph regions. Updates can be made on the detail views.
The Summary tabbed region has two regions—Labor Resources and Machine Resources region. Both regions display fields for Resource name, Needed, Assigned, and Relocation Needed.
These fields enable you to compare resource capacity values. Color coding provides a visual display for comparisons of values needed and exceeded. See: Color Representation on the Mixed Model Map Workbench
The Relocation Needed field signifies if resources are being allocated sufficiently. For example, some line operations have extra resources while others need resources. The values in this field are:
-
Yes—there are extra resources assigned to this line operation, while other operations have less assigned resources than needed.
-
No—there are no extra resources assigned to this line operation, and no other operations need this resource.
-
Null—resources needed is greater than resources assigned.
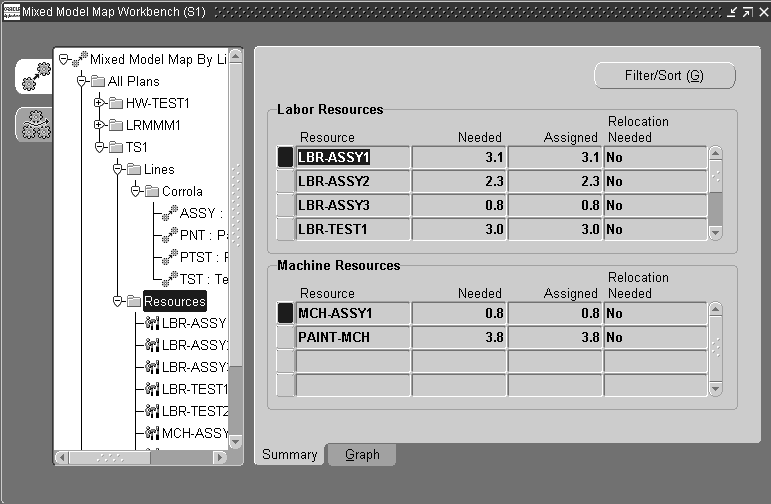
You can modify the display by filtering or sorting the data by choosing Filter/Sort. See: Filtering and Sorting Information
The Graph tabbed region displays Labor Resources and Machine Resources regions.
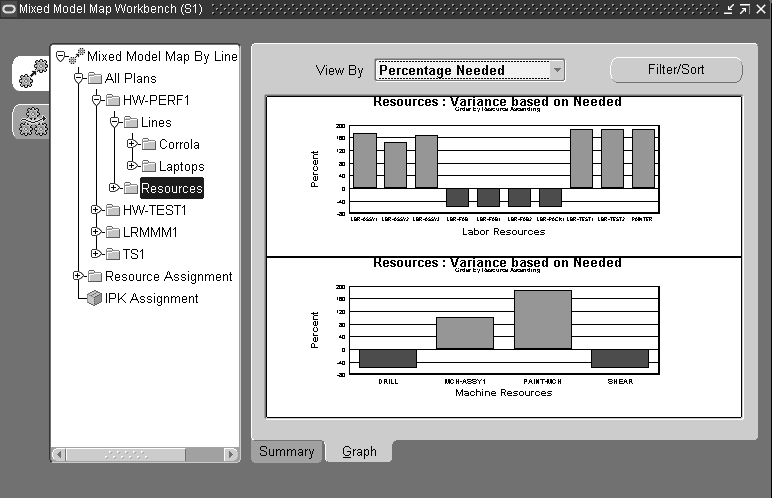
In the View By field, you can change the graph information from percentage values or absolute values. There is a choice of three views including:
-
Percentage Needed: the percentage difference between Assigned and Needed values—divided by the Needed value. Over-assigned and under-assigned resources display on this view.
-
Percentage Assigned: the percentage difference between Assigned and Needed values—divided by the Assigned value. Over-assigned and under-assigned resources display on this view.
-
Absolute Value: Needed and Assigned values display for comparison.
You can enlarge the graph display by double-clicking on the graph. Double click again to return to the original view. You can also use the cursor to drag over a region to enlarge a section of the graph. Use your cursor to rollover text details on the graph to display tooltip information.
Color coding provides a visual display for comparison. See: Color Representation on the Mixed Model Map Workbench
Resource Detail Views
The Resource Detail view shows the resource and IPK needed and assigned in the line operation across line operations. You can filter or sort the data displayed by choosing Filter/Sort. See: Filtering and Sorting Information
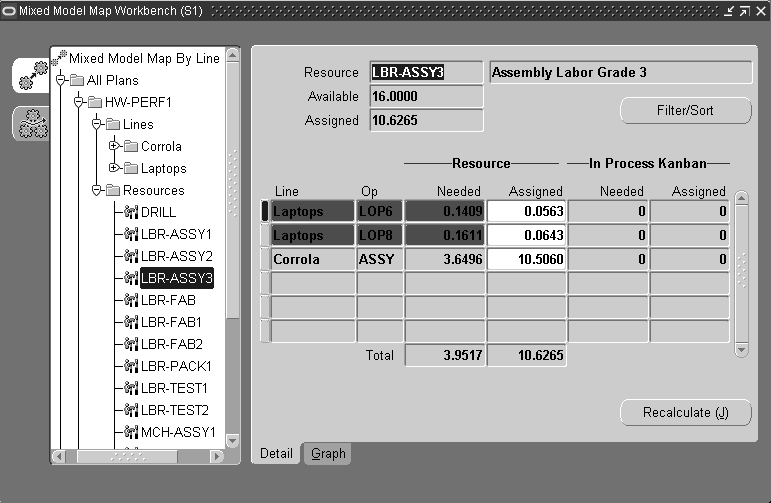
The resource Assigned can be modified and recalculated. Choose Recalculate to update resource and IPK values. The plan assigned values for resource and IPKs are used for recalculation, along with the parameters specified in this plan.
You can copy the values that are in the required in the Needed fields to the Assigned fields. In the navigation tree, right click to display the menu, and choose. Select Copy Needed To Assigned.
The Graph Resource view displays resource details in a graphical view. In the Absolute Value view, the graph displays the resource and IPK needed and assigned in the line operation—across line operations. You can filter or sort the data displayed by choosing Filter/Sort. See: Filtering and Sorting Information
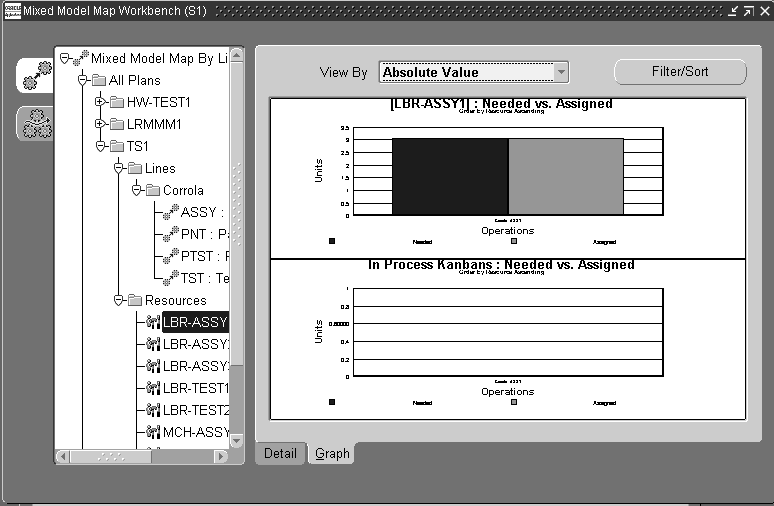
In the View By field, you can change the graph information from percentage values or absolute values. There is a choice of three views including:
-
Percentage Needed: the percentage difference between Assigned and Needed values—divided by the Needed value. Over-assigned and under-assigned resources display on this view.
-
Percentage Assigned: the percentage difference between Assigned and Needed values—divided by the Assigned value. Over-assigned and under-assigned resources display on this view.
-
Absolute Value: Needed and Assigned values display for comparison.
You can enlarge the graph display by double-clicking on the graph. Double click again to return to the original view. You can also use the cursor to drag over a region to enlarge a section of the graph. Use your cursor to rollover text details on the graph to display tooltip information.
Color coding provides a visual display for comparisons of values needed and exceeded. See: Color Representation on the Mixed Model Map Workbench
Resource Assignment
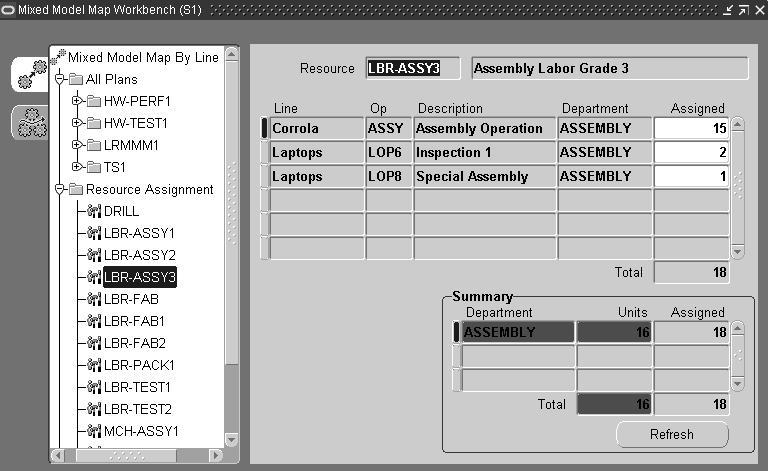
The expanded Resource Assignment node enables you to view all your resources—and display the details for the line, line operation, department, and assigned values. This pane displays a detail of each line the resource is assigned to, a total Assigned value. There is Summary region on this window displaying the department, units, assigned, and totals.
You can update the Assigned field value, and choose Refresh to update the resource values.
In Process Kanban Assignment
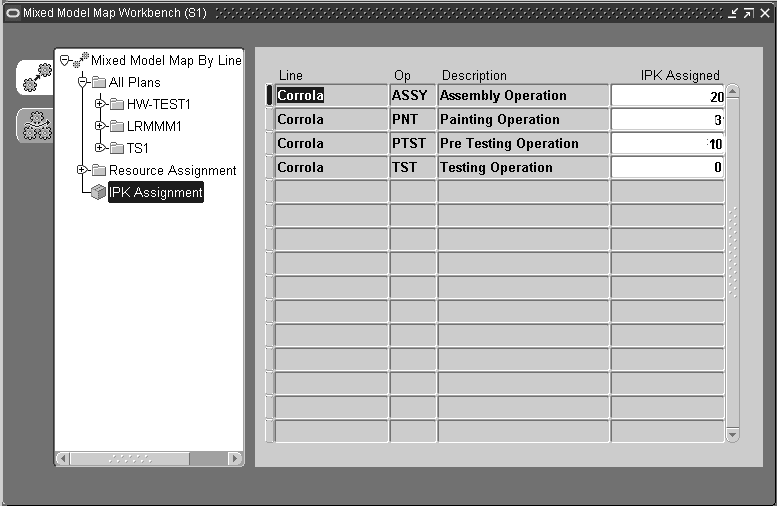
The IPK Assignment pane displays a summary of all the IPK master assignments for your lines. It displays the IPK assignment for the line and line operation combination. This data is updated when you choose Update Assignment for a plan, or when you change values in the IPK Assignment field on this pane.
Note: The Bills of Material Workday calendar is used during kanban planning.
In Process Kanbans are designated as a work in process holding area for work in between operations. If the operation time for one operation is shorter in length than the next operation—the IPK is where the item is designated until the next operation is available. The outputs are used by the next operation to keep the line flowing. For example:
-
A Line with 2 working hours, consists of 2 continuous operations—Operation1 and Operation2
-
Operation1 and Operation2 use one resource each—R1 and R2
-
R1 completes an operation every 30 minutes, while R2 completes an operation every 15 minutes
In order for the line to produce items every 15 minutes, and fulfill 8 demands, IPK is needed for Operation1 because it takes more time than Operation2.
-
R1 in Operation1 only produces 4 items in 2 working hours
-
R2 needs 8 unfinished items from R1 to produce 8 final items
Therefore, extra items—or IPK—are needed at the end of R1 in Operation 1, so R2 in Operation 2 can keep producing at its capacity level. IPK can be fulfilled by using extra line operation resources at the operation.
In Process Kanban Calculation
IPKs are calculated as follows:
(elapsed weighted time - line takt time) * hours/day * time conversion factor divided by elapsed weighted time * line takt time
The Calculation Options setting in the Plan detail pane is used to select an operational cycle time setting for the number of resources assigned to the operation.
Related Topics
Viewing, Creating, and Updating Plans
Mixed Model Map Workbench Calculations
Filtering and Sorting Information
You have the option to filter or sort table information in the Line Detail, Resource, and Resource Detail views. This enables you to use sort criteria and ordering information, or filter criteria to limit your display of records. You can filter and sort on the Summary, Resource IPK, and Graph tabbed regions.
To filter or sort line detail records
-
On the Line Detail pane of the selected line, choose Filter/Sort.
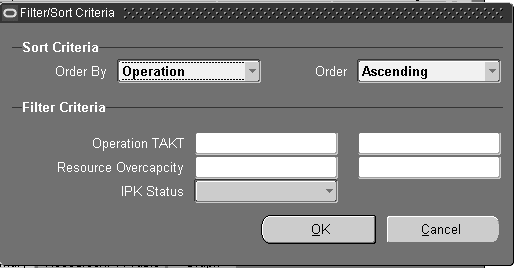
The Filter/Sort Criteria window displays.
-
In the Sort Criteria region, choose ordering options for line operation details. In the Order By field, your choices are Operation, or Operation TAKT.
-
In the Order field, choose the order of display for records—Ascending or Descending.
-
In the filter Criteria region, you have the option to enter values for filtering your records. You can enter a value, or range of values, in the Operation TAKT and Resource Overcapacity fields.
-
You can select an IPK Status value. Your choices are either Over or Under
-
Choose OK to filter and sort your records. The results display on the Line Detail views.
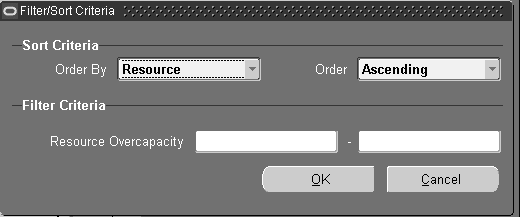
To filter or sort resource and resource detail records
-
On the Resource or Resource Detail pane of the selected resource, choose Filter/Sort.
The Filter/Sort Criteria window displays.
-
In the Sort Criteria region, choose ordering options for line operation details. In the Order By field, your choices are Resource or Overcapacity.
-
In the Order field, choose the order of display for records—Ascending or Descending.
-
In the filter Criteria region, you have the option to enter a value, or range of values, in the Resource Overcapacity field.
-
Choose OK to filter and sort your records. The results display on the Resource and Resource Detail views.