Oracle Project Manufacturing Command Center
This chapter covers the following topics:
- Project Manufacturing Command Center Overview
- Risk Monitor Dashboard
- Projects Dashboard
- Work Orders Dashboard
- Procurement Dashboard
- Cost Activities Dashboard
- Inventory Dashboard
- Sales Orders Dashboard
- Project Contracts Dashboard
- Genealogy and Trace Dashboard
Project Manufacturing Command Center
Project Manufacturing Command Center Overview
The Oracle Project Manufacturing Command Center enables users to achieve better project supply chain and manufacturing execution outcomes. You can search for manufacturing projects and gain full visibility into manufacturing work orders, sales orders, inventory on-hands, and procurement activities through key metrics, charts, graphs, and tables. Based on your role, the Project Manufacturing Command Center enables you to:
-
Track overdue, at-risk and on-hold sales orders, project contract deliverables, work orders, and purchase orders.
-
Take proactive corrective action on exceptions and overdue work orders, sales orders, and procurement transactions.
-
Analyze manufacturing costs, revenue margin, expenditures, and commitments.
-
Track status of project procurement activities.
-
Prioritize on-time product delivery.
-
Summarize project manufacturing costs to facilitate reconciliation with cost in Oracle Projects.
-
Monitor on-hand inventory balances and valuations.
-
Manage manufacturing related project contract deliverables.
-
Enable material transfer, borrow, and payback actions between projects.
-
Use the network diagram to track and trace project manufacturing activities.
Before you load data from Oracle E-Business Suite into the Project Manufacturing Command Center, ensure that your EBS data is accurate and current.
The following Project Manufacturing Command Center dashboards enable search functions using Enterprise Command Center integration:
-
Risk Monitor dashboard - Use this dashboard to gain insights into the project supply chain and execution activities with key metrics and visual charts that highlight overdues, exceptions, on-hold and at-risk transactions. You can also visualize transactions by deliverable schedules that help you to plan and take informed decisions.
-
Projects dashboard - Use this dashboard to search for projects, view project and task details, and analyze financial information.
-
Work Orders dashboard - Use this dashboard to view and manage project-related work orders on and track the progress of project-related WIP jobs.
-
Procurement dashboard - Use this dashboard to track and monitor project-related purchase orders, requisitions, quotations, blanket releases, and RFQs.
-
Cost Activities dashboard- Use this dashboard to view aggregation of project manufacturing costs and how these costs reconcile with costs in Oracle Projects.
-
Inventory dashboard - Use this dashboard to manage project materials transfer and track on-hand inventory.
-
Sales Orders dashboard - Use this dashboard to view project-related sales orders.
-
Project Contracts dashboard - Use this dashboard to view, track, and monitor project manufacturing related contracts.
-
Genealogy and Trace dashboard - Use this dashboard to track and trace project manufacturing activities using the Project Manufacturing Execution Genealogy diagram, which displays the network relationship for work orders, work order components, purchase orders, sales orders, project locators, project contracts, and other associated nodes.
Note: You can use the Project Manufacturing Command Center only after the installation and common configurations are completed as described in My Oracle Support Knowledge Document 2495053.1, Installing Oracle Enterprise Command Center Framework, Release 12.2. For additional ECC Overview information, see Overview of Oracle Enterprise Command Center Framework, Oracle E-Business Suite User's Guide.
Searching Enterprise Command Center Dashboards
Use the dashboard sidebars to refine (filter) the data on each dashboard. You can select a value or record from the Available Refinements component, or use Search to find a keyword, a value, or a specific record. The type-ahead feature suggests matches for your entry that correspond to the available refinements. When you submit a search, the search term is added to the Selected Refinements list, and the dashboard data is refined to include only records that match the search. You can add multiple refinements and remove any of them at any time.
Use an asterisk (*) or percent sign (%) to perform a partial keyword or record search that matches any string of zero or more characters. You can also use a question mark (?) to perform a partial search that matches any single character.
Additional Information: For more information about searching for and refining data in enterprise command centers, see Search in Highlights of an Enterprise Command Center, Oracle E-Business Suite User's Guide.
Risk Monitor Dashboard
As a project manager or a shopfloor supervisor you can use the Risk Monitor dashboard to monitor and address issues across project sales orders, project contract deliverables, work orders, and purchase orders. The Risk Monitor dashboard is comprised of the following dashboards:
Use these dashboards to:
-
Visualize all project related manufacturing transactions in a single dashboard.
-
Review delays or alerts associated to project manufacturing transactions and initiate corrective action if required.
-
Monitor project supply chain and manufacturing exceptions.
-
View schedule exceptions for work orders, sales orders, and procurement activities.
-
View overdue work orders, sales orders, and procurement activities.
-
Enable visibility for timely resolution of schedule conflicts.
-
Find exception detail and impact on project delivery.
-
View the track and trace genealogy diagram for project supply chain activities and processes in the Genealogy & Trace dashboard.
Transactions Schedule Exceptions Dashboard
Use the Transactions Schedule Exceptions dashboard to view metrics for sales orders, project contracts, purchase orders, and work orders that are overdue or at risk. As a project manager you can track transactions that are overdue, that are at risk, scheduled to be completed in the future, or transactions that are on hold.
Using refinements that are available for the data set that you select, you can refine your search based on sales order, purchase orders, contract number, project number, task number, item, supplier, and customer. See Project Manufacturing Command Center Overview for more information.
From the Project Manufacturing Super User responsibility, navigate to the Transactions Schedule Exceptions dashboard:
(N) Projects > Project Manufacturing Command Center > Risk Monitor (tab) > Transaction Schedule Exceptions (tab)
Transactions Schedule Exceptions Dashboard
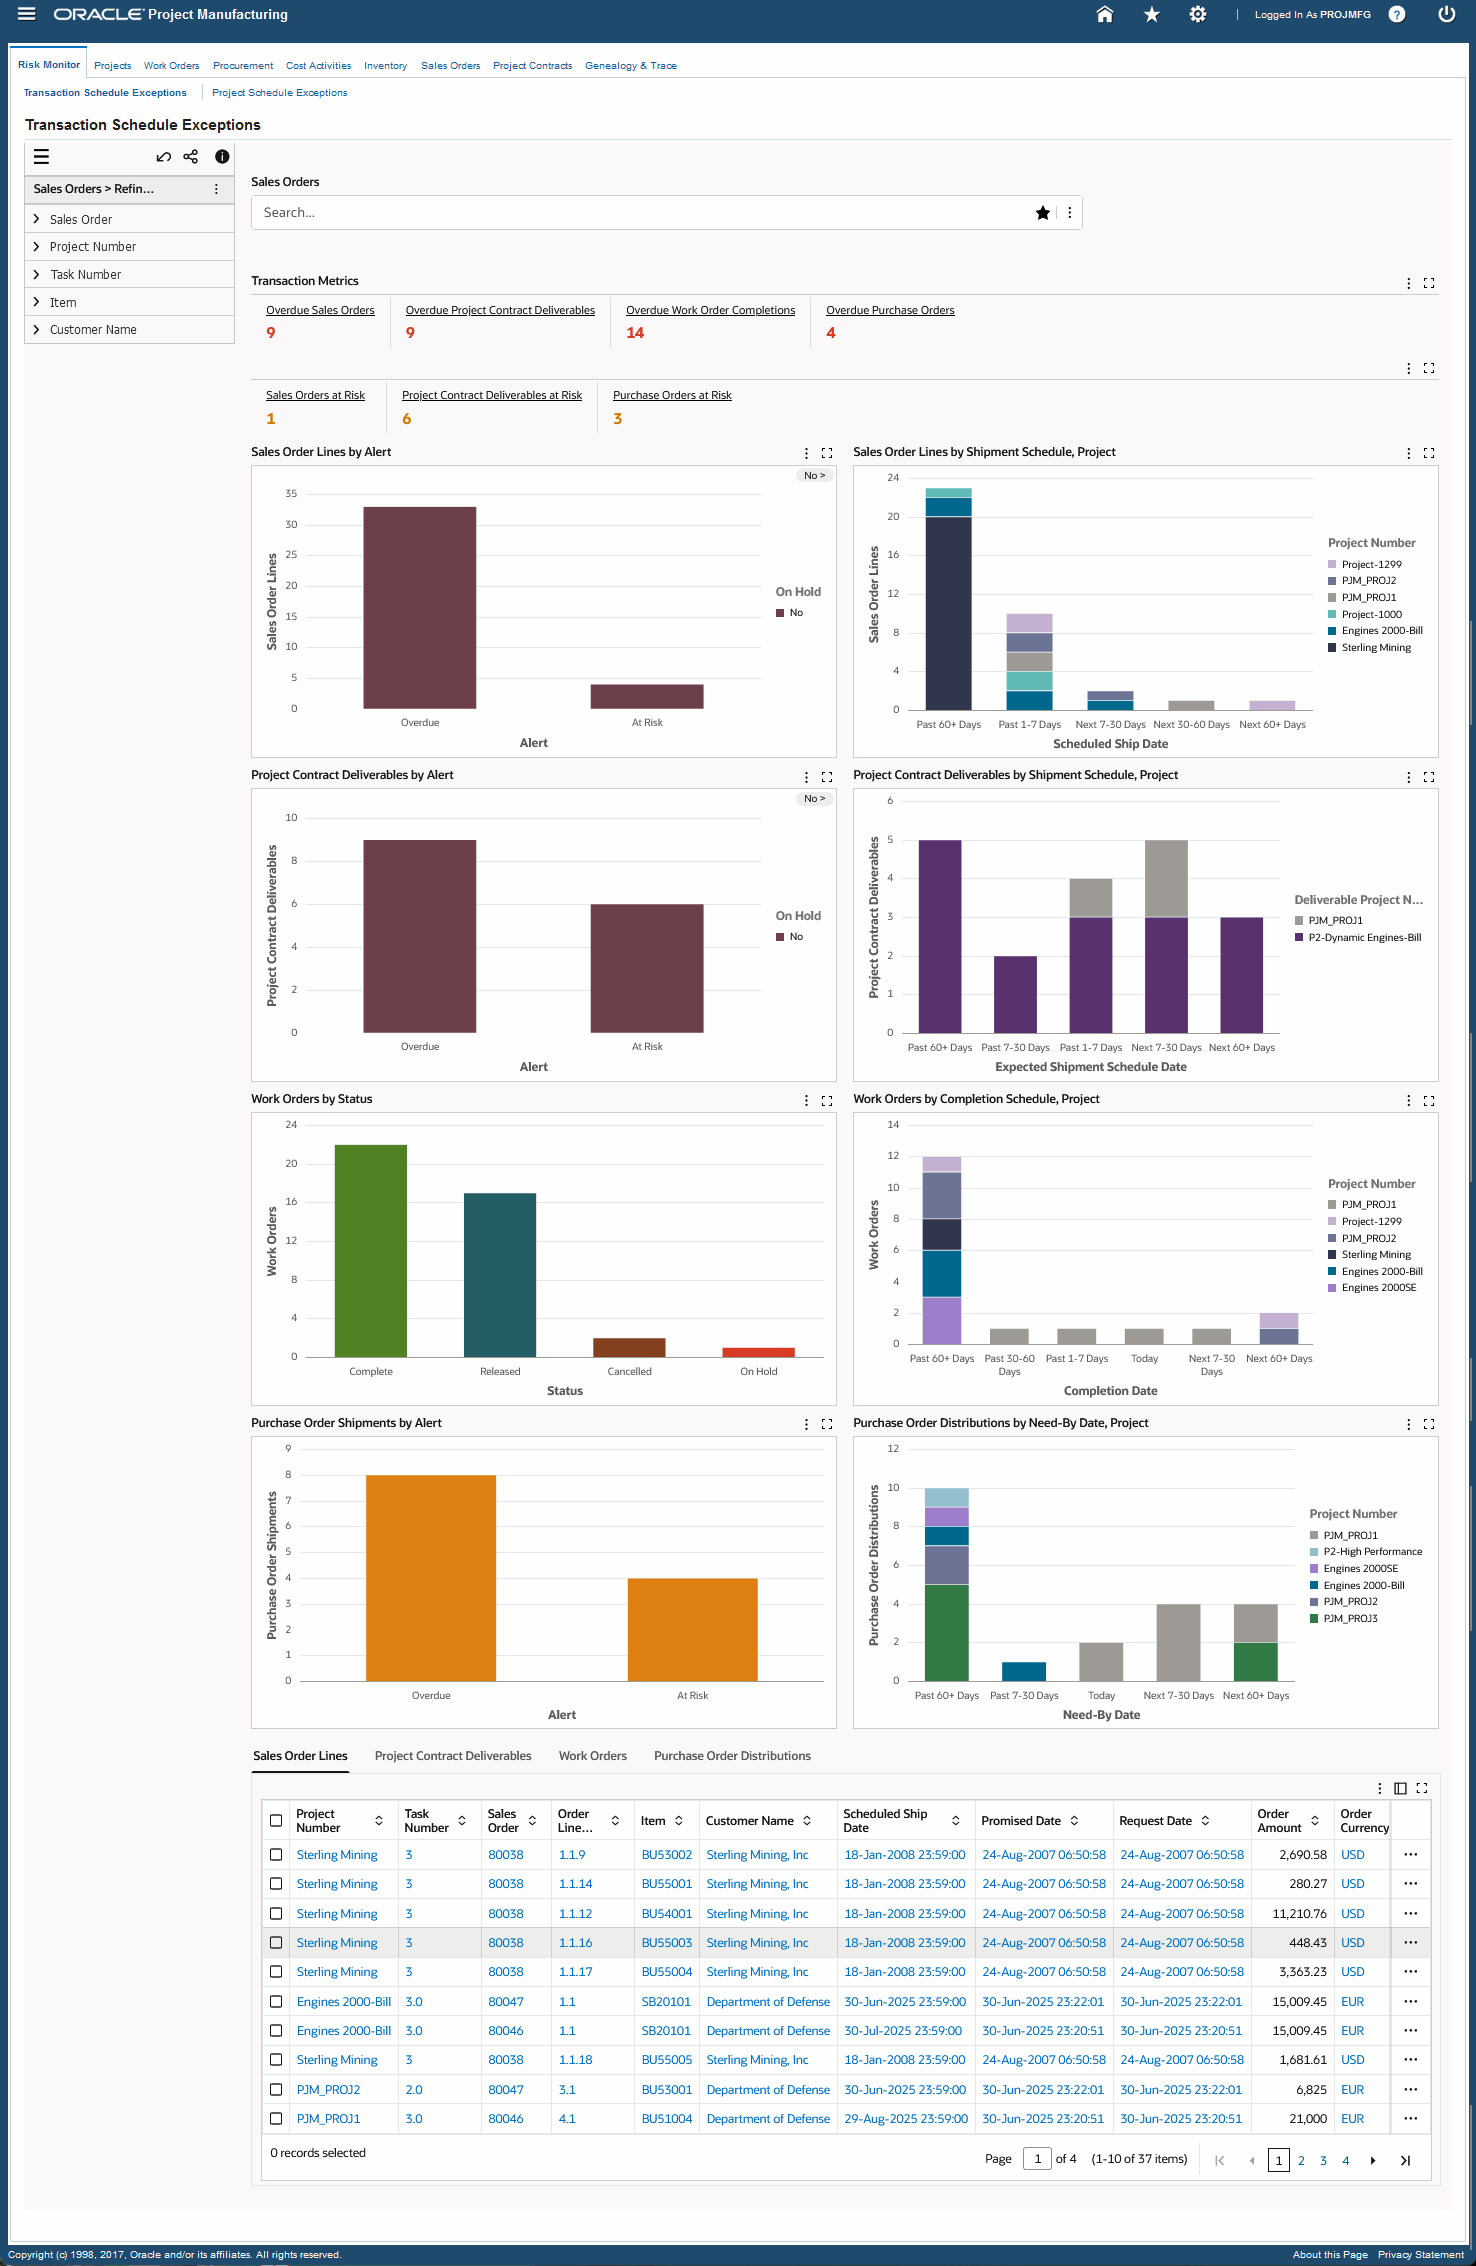
The following table describes the Transactions Schedule Exceptions dashboard components:
| Component | Description |
| Summary (summary bar) | The Summary bar displays the following key metrics:
|
| Sales Order Lines by Alert (chart) | This chart provides project manufacturing sales order line information based on the at-risk and overdue alert types. Click the Options icon to select On Hold from the Dimension menu and the Shipment Alert Type Group Dimensions menu. |
| Sales Order Lines by Shipment Schedule, Project (chart) | This chart provides project manufacturing sales order information based on scheduled shipment dates and projects. Click the Options icon to select Project Number or Customer Name from the Dimension menu and Scheduled Ship Days from the Group Dimensions menu. |
| Project Contract Deliverables by Alert (chart) | This chart provides project manufacturing project contract deliverables information based on at-risk and overdue alert types. Click the Options icon to select On Hold or Hold Type from the Dimension menu and Deliverable Alert Tyle from the Group Dimensions menu. |
| Project Contract Deliverables by Shipment Schedule, Project | This chart provides project manufacturing project contract deliverables information based on shipment schedule dates and projects. Click the Options icon to select Deliverable Project Number or Contract Number from the Dimension menu and Deliverable Shipment Days from the Group Dimensions menu. |
| Work Order by Status (chart) | This chart provides project manufacturing work order status information based on whether the status of work orders are released, complete, unreleased, cancelled, and on hold. Click the Options icon to select Status from the Dimension menu and the Group Dimensions menu. |
| Work Orders by Completion Schedule, Project (chart) | This chart provides project manufacturing work orders information based on the delayed completion schedules and project. Click the Options icon to select Project Number or Organization or Assembly from the Dimension menu and Completion Delayed Dates from the Group Dimensions. |
| Purchase Order Shipments by Alert (chart) | This chart provides project manufacturing purchase order shipment information based on at-risk and overdue alert types. Click the Options icon to select Shipment Alert Type from the Dimension menu and Group Dimensions menu. |
| Purchase Order Distributions by Need-By Date, Project (chart) | This chart provides project manufacturing purchase order distribution information based on need-by dates and projects. Click the Options icon to select Project Number or Supplier from the Dimension menu and PO Shipment Days in the Group Dimensions menu. You can refine the displayed data in the dashboard by clicking the data point on any of the available charts and the dimension and metric value for a data point. |
| Results Tables (tab layout) | The results tables display information in the following tabs:
Click the Record Details icon in the tabs to view details for a project number. Click the links in the table columns to refine the information in the dashboard. The following actions are available from the Options icon in the tables for the Transactions Schedule Exceptions dashboard:
|
Project Schedule Exceptions Dashboard
As a project manager or a shopfloor supervisor you can use the Project Schedule Exceptions dashboard to view and manage project supply chain and manufacturing exceptions.
Using refinements, you can search on schedule exceptions and overdue information using item number, warehouse, or project and task start dates. You can view Project Manufacturing schedule exceptions and overdue metrics for work orders, sales orders, and procurement activities. See Project Manufacturing Command Center Overview for more information.
From the Project Manufacturing Super User responsibility, navigate to the Project Schedule Exceptions dashboard:
(N) Projects > Project Manufacturing Command Center > Risk Monitor (tab) > Project Schedule Exceptions (tab)
Project Schedule Exceptions Dashboard
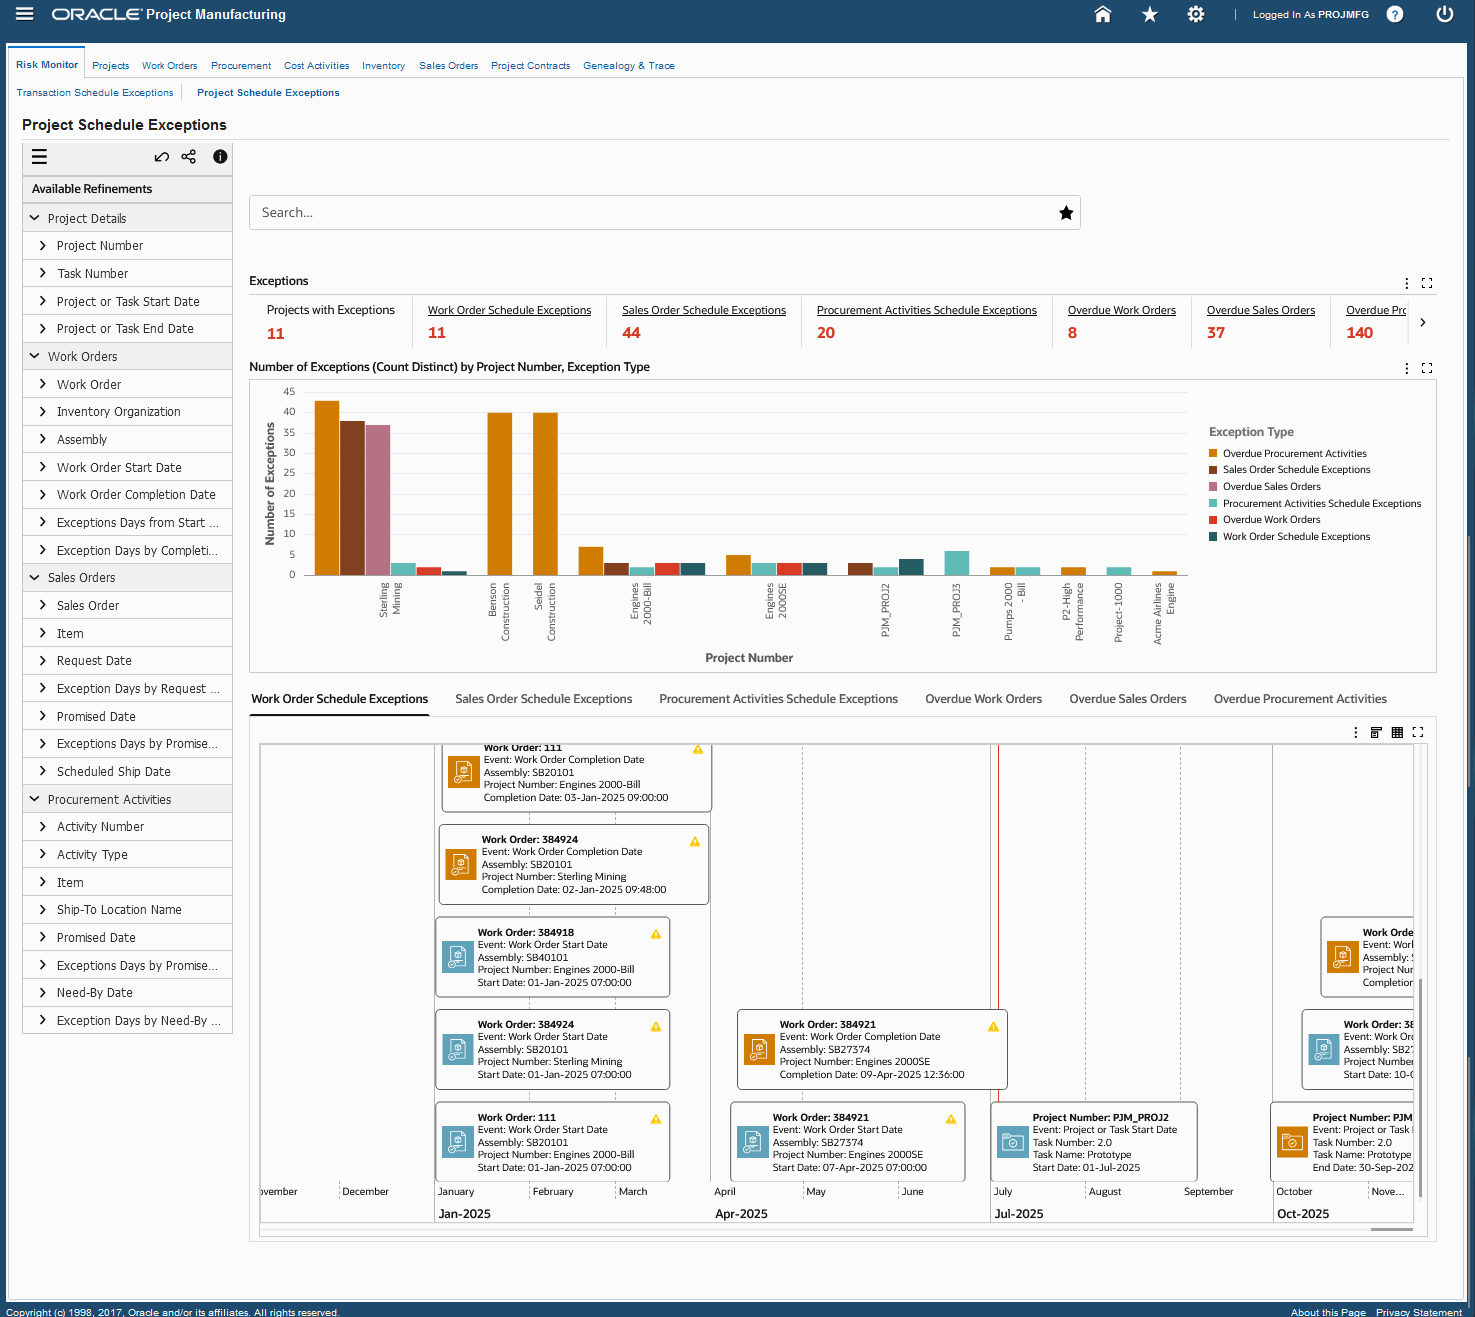
The following table describes the Project Schedule Exceptions dashboard components:
| Component | Description |
| Exceptions (summary bar) | The Exceptions summary bar displays the following key metrics:
|
| Number of Exceptions (Count Distinct) by Project Number, Exception Type (chart) | This chart provides project manufacturing schedule exceptions information about work orders, sales orders, purchase orders, quotations, requisitions, and blanket releases based on project number and exception type. You can refine the displayed data by clicking the data point on the chart and the dimension and metric value for a data point. Click the Options icon to select Project Number or Exception Type from the Dimension menu and the Group Dimensions menu. |
| Results Tables (tab layout) | The results tables display schedule exception and overdue information in the following tabs:
Click the Record Details icon in the tabs to view details for a project number. On the Work Order Schedule Exceptions and Overdue Work Orders tabs, click the Actions icon to select the following actions:
On Sales Order Schedule Exceptions tab, click the Actions icon to select the following actions:
On the Procurement Activities Schedule Exceptions tab, select purchase orders and then click the Actions icon to select the following actions:
On the Overdue Sales Order click the Network icon to view the project details in the Genealogy & Trace dashboard. On the Overdue Procurement Activities tab, select purchase orders and then click the Network icon to view the project details in the Genealogy & Trace dashboard. To view key events for work orders, sales orders, and procurement activities schedule exceptions in the Timeline View, click the Timeline View icon in the following tabs:
Click the links in the table columns to refine the information in the dashboard. The following actions are available from the Options icon in the tables for the Project Schedule Exceptions dashboard:
|
Projects Dashboard
As a project manager you can use the Projects dashboard to track project activities. Use this dashboard to:
-
Monitor manufacturing project and task details including budget, cost, revenue margin and backlog.
-
View and manage projects, tasks, and commitments.
-
Analyze manufacturing project expenditures.
-
Track status of supply commitments.
Using refinements, you can view specific project manufacturing metrics, charts, and results tables for projects. See Project Manufacturing Command Center Overview for more information.
From the Project Manufacturing Super User responsibility, navigate to the Projects dashboard:
(N) Projects > Project Manufacturing Command Center > Projects (tab)
Projects Dashboard
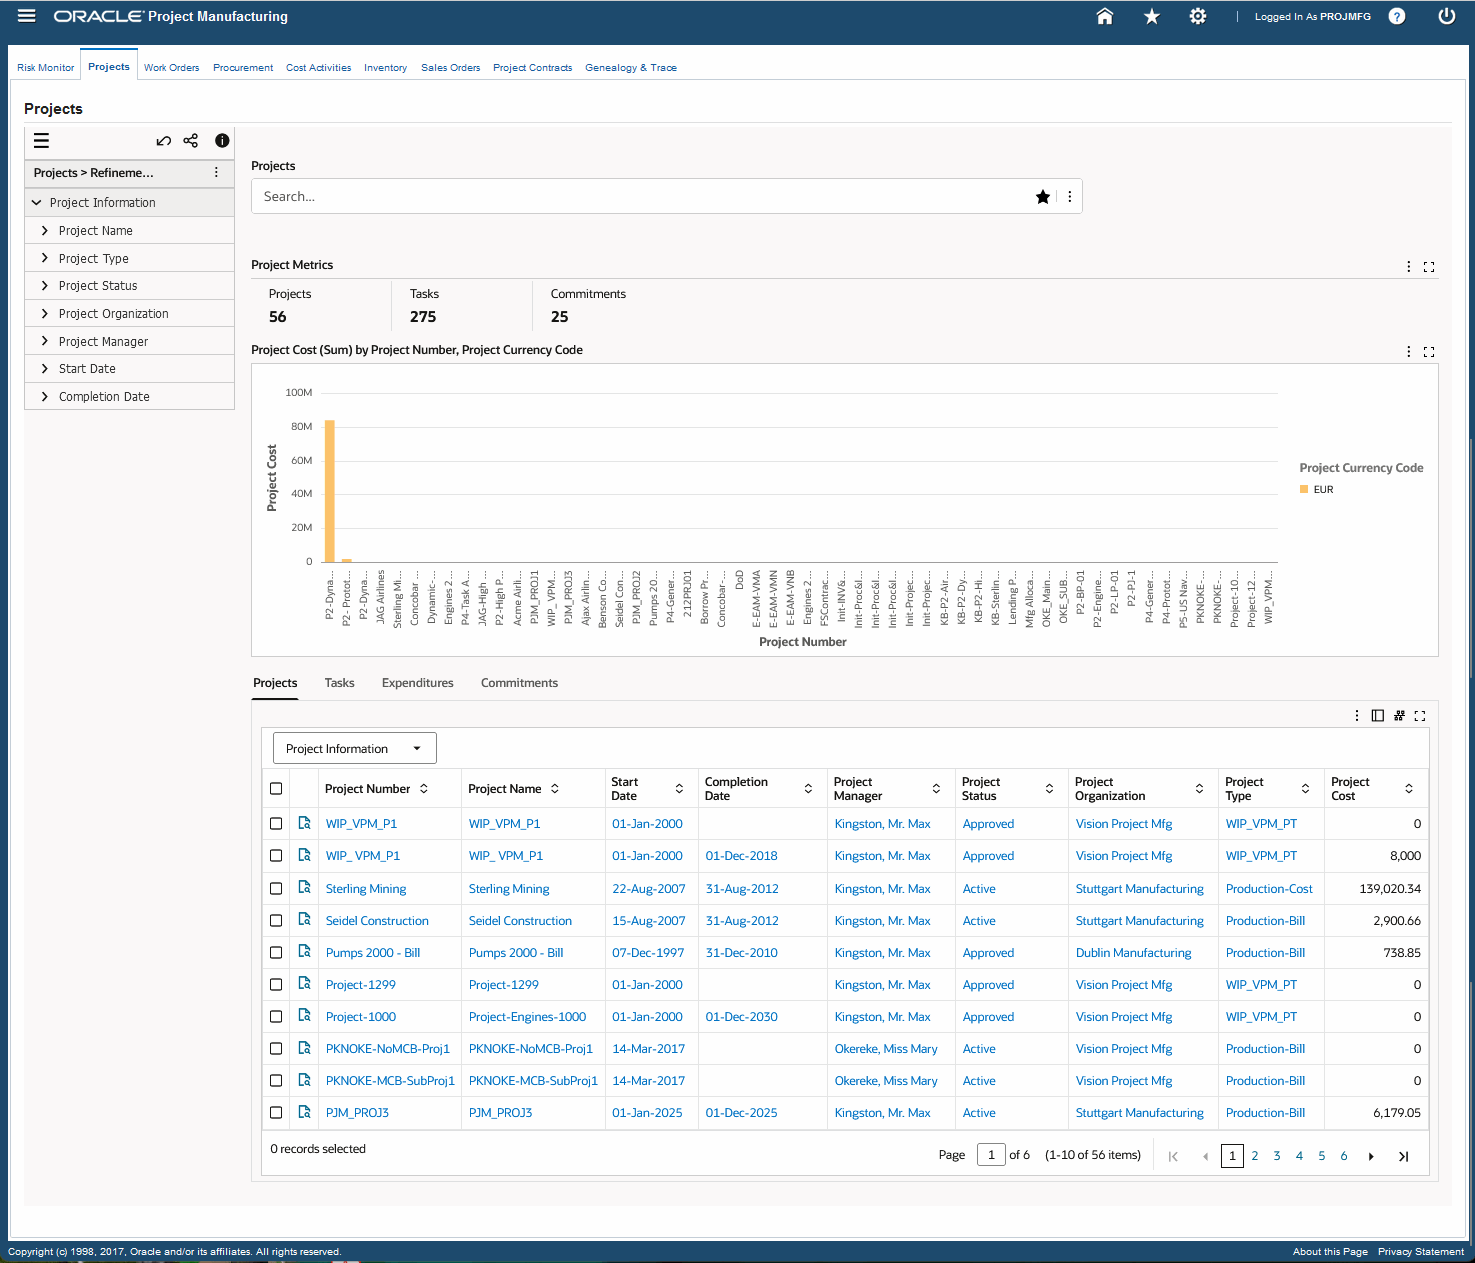
The following table describes the Projects dashboard components:
| Component | Description |
| Project Metrics (summary bar) | The Project Metrics summary bar displays the following key metrics:
|
| Project Costs (Sum) by Project Number, Project Currency Code (chart) | This chart provides information about project manufacturing project costs based on project numbers and the currency codes. You can refine the displayed data by clicking the data point on the chart and the dimension and metric value for a data point. Click the Options icon to select Project Number or Project Currency Code from the Dimension menu and the Group Dimensions menu. |
| Results Tables (tab layout) | The results tables display schedule exception and overdue information in the following tabs:
Click the Record Details icon in the tabs to view details for a project number. On the Projects tab, you can select the following entries from the drop-down list to see additional details:
Click the Timeline View icon on the Projects tab, to view the following key events for projects in the Timeline View:
Click Timeline View Option icon to enable the overview display and the maximum number of events of up to 500. On the Commitments tab, you can select the following entries from the drop-down list to see additional details:
Click the links in the table columns to refine the information in the dashboard. The following actions are available from the Options icon in the tables for the Projects dashboard:
|
Work Orders Dashboard
As a project manager or shopfloor supervisor, you can use the Work Orders dashboard to track project WIP jobs and operations. Use this dashboard to:
-
Monitor work order execution.
-
Analyze job operations, component issues and line schedules.
-
Track status and progress of work orders.
-
Ensure timely completion of work orders.
-
View the track and trace genealogy diagram for project supply chain activities and processes in the Genealogy & Trace dashboard.
Using refinements, you can view project manufacturing work order metrics, charts, and results tables. See Project Manufacturing Command Center Overview for more information.
From the Project Manufacturing Super User responsibility, navigate to the Work Orders dashboard:
(N) Projects > Project Manufacturing Command Center > Work Orders (tab)
Work Orders Dashboard
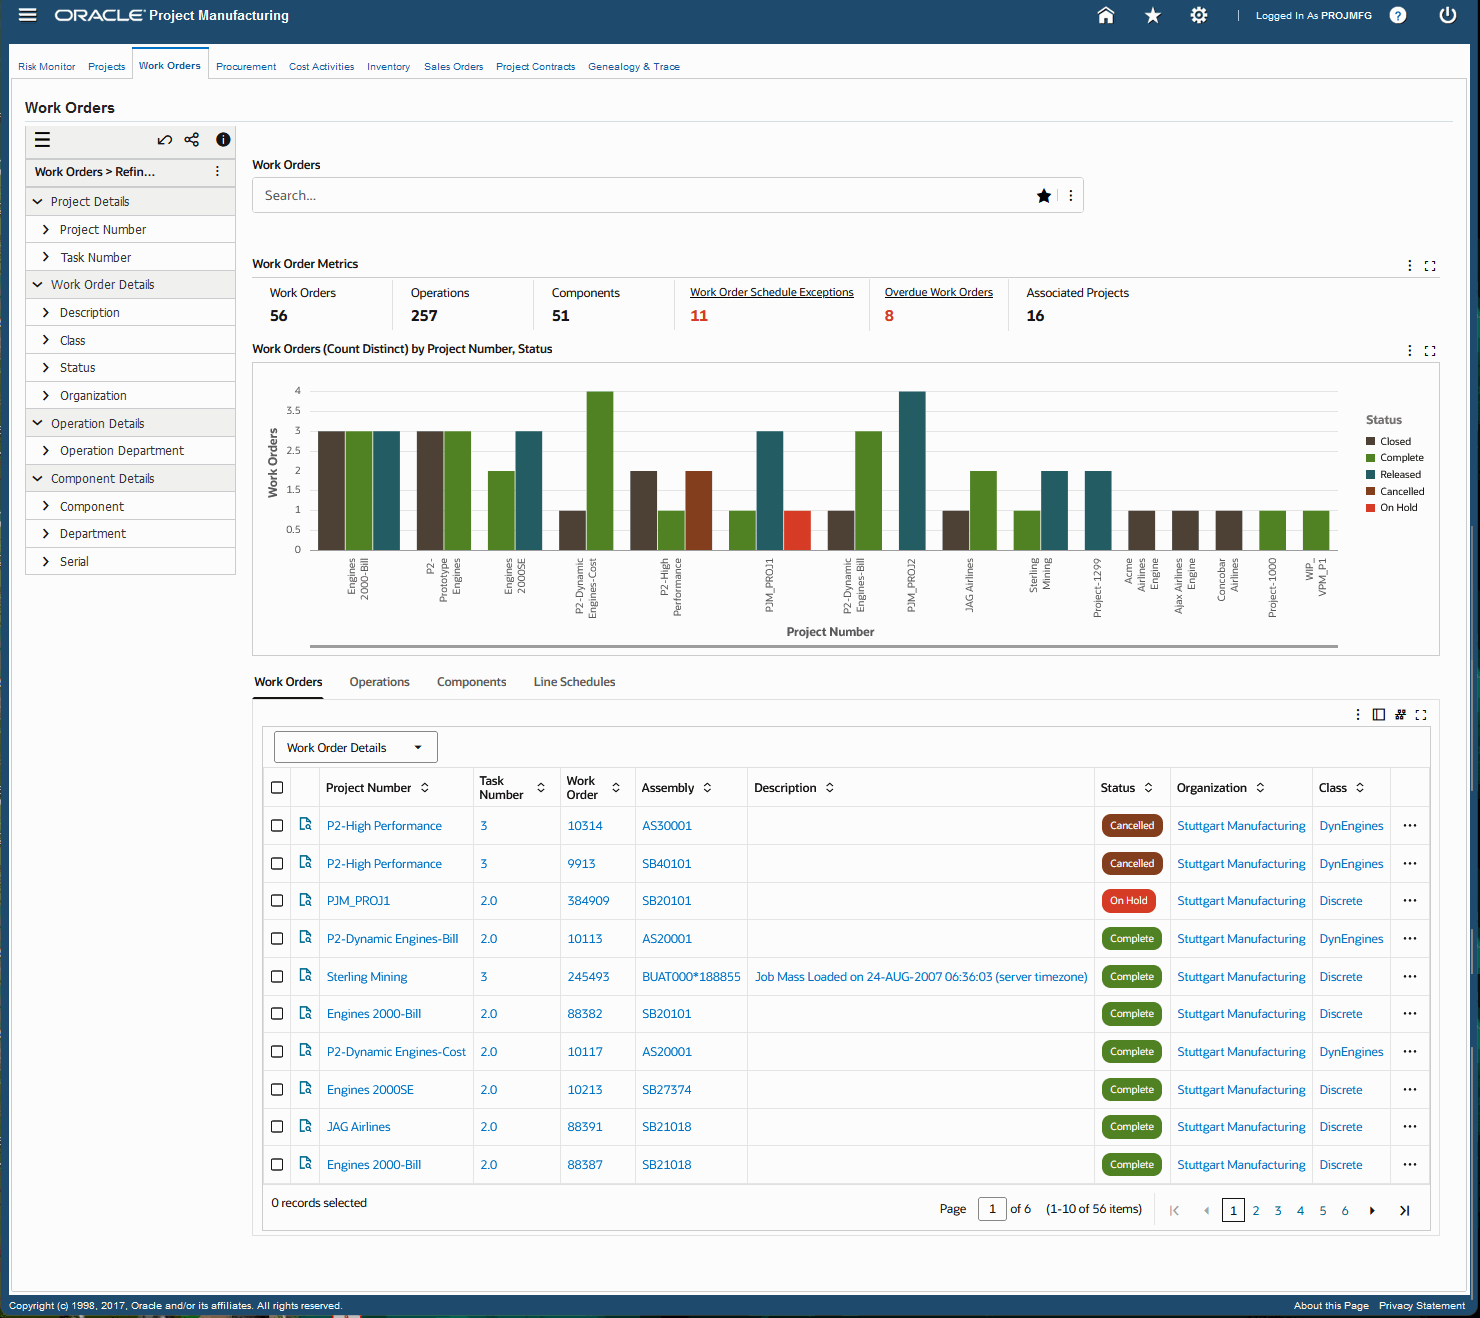
The following table describes the Work Orders dashboard components:
| Component | Description |
| Work Order Metrics (summary bar) | The Work Order Metrics summary bar displays the following key metrics:
|
| Work Orders (Count Distinct) by Project Number, Status (chart) | This chart provides information about project manufacturing work orders based on project numbers and the status of the work orders like for example if they are released, unreleased, cancelled, complete, on-hold, or closed. You can refine the displayed data by clicking the data point on the chart and the dimension and metric value for a data point. Click the Options icon to Select Project Number or Status from the Dimension menu and the Group Dimensions menu. |
| Results Tables (tab layout) | The results tables display project manufacturing work order information in the following tabs:
Click the Record Details icon in the tabs to view details for a project number. Click the links in the table columns to refine the information in the dashboard. The following actions are available from the Options icon in the tables for the Work Orders dashboard:
|
Procurement Dashboard
As a project manager or procurement buyer, you can use the Procurement dashboard to manage procurement activities for manufacturing projects. The Procurement dashboard in the Project Manufacturing Command Center is comprised of the following three dashboards:
You can use the available dashboards in the Procurement dashboard to:
-
Track status of sourcing documents, requisitions, and purchase orders.
-
Ensure on-time delivery of project material by suppliers.
-
Get visibility into shipment commitments and distributions.
-
View the track and trace genealogy diagram for project supply chain activities and processes in the Genealogy & Trace dashboard.
Using refinements, you can view specific information based on your selection in all three dashboards of the Procurement dashboard. See Project Manufacturing Command Center Overview for more information.
From the Project Manufacturing Super User responsibility, navigate to the Procurement dashboard:
(N) Projects > Project Manufacturing Command Center > Procurement (tab)
From the Procurement dashboard, you can select the following tabs:
-
Purchase Orders
-
Requisitions
-
Negotiations
Purchase Orders Dashboard
To view and manage purchase order details, navigate to the Project Manufacturing Command Center's Purchase Orders dashboard:
(N) Projects > Project Manufacturing Command Center > Procurement (tab) > Purchase Orders (tab)
Purchase Orders Dashboard
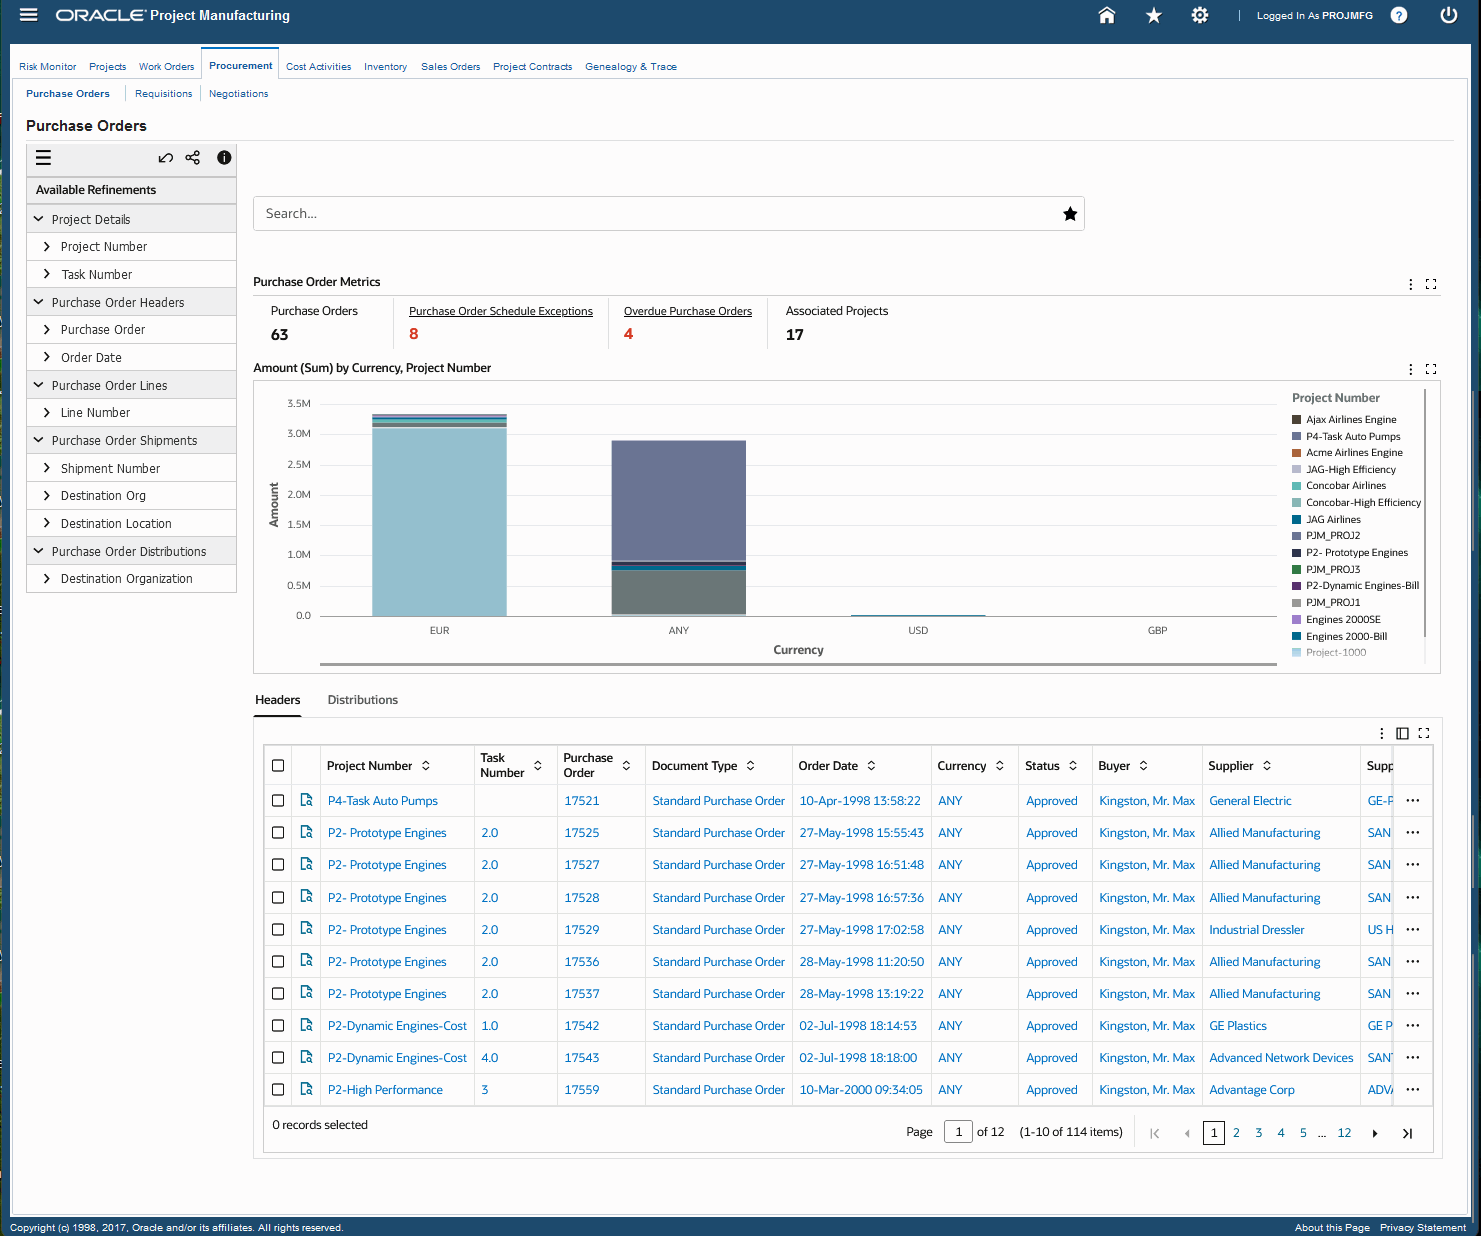
The following table describes the components of the Purchase Orders dashboard:
| Component | Description |
| Purchase Order Metrics (summary bar) | The Purchase Order Metrics summary bar displays the following key metrics:
|
| Amount (Sum) by Currency, Project Number (chart) | This chart provides information about project manufacturing purchase order amounts based on currency and project number or destination organization. You can refine the displayed data by clicking the data point on the chart and the dimension and metric value for a data point. Click the Options icon to select Project Number or Destination Organization from the Dimension menu. Select Currency from the Group Dimensions menu. |
| Results Tables (tab layout) | The results tables display different levels of purchase order information in the following tabs:
Click the Record Details icon in the tabs to view details for a project number. On the Headers and Distribution tabs, click the Actions icon to select the following actions:
On the Distributions tab, click the Timeline View icon to view the following key events for purchase orders:
Click Timeline View Option to enable the overview display and the maximum number of events of up to 500. Click the links in the table columns to refine the information in the dashboard. The following actions are available from the Options icon in the tables for the Purchase Orders dashboard:
|
Requisitions Dashboard
To view and manage project manufacturing requisitions details, navigate to the Project Manufacturing Command Center's Requisitions dashboard:
(N) Projects > Project Manufacturing Command Center > Procurement (tab) > Requisitions (tab)
Requisitions Dashboard
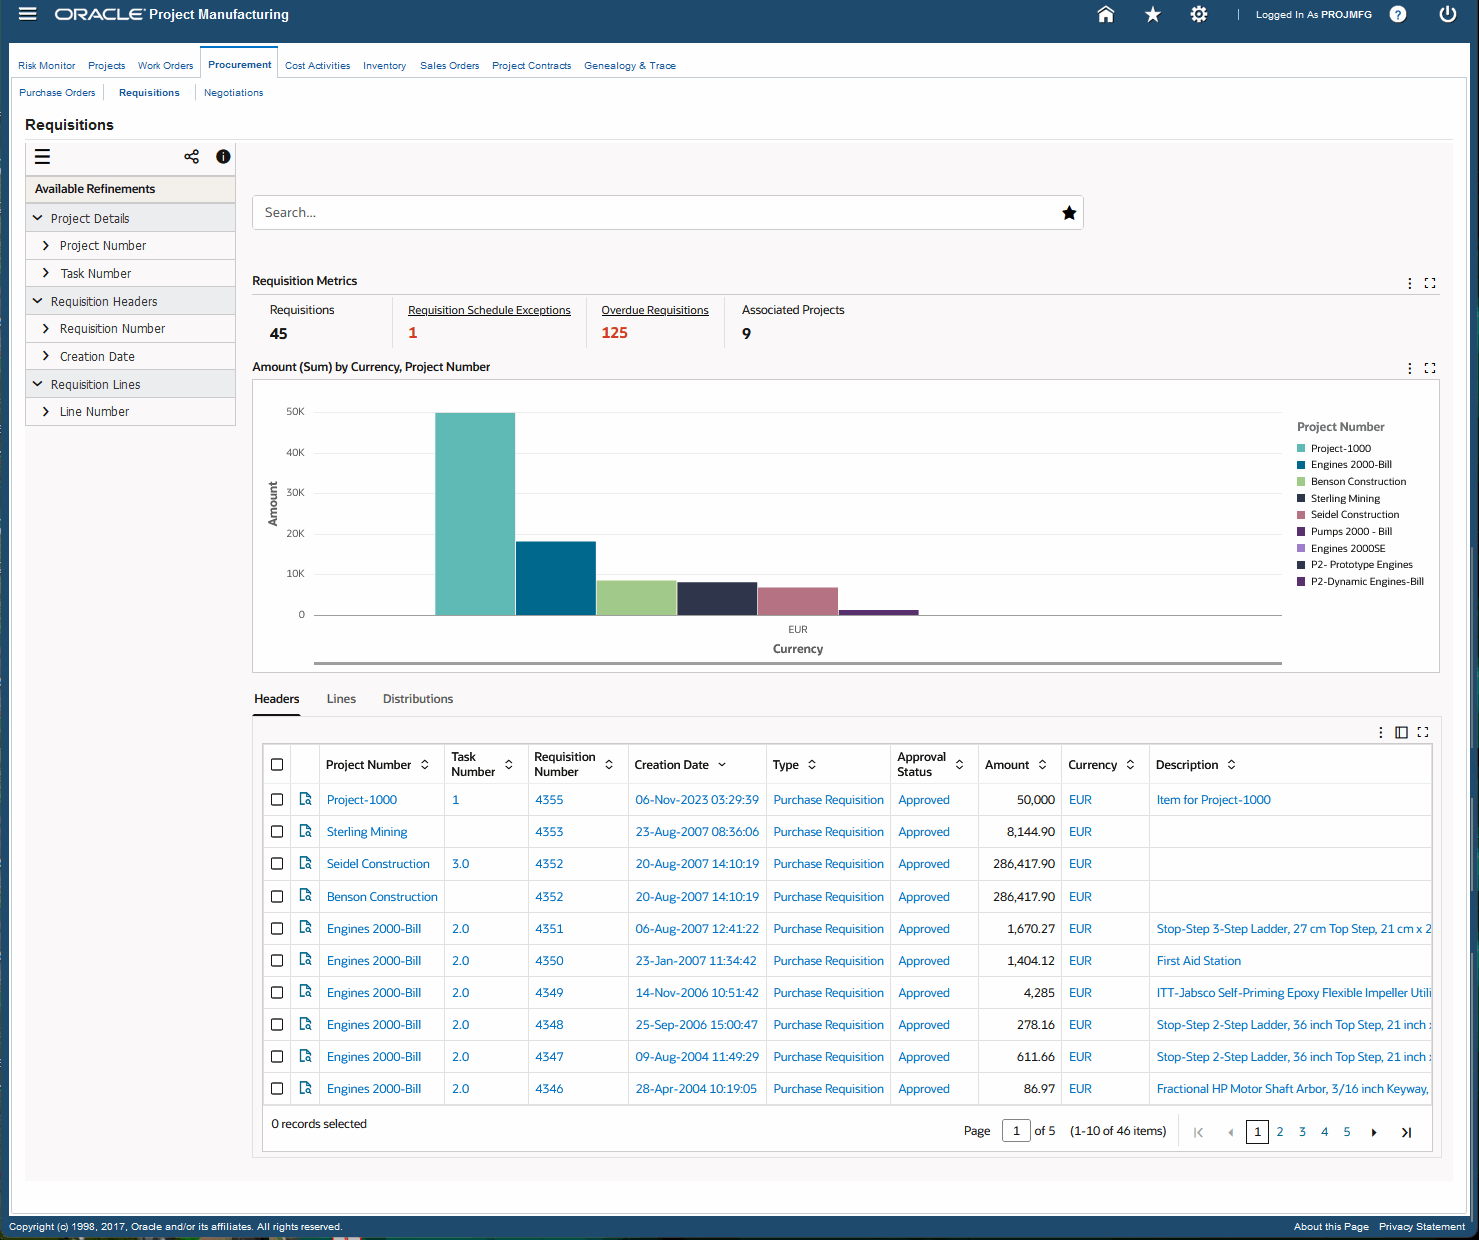
The following table describes the components of the Requisitions dashboard:
| Component | Description |
| Requisition Metrics (summary bar) | The Requisition Metrics summary bar displays the following key metrics:
|
| Amount (Sum) by Currency, Project Number (chart) | This chart provides information about project manufacturing requisition amounts based on currency and project number or destination organization. You can refine the displayed data by clicking the data point on the chart and the dimension and metric value for a data point. Click the Options icon to select Project Number or Destination Organization from the Dimension menu. Select Currency from the Group Dimensions menu. |
| Results Tables (tab layout) | The results tables display different levels of requisition information in the following tabs:
Click the Record Details icon in the tabs to view details for a project number. Click the links in the table columns to refine the information in the dashboard. The following actions are available from the Options icon in the tables for the Requisitions dashboard:
|
Negotiations Dashboard
The Negotiations dashboard comprises the following three tabs:
-
Quotations - Use this tab to review the metrics, charts, and results tables for project manufacturing quotations.
-
Blanket Releases - Use this tab to review the metrics, charts, and results tables for project manufacturing blanket releases.
-
RFQs - Use this tab to review the metrics, charts, and results tables for project manufacturing RFQs.
To view and manage project manufacturing quotations, blanket releases, and RFQs, navigate to the Project Manufacturing Command Center's Negotiations dashboard:
(N) Projects > Project Manufacturing Command Center > Procurement (tab) > Negotiations (tab)
Negotiations Dashboard
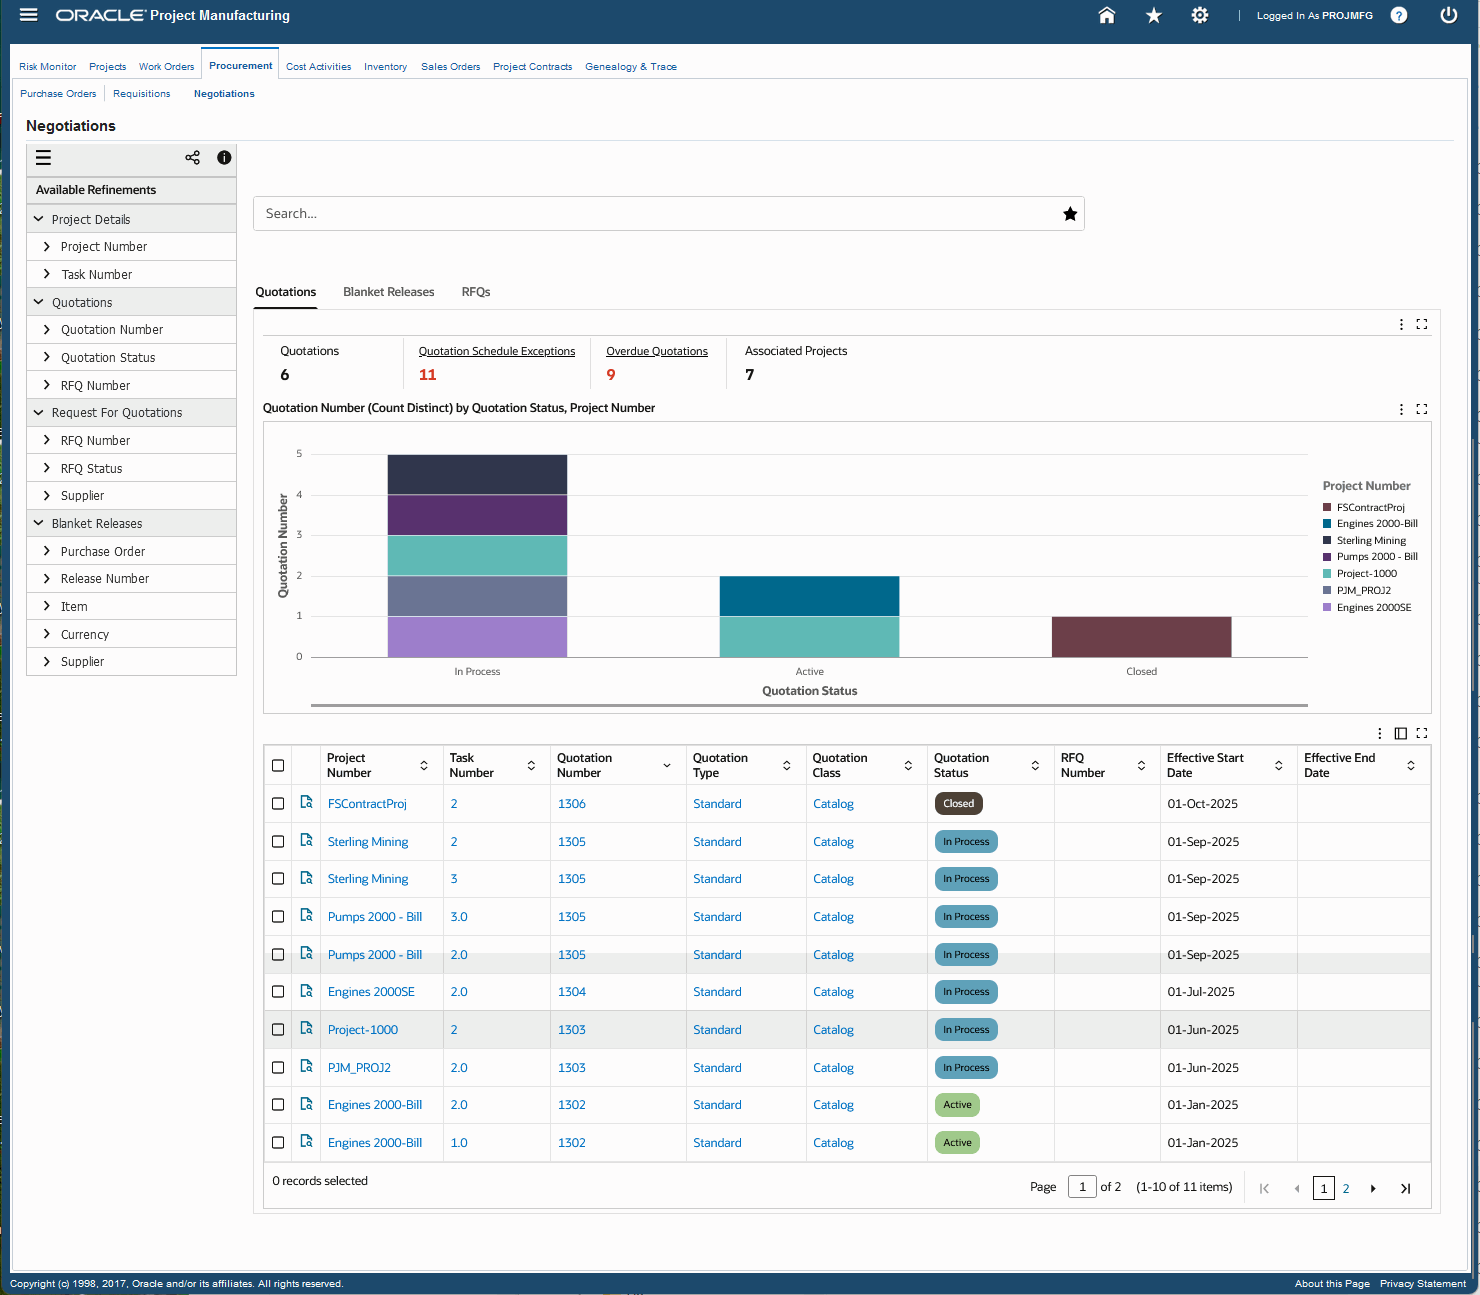
The following table describes the components of the Negotiations dashboard's Quotations tab:
| Component | Description |
| Quotations (summary bar) | The Quotations summary bar displays the following key metrics:
|
| Quotation Number (Count Distinct) by Project Number, Quotation Status (chart) | This chart provides information about the number of quotations based on quotation status and project number. You can refine the displayed data by clicking the data point on the chart and the dimension and metric value for a data point. Click the Options icon to select Quotation Status or Project Number from the Dimension menu and the Group Dimensions menu. |
| Results Tables (tab layout) | The results tables display procurement information for quotations like project number, task number, quotation number, quotation type, quotation class, quotation status, RFQ number, effective date, and expiration date. Click the Record Details icon in the table to view details for a project number. Click the links in the table columns to refine the information in the dashboard. The following actions are available from the Options icon in the Quotations dashboard tables:
|
The following table describes the components of the Negotiations dashboard's Blanket Releases tab:
| Component | Description |
| Blanket Releases (summary bar) | The Blanket Releases summary bar displays the following key metrics:
|
| Blanket Release Amount (Sum) by Project Number, Currency (chart) | This chart provides information about blanket release cost metrics based on project numbers and currency. You can refine the displayed data by clicking the data point on the chart and the dimension and metric value for a data point. Click the Options icon to select Project Number or Currency from the Dimension menu and the Group Dimensions menu. |
| Results Tables (tab layout) | The results tables display procurement information for blanket releases like project number, task number, PO number, release number, item number, item description, line number, shipment number, distribution number, release date amount, currency, and so on. Click the Record Details icon in the table to view details for a project number. Click the links in the table columns to refine the information in the dashboard. The following actions are available from the Options icon in the Blanket Releases dashboard tables:
|
The following table describes the components of the Negotiations dashboard's RFQs tab:
| Component | Description |
| RFQs (summary bar) | The RFQs summary bar displays the following key metrics:
|
| RFQ Number (Count Distinct) by RFQ Status, Project Number (chart) | This chart provides information about RFQs based on RFQ status and project numbers. You can refine the displayed data by clicking the data point on the chart and the dimension and metric value for a data point. Click the Options icon to select Project Number or RFQ Status from the Dimension menu and the Group Dimensions menu. |
| Results Tables (tab layout) | The results tables display procurement information for RFQs like project number, task number, RFQ number, RFQ status, buyer, supplier, supplier site, supplier contact name, and reply date. Click the Record Details icon in the table to view details for a project number. Click the links in the table columns to refine the information in the dashboard. The following actions are available from the Options icon in the RFQs dashboard tables:
|
Cost Activities Dashboard
As a project manager, a cost manager, or if in a financial role, you can use the Cost Activities dashboard to summarize project manufacturing costs to facilitate reconciliation with cost in Oracle Projects. Use this dashboard to:
-
Analyze manufacturing project costs by cost element.
-
Gain insights into project and cost group variance.
-
Access detailed transactions that comprise the totals displayed on the dashboard.
-
View timely and detailed manufacturing cost information to track project performance.
Using refinements, you can view specific project manufacturing metrics, charts, and results tables for project cost activities. See Project Manufacturing Command Center Overview for more information.
From the Project Manufacturing Super User responsibility, navigate to the Cost Activities dashboard:
(N) Projects > Project Manufacturing Command Center > Cost Activities (tab)
Cost Activities Dashboard
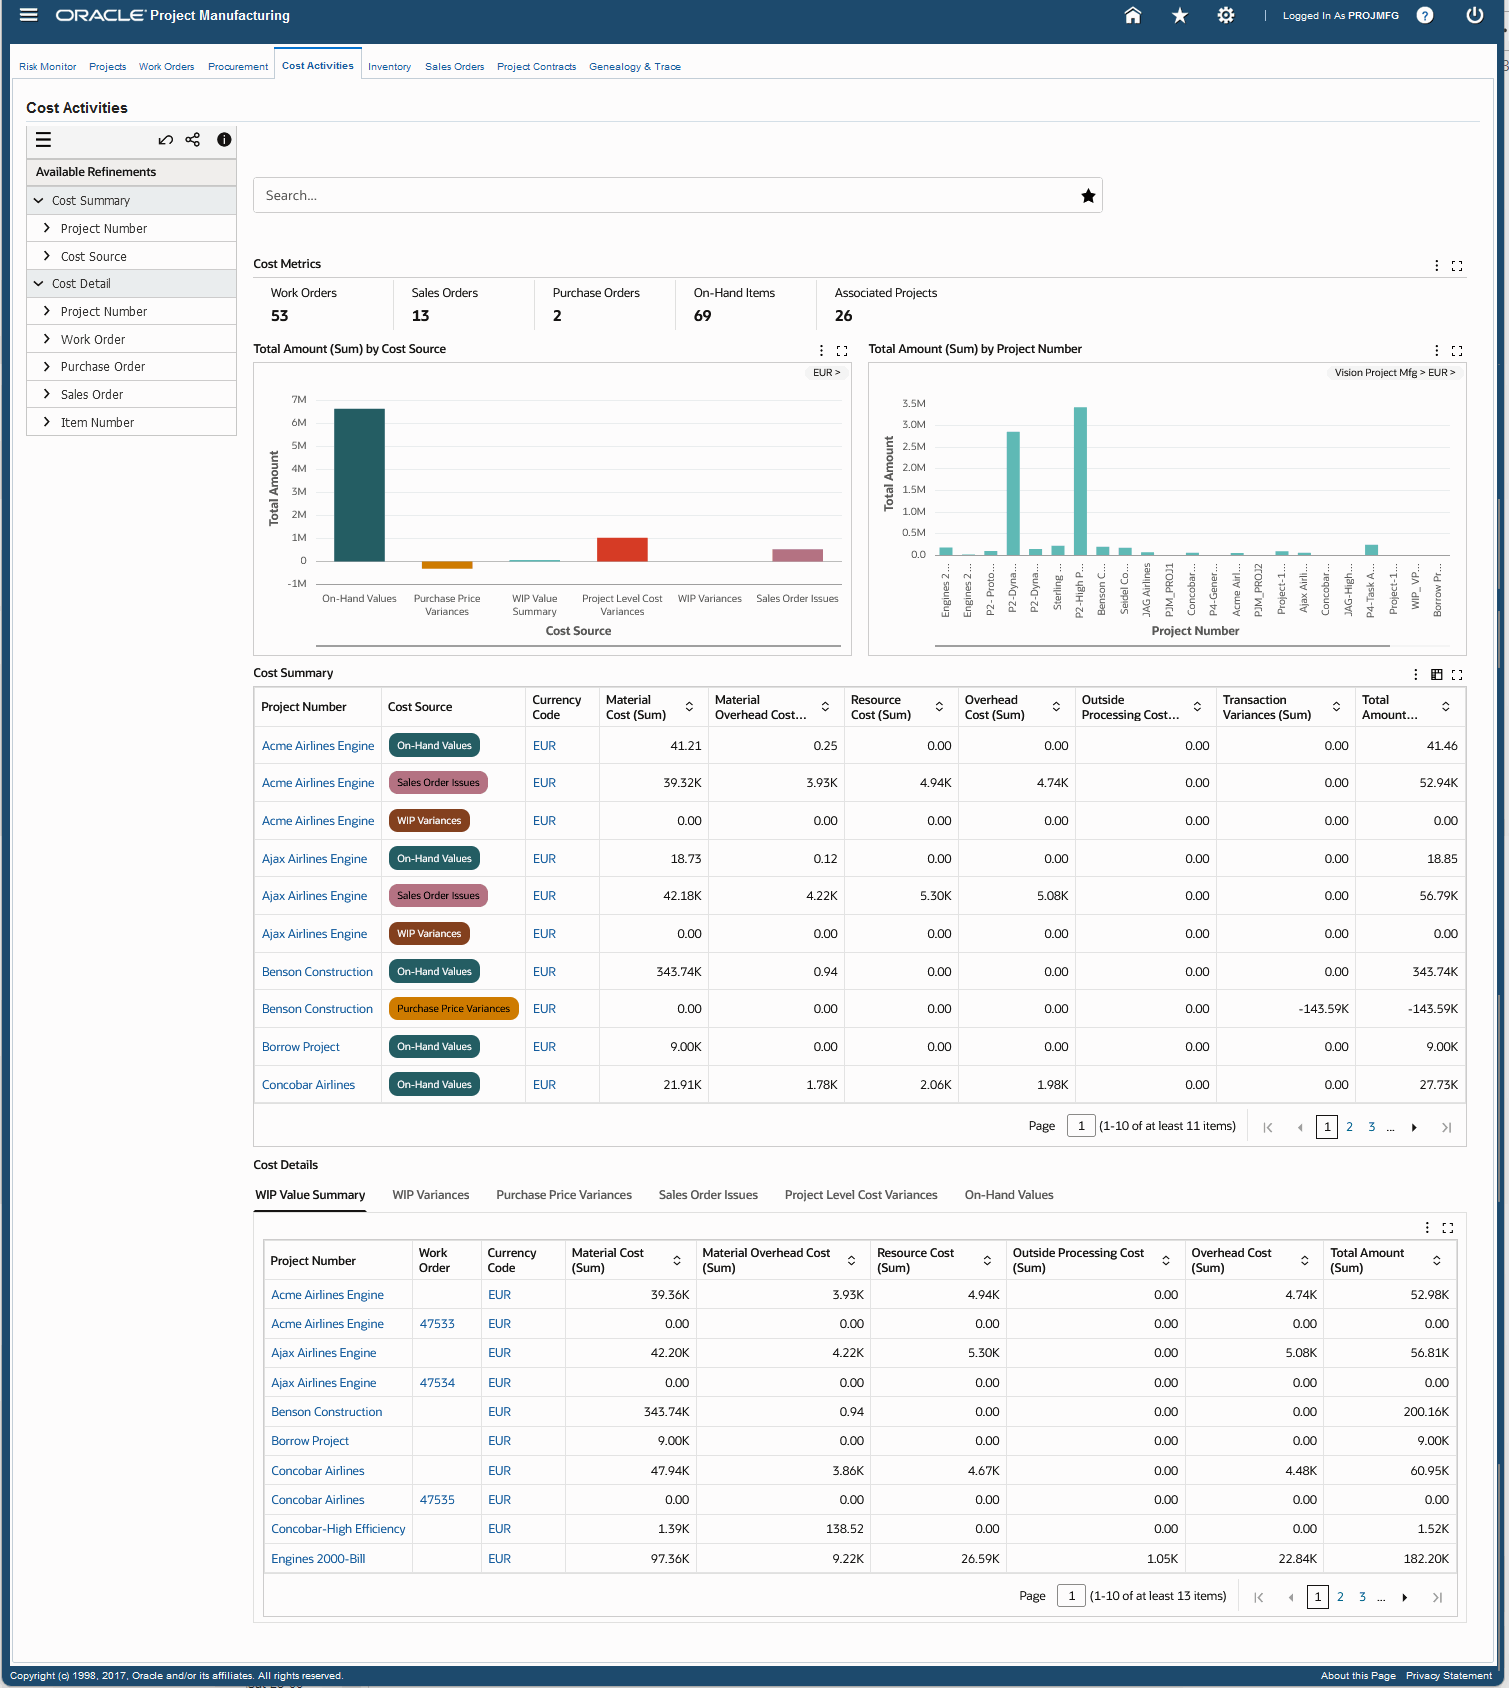
The following table describes the Cost Activities dashboard components:
| Component | Description |
| Cost Metrics (summary bar) | The Cost Metrics summary bar displays the following key metrics for transactions that have associated costs:
|
| Total Amount (Sum) by Cost Source (chart) | This chart provides information about project manufacturing cost activities based on cost source and total amount. You can refine the displayed data by clicking the data point on the chart and the dimension and metric value for a data point. Click the Options icon to select Cost Source, Project Number or Currency Code from the Dimension menu. The following cost sources in this chart are color coded for easy reference:
|
| Total Amount (Sum) by Project Number (chart) | This chart provides information about project manufacturing project costs based on project numbers and the total amount. You can refine the displayed data by clicking the data point on the chart and the dimension and metric value for a data point. Click the Options icon to select Currency Code, Project Number, or Organization Name from the Dimension menu. |
| Cost Summary (table) | This table displays information for each project and cost source combination based on the currency. You can view the Currency Code, Material Cost, Material Overhead Cost, Resource Cost, Outside Processing Cost, Overhead Cost, Transaction Variances, and Total Amount. You can also see the sum of all the entries in the table grouped by Project Number and Cost Source. The Cost Summary table displays aggregations based on the attributes and metrics that you select. Click the Options icon to select attributes and metrics and click Update to update the cost details in the Cost Summary table. Click the Aggregated Table icon to see cost aggregations. |
| Results Tables (tab layout) | The Cost Details results tables display details of project cost in the following tabs:
Click the links in the table columns to refine the information in the dashboard. Click the Options icon to show or hide attributes in the results tables. |
Inventory Dashboard
As a project manager, inventory manager, or a shopfloor supervisor, you can use the Inventory dashboard to manage project materials and on-hand inventory information. Use this dashboard to:
-
Analyze project on-hand quantity by item and project locator.
-
Analyze project on-hand value by item and cost group.
-
Proactively manage project material transfer, borrow, or payback actions to resolve material shortages exceptions to keep project schedules on track.
-
View and compare on-hand balances and values for projects.
Using refinements, you can view specific project manufacturing inventory metrics, charts, and tables. See Project Manufacturing Command Center Overview for more information.
From the Project Manufacturing Super User responsibility, navigate to the Inventory dashboard:
(N) Projects > Project Manufacturing Command Center > Inventory (tab)
Inventory Dashboard
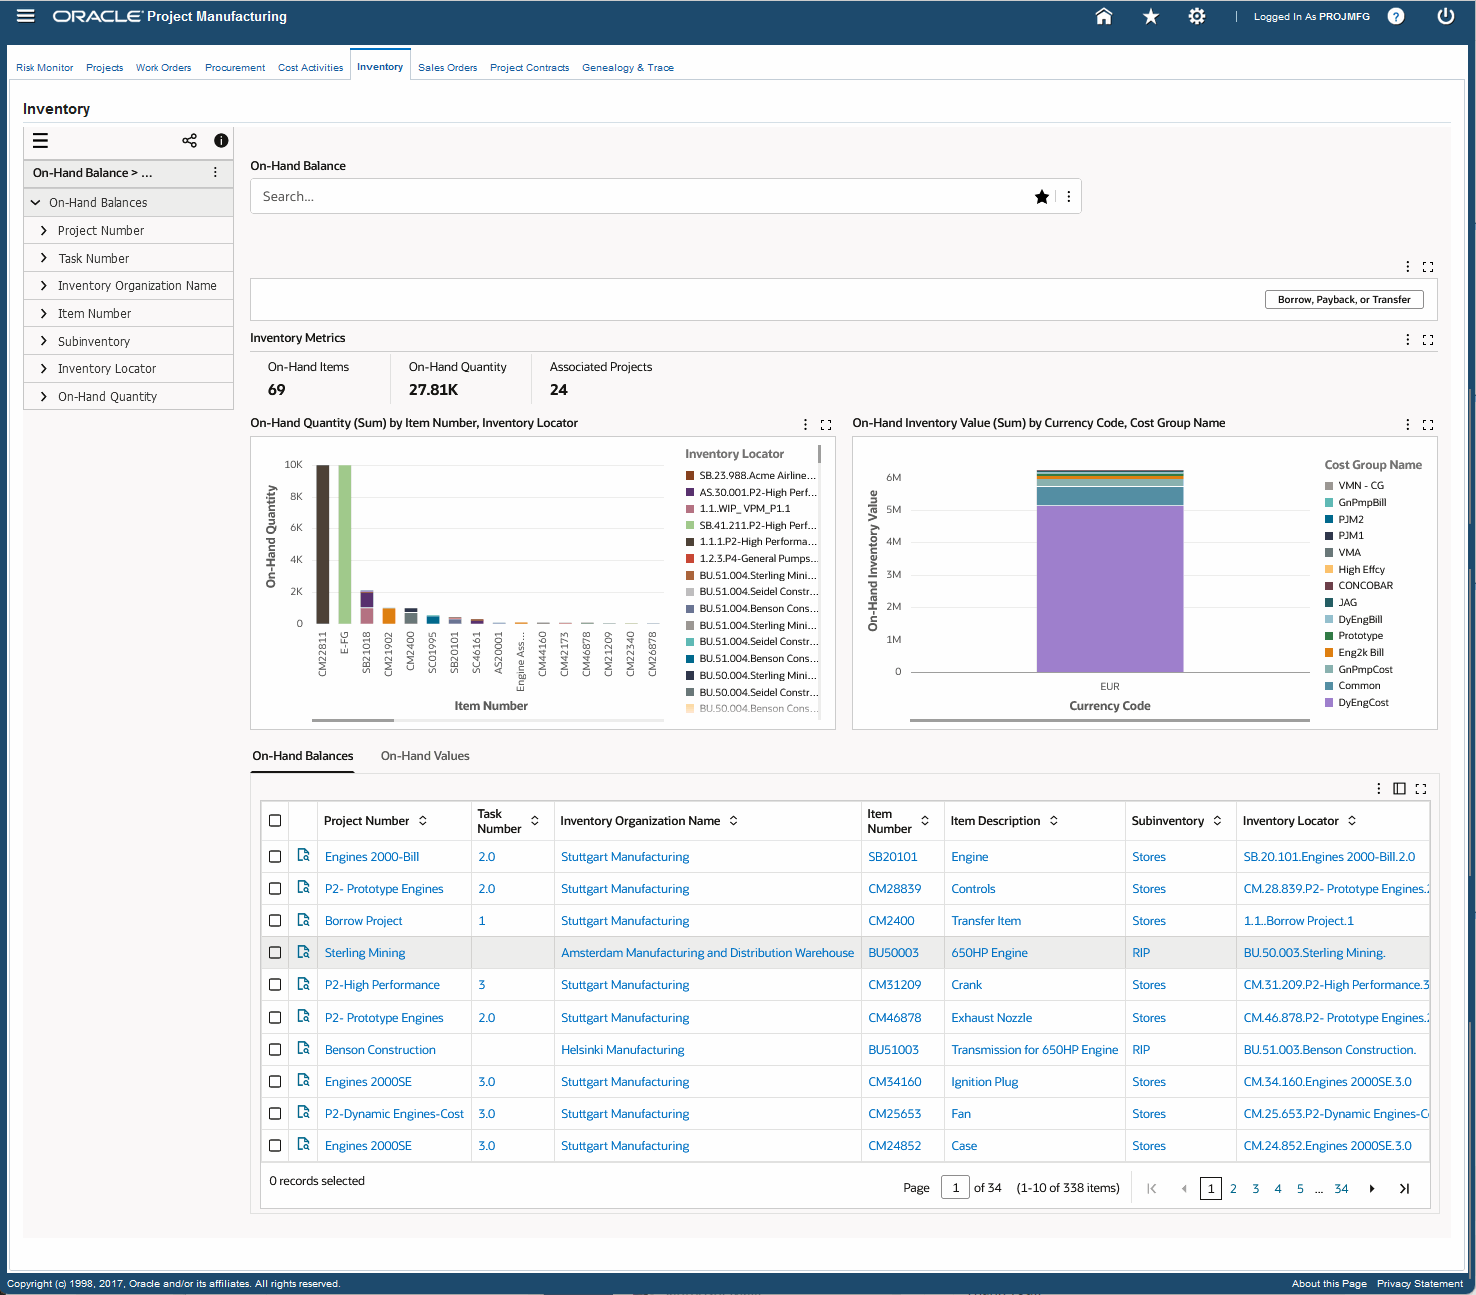
The following table describes the Inventory dashboard components:
| Component | Description |
| Borrow, Payback, or Transfer button | Use this action to navigate to the Project Transfer window to initiate material transfer between project inventories. You can then select from the following inventory transfer transaction types:
|
| Inventory Metrics (summary bar) | The Inventory Metrics summary bar displays the following key metrics:
|
| On-Hand Quantity (Sum) by Item Number, Inventory Locator (chart) | This chart provides information about the on-hand quantity available based on item and inventory locators. You can refine the displayed data by clicking the data point on the chart and the dimension and metric value for a data point. Click the Options icon to select Inventory Locator, Inventory Organization Name, or Project Number from the Dimension menu. Select Item Number from the Group Dimensions menu. |
| On-Hand Inventory Value (Sum) by Currency Code, Cost Group Name (chart) | This chart provides the on-hand inventory value information about the basis of currency codes and cost group names. Click the Options icon to select Cost Group Name or Project Number from the Dimension menu. Select Currency Code from the Group Dimensions menu. |
| Results Tables (tab layout) | The results tables display inventory information for projects in the following tabs:
Click the links in the table columns to refine the information in the dashboard. The following actions are available from the Options icon in the tables for the Inventory dashboard:
|
Sales Orders Dashboard
As a project manager or sales manager, you can use the Sales Orders dashboard to perform sales analysis and ensure timely delivery of products. Use this dashboard to:
-
Analyze and track status of product delivery.
-
Mitigate risks related to project sales order terms.
-
Gain insights into sales by customer and project dimensions.
-
View the track and trace genealogy diagram for project supply chain activities and processes in the Genealogy & Trace dashboard.
Using refinements, you can view specific project manufacturing sales order metrics, charts, and tables. See Project Manufacturing Command Center Overview for more information.
From the Project Manufacturing Super User responsibility, navigate to the Sales Orders dashboard:
(N) Projects > Project Manufacturing Command Center > Sales Orders (tab)
Sales Orders Dashboard
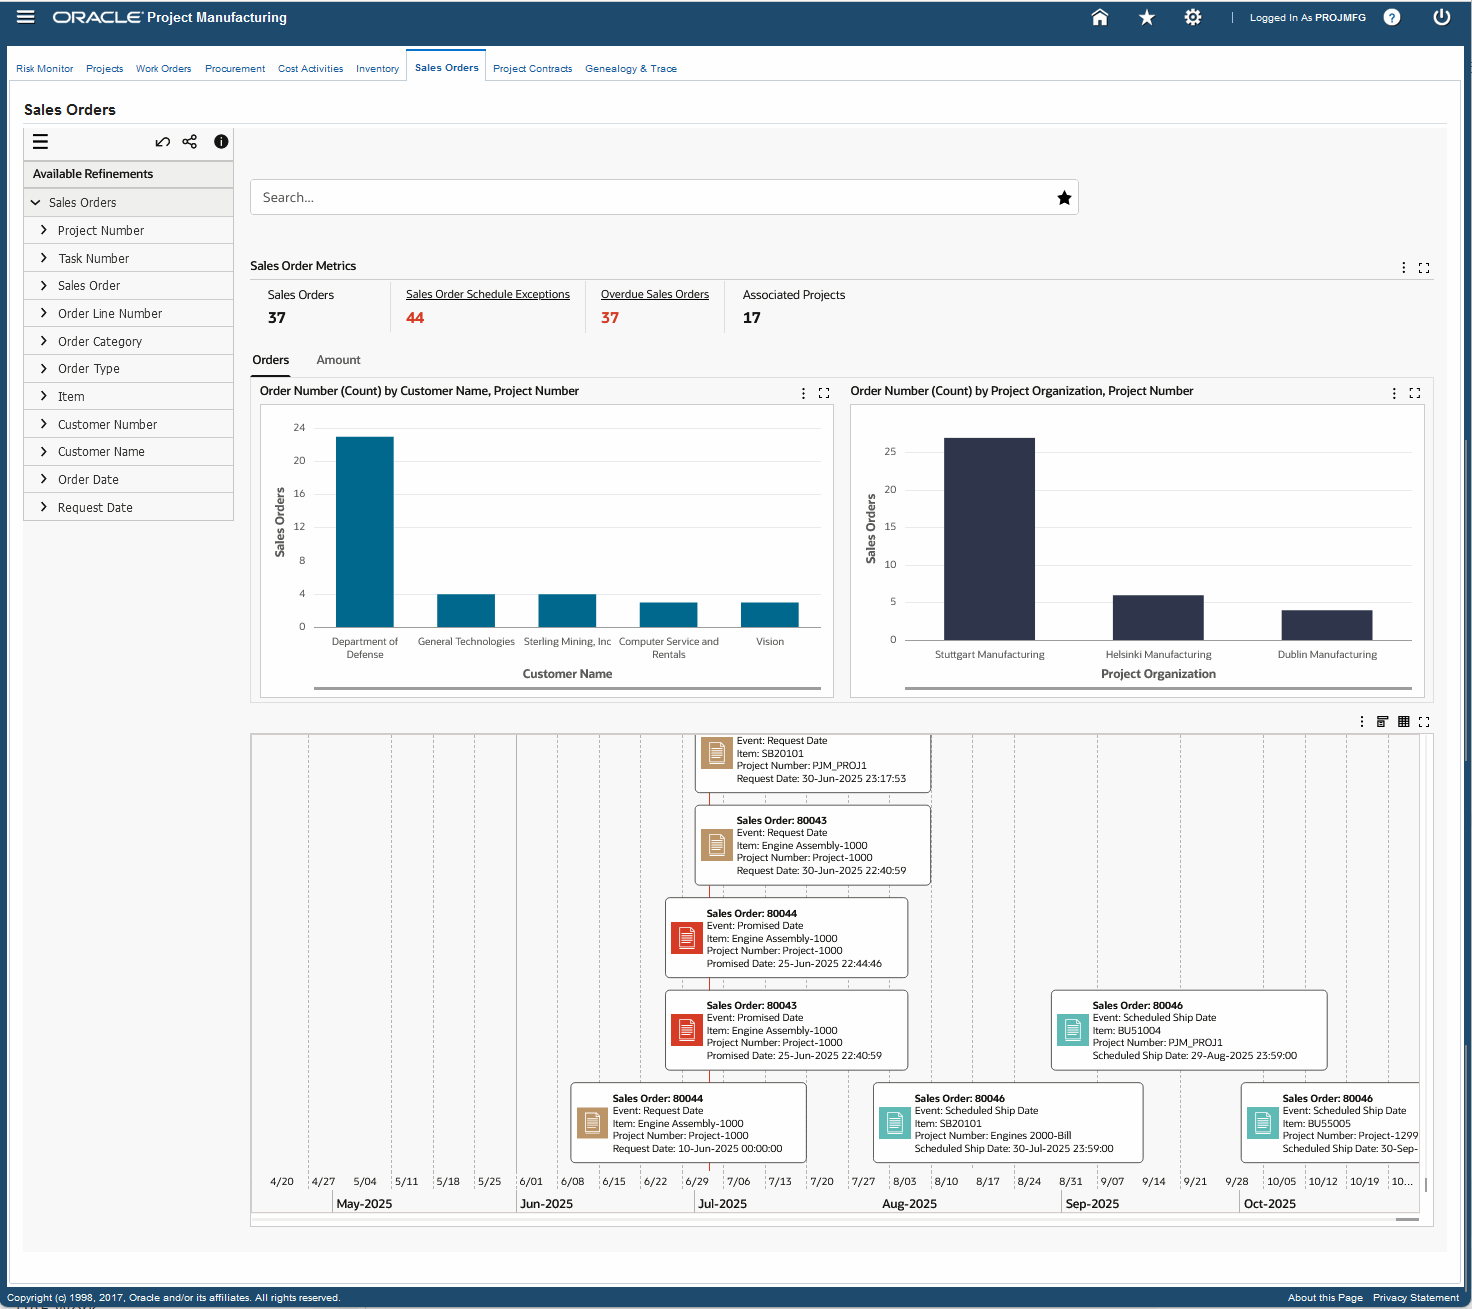
The following table describes the Sales Orders dashboard components:
| Component | Description |
| Sales Order Metrics (summary bar) | The Sales Order Metrics summary bar displays the following key metrics:
|
| Orders (tab) | The Orders tab displays the following charts:
|
| Amount (tab) | The Amount tab displays the following charts:
|
| Results Tables (tab layout) | The results tables display detailed information about sales order for projects like for example project number, task number, order number, order line number, order category and so on. Click the Actions icon in the Sales Order dashboard's results table to select the following actions for a project number:
Click the Timeline View icon in the Sales Orders dashboard's results table to view the following key events for sales orders:
Click Timeline View Option to enable the overview display and the maximum number of events of up to 500. Click the links in the table columns to refine the information in the dashboard. The following actions are available from the Options icon in the tables for the Sales Orders dashboard:
|
Project Contracts Dashboard
As a project manager or contracts manager, you can use the Project Contracts dashboard to perform manufacturing related project contract analysis and ensure timely delivery of products. Use this dashboard to:
-
View and monitor manufacturing project contracts and deliverables.
-
Analyze key metrics and charts to gain insights into project contract status and delivery.
-
Track and trace manufacturing related project contract deliverables.
-
Navigate the Contract Authoring Workbench to view project contract details of selected projects.
Using refinements, you can view specific project manufacturing metrics, charts, and results tables for project contracts. See Project Manufacturing Command Center Overview for more information.
From the Project Manufacturing Super User responsibility, navigate to the Project Contracts dashboard:
(N) Projects > Project Manufacturing Command Center > Project Contracts (tab)
Project Contracts Dashboard
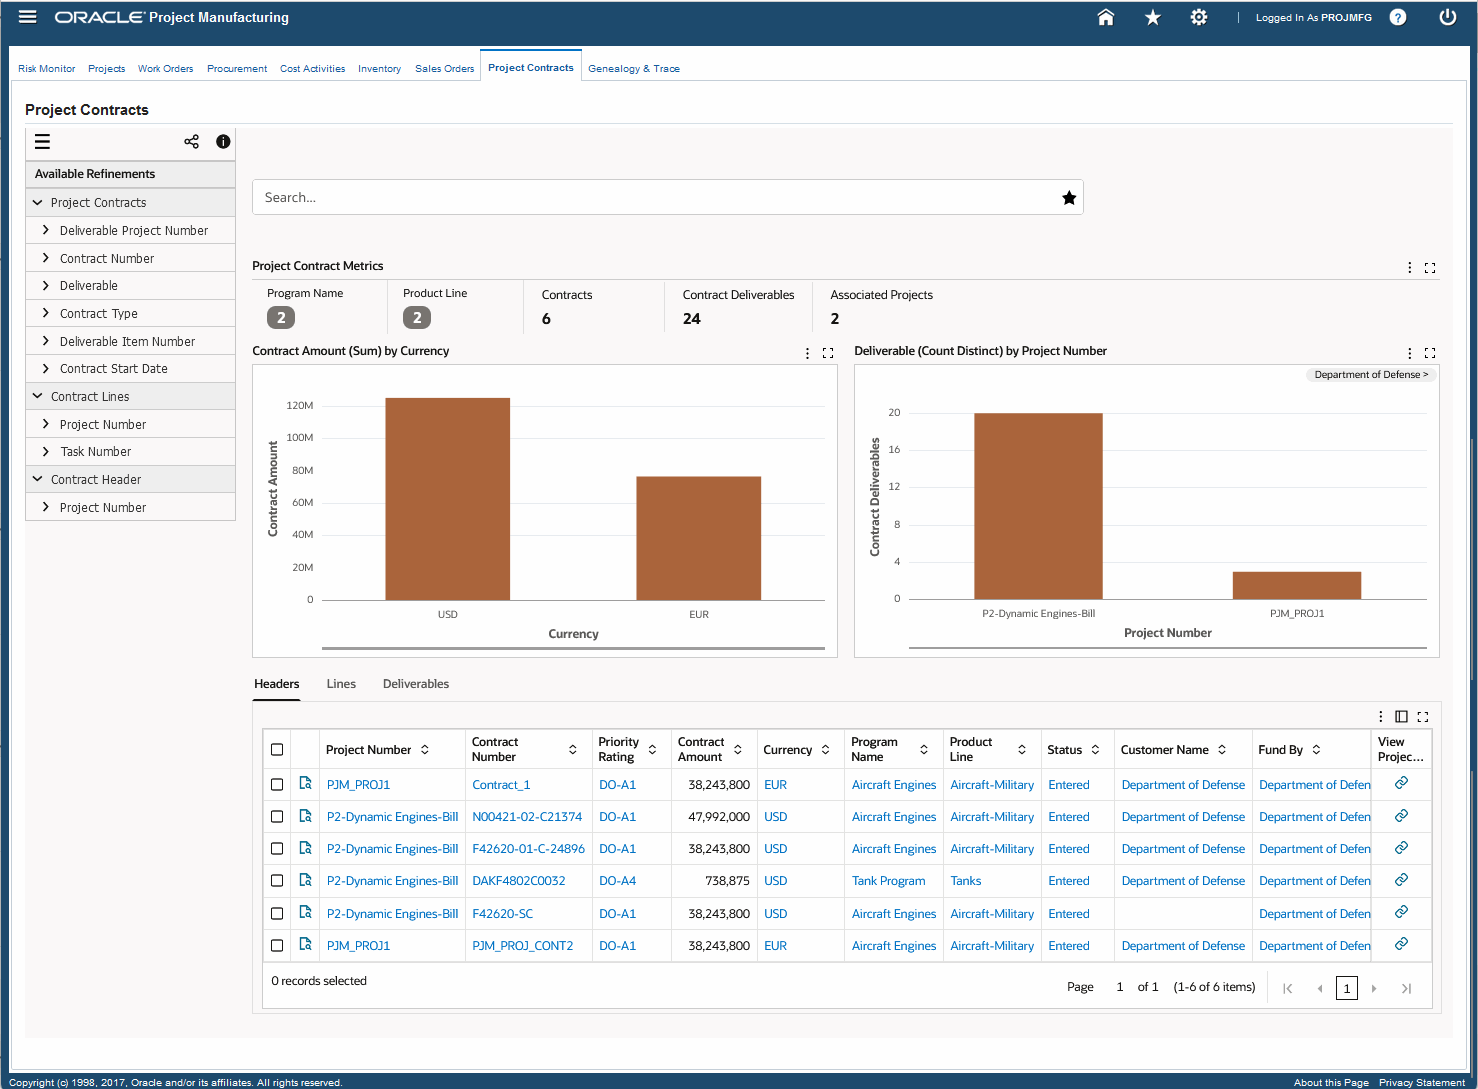
The following table describes the Project Contracts dashboard components:
| Component | Description |
| Project Contract Metrics (summary bar) | The Project Contract Metrics summary bar displays the following key metrics:
|
| Contract Amount (Sum) by Currency(chart) | This chart provides information about project manufacturing contract amounts based on currency. You can refine the displayed data by clicking the data point on the chart and the dimension and metric value for a data point. Click the Options icon to select Project Number or Currency from the Dimension menu. |
| Deliverable (Count Distinct) by Project Number (chart) | This chart provides information about project manufacturing contract deliverables based on customer names. You can refine the displayed data by clicking the data point on the chart and the dimension and metric value for a data point. Click the Options icon to select Customer Name or Project Number from the Dimension menu. |
| Results Tables (tab layout) | The results tables display detailed information about contract headers, lines, and deliverables in the following tabs:
On the Headers tab, click the Record Details icon to view details for a project number. You can also select a project number and click the View Project Contract icon to navigate to the Contract Authoring Workbench window. On the Lines tab, you can select the following entries from the drop-down list to see additional details:
On the Deliverables tab, you can select the following entries from the drop-down list to see additional details:
Click the Timeline View icon in the Deliverables tab to view the following key events for project contracts:
Click Timeline View Option to enable the overview display and the maximum number of events of up to 500. Click the links in the table columns to refine the information in the dashboard. The following actions are available from the Options icon in the tables for the Projects Contracts dashboard:
|
Genealogy and Trace Dashboard
As a project manager you can use the Genealogy & Trace dashboard for detailed traceability into project manufacturing activities. For example, to analyze the causes of any project exceptions, you can search for a purchase order and view the Project Manufacturing Execution Genealogy diagram to trace forward or backward to identify the cause of the exception and review any component shortages, or shipment delays. Similarly, to analyze customer returns due to product issues, you can trace the assembly, serial unit, or component used in production and view the component materials, work order, and shipping details. Some of the network nodes alert you to issues such as schedule exceptions for a work order or if a purchase order is on hold. You can also navigate to the existing project manufacturing dashboards and other application pages from the Genealogy & Trace dashboard. Use this dashboard to:
-
Track and trace project supply chain execution activities.
-
Analyze exceptions caused by project schedule or overdue exceptions.
-
Take corrective action by accessing different application pages from this dashboard.
The Project Manufacturing Execution Genealogy diagram displays the network relationship of the entity that you query. You can use the Search field to find project locators, work orders, work order components, purchase orders, sales orders, and project contracts. You can also select from the available refinements to filter the information. See Project Manufacturing Command Center Overview for more information.
From the Project Manufacturing Super User responsibility, navigate to the Genealogy & Trace dashboard:
(N) Projects >Project Manufacturing Command Center > Genealogy & Trace (tab)
Note: You can also navigate to the Genealogy & Trace dashboard from the existing Overview, Work Order, Purchase Order, and Sales Orders dashboards in the Project Manufacturing Command Center using the link icon in the Network column on the results tables.
Genealogy and Trace Dashboard
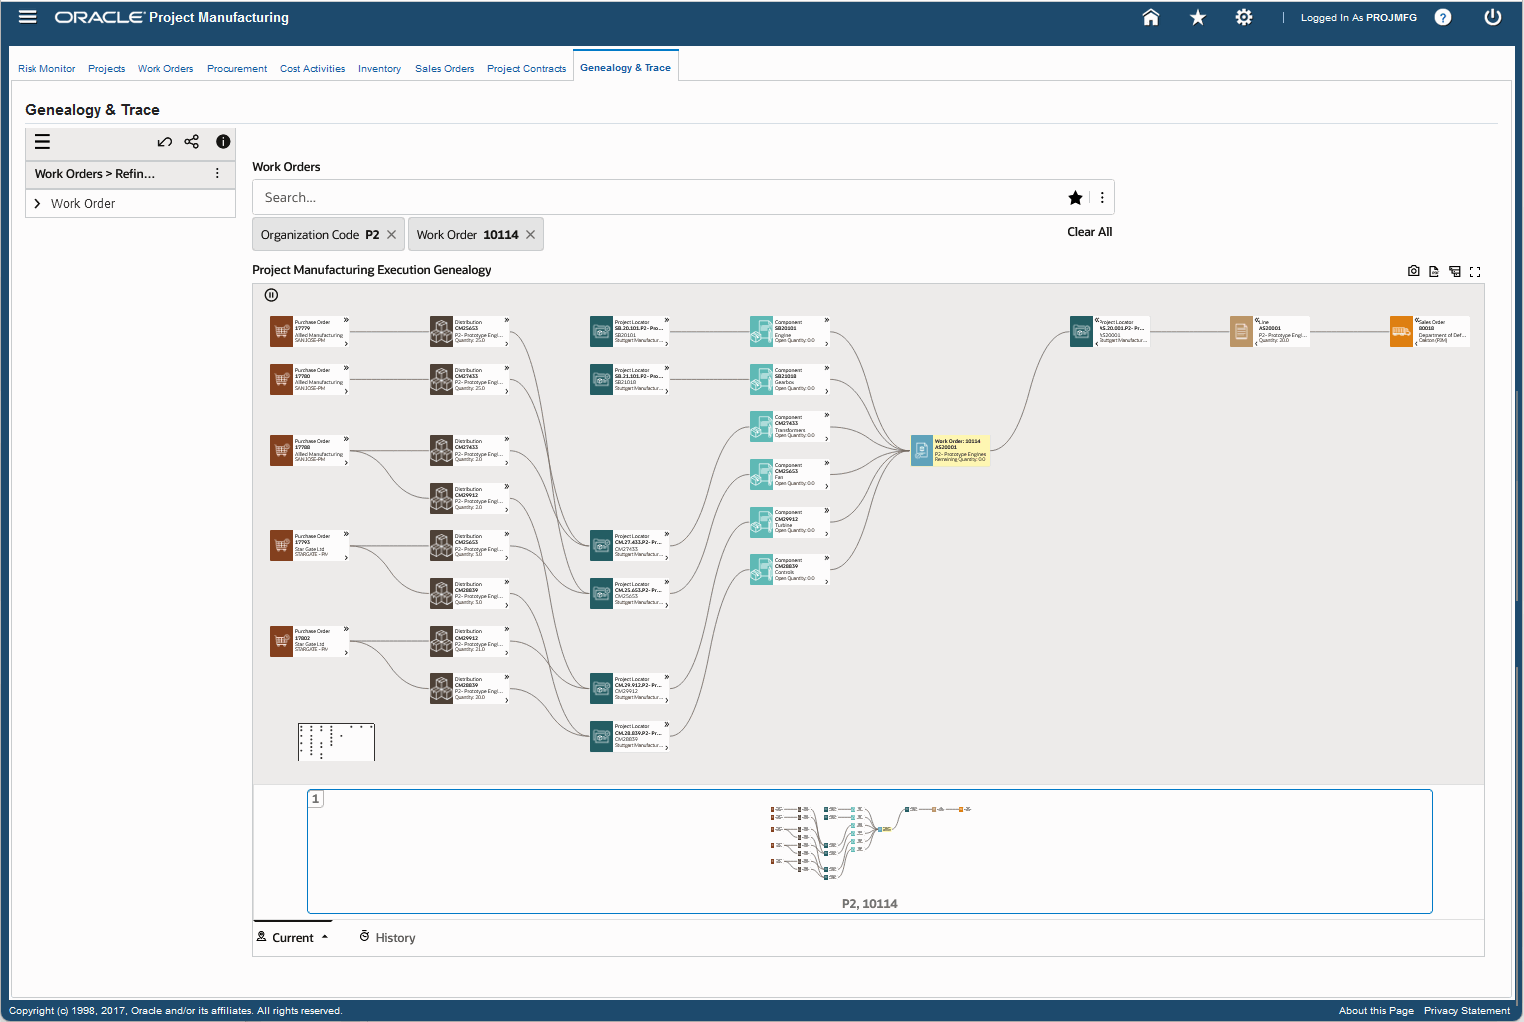
The following table describes the Genealogy & Trace dashboard components:
| Component | Description |
| Project Manufacturing Execution Genealogy (diagram) | This diagram displays the network details for the node you query or the refinements that you select. Right-click a node to view available Actions and to select from the following options:
Based on your search and selected refinements, the network diagram displays the following nodes:
Click the View Timeline link from the Purchase Order, Distribution, Work Order, Sales Order, Line, Project Contract, and Deliverable nodes to view the following key events in the Timeline View:
Click Timeline View Option to enable the overview display and the maximum number of events of up to 500. The following icons are available for the Project Manufacturing Execution Genealogy diagram:
|