6/30
Oracle Quality Command Center
This chapter provides information about Oracle Quality Command Center dashboards.
This chapter covers the following topics:
Oracle Quality Command Center
Quality Command Center Overview
You can use the Oracle Quality Command Center for complete visibility and control over the quality processes. As a quality inspector, a quality analyst, or a quality manager, you can use Quality Command Center dashboards to view and manage quality collection plan results to improve manufacturing efficiency, enforce quality standards and compliance, and reduce cost and business risk. You can review and analyze data using Key Performance Indicators (KPIs), performance evaluation metrics, charts, graphs, tables, and network diagrams. Based on your role, you can use the Quality Command Center to:
-
Identify and resolve quality non-conformances.
-
Analyze root causes to increase yield.
-
Monitor and manage supply quality problems.
-
Monitor and control deviations to prevent costly recalls.
-
Analyze quality cost insights.
-
Identify under-performing products and take corrective actions.
-
Track and trace the execution process of nonconformances and corrective actions using network diagrams.
Before you load data from Oracle E-Business Suite into the Quality Command Center, ensure that your EBS data is accurate and current.
In Oracle Quality, the following Quality Command Center dashboards enable search functions using Enterprise Command Center integration:
-
Collection Results dashboard - Use this dashboard to quickly search for, view and update quality collection plans and collection elements across quality plan hierarchies.
-
Nonconformances dashboard - Use this dashboard to identify and manage quality nonconformances to prevent costs on recalls, returns and so on, as well as to analyze root causes to increase yield.
-
Corrective Actions dashboard - Use this dashboard to track and monitor corrective actions logged for quality nonconformances.
-
Track & Trace dashboard - Use this dashboard to track and trace the complete genealogy of nonconformances using the Network View diagram, which displays the network relationship for suppliers, work orders, purchase orders, nonconforming defects, corrective action headers, dispositions, and other related entities.
Note: You can use the Quality Command Center only after the installation and common configurations are completed as described in My Oracle Support Knowledge Document 2495053.1, Installing Oracle Enterprise Command Center Framework, Release 12.2. For additional ECC Overview information, see Overview of Oracle Enterprise Command Center Framework, Oracle E-Business Suite User's Guide.
Searching Enterprise Command Center Dashboards
Use the dashboard sidebars to refine (filter) the data on each dashboard. You can select a value or record from the Available Refinements component, or use Search to find a keyword, a value, or a specific record. The type-ahead feature suggests matches for your entry that correspond to the available refinements. When you submit a search, the search term is added to the Selected Refinements list, and the dashboard data is refined to include only records that match the search. You can add multiple refinements and remove any of them at any time. Use Saved Search to create and save your search. You can edit, delete, or refer to this saved search.
Use an asterisk (*) or percent sign (%) to perform a partial keyword or record search that matches any string of zero or more characters. You can also use a question mark (?) to perform a partial search that matches any single character.
Additional Information: For more information about searching for and refining data in enterprise command centers, see Search in Highlights of an Enterprise Command Center, Oracle E-Business Suite User's Guide.
Collection Results Dashboard
The Collections Results dashboard enables quality inspectors, quality analysts, and quality managers to manage quality data collection and inspection results. Use the Collection Results dashboard to:
-
Update quality collections and inspection results.
-
Analyze quality results from transaction sources such as production, receiving, asset maintenance, service inspections and so on.
-
Monitor and report nonconformances for any quality deviation for products and processes.
The Collection Results dashboard provides the following tabs to enable you to view transaction-focused quality collection information:
Each tab shows transaction group specific metrics, charts, and results information. You can also use the transaction related attributes in the Available Refinements in each tab to search for and filter the data.
Using refinements, you can search on organization details, collection plan details, and quality results details and view specific quality collection results metrics, charts, and transaction results tables. See the Quality Command Center Overview for more information.
Discrete Manufacturing Tab
From the Quality responsibility, navigate to the Collection Results dashboard's Discrete Manufacturing tab:
(N) Quality > Workbench > Quality Command Center > Collection Results (tab) > Discrete Manufacturing (tab)
Discrete Manufacturing Tab
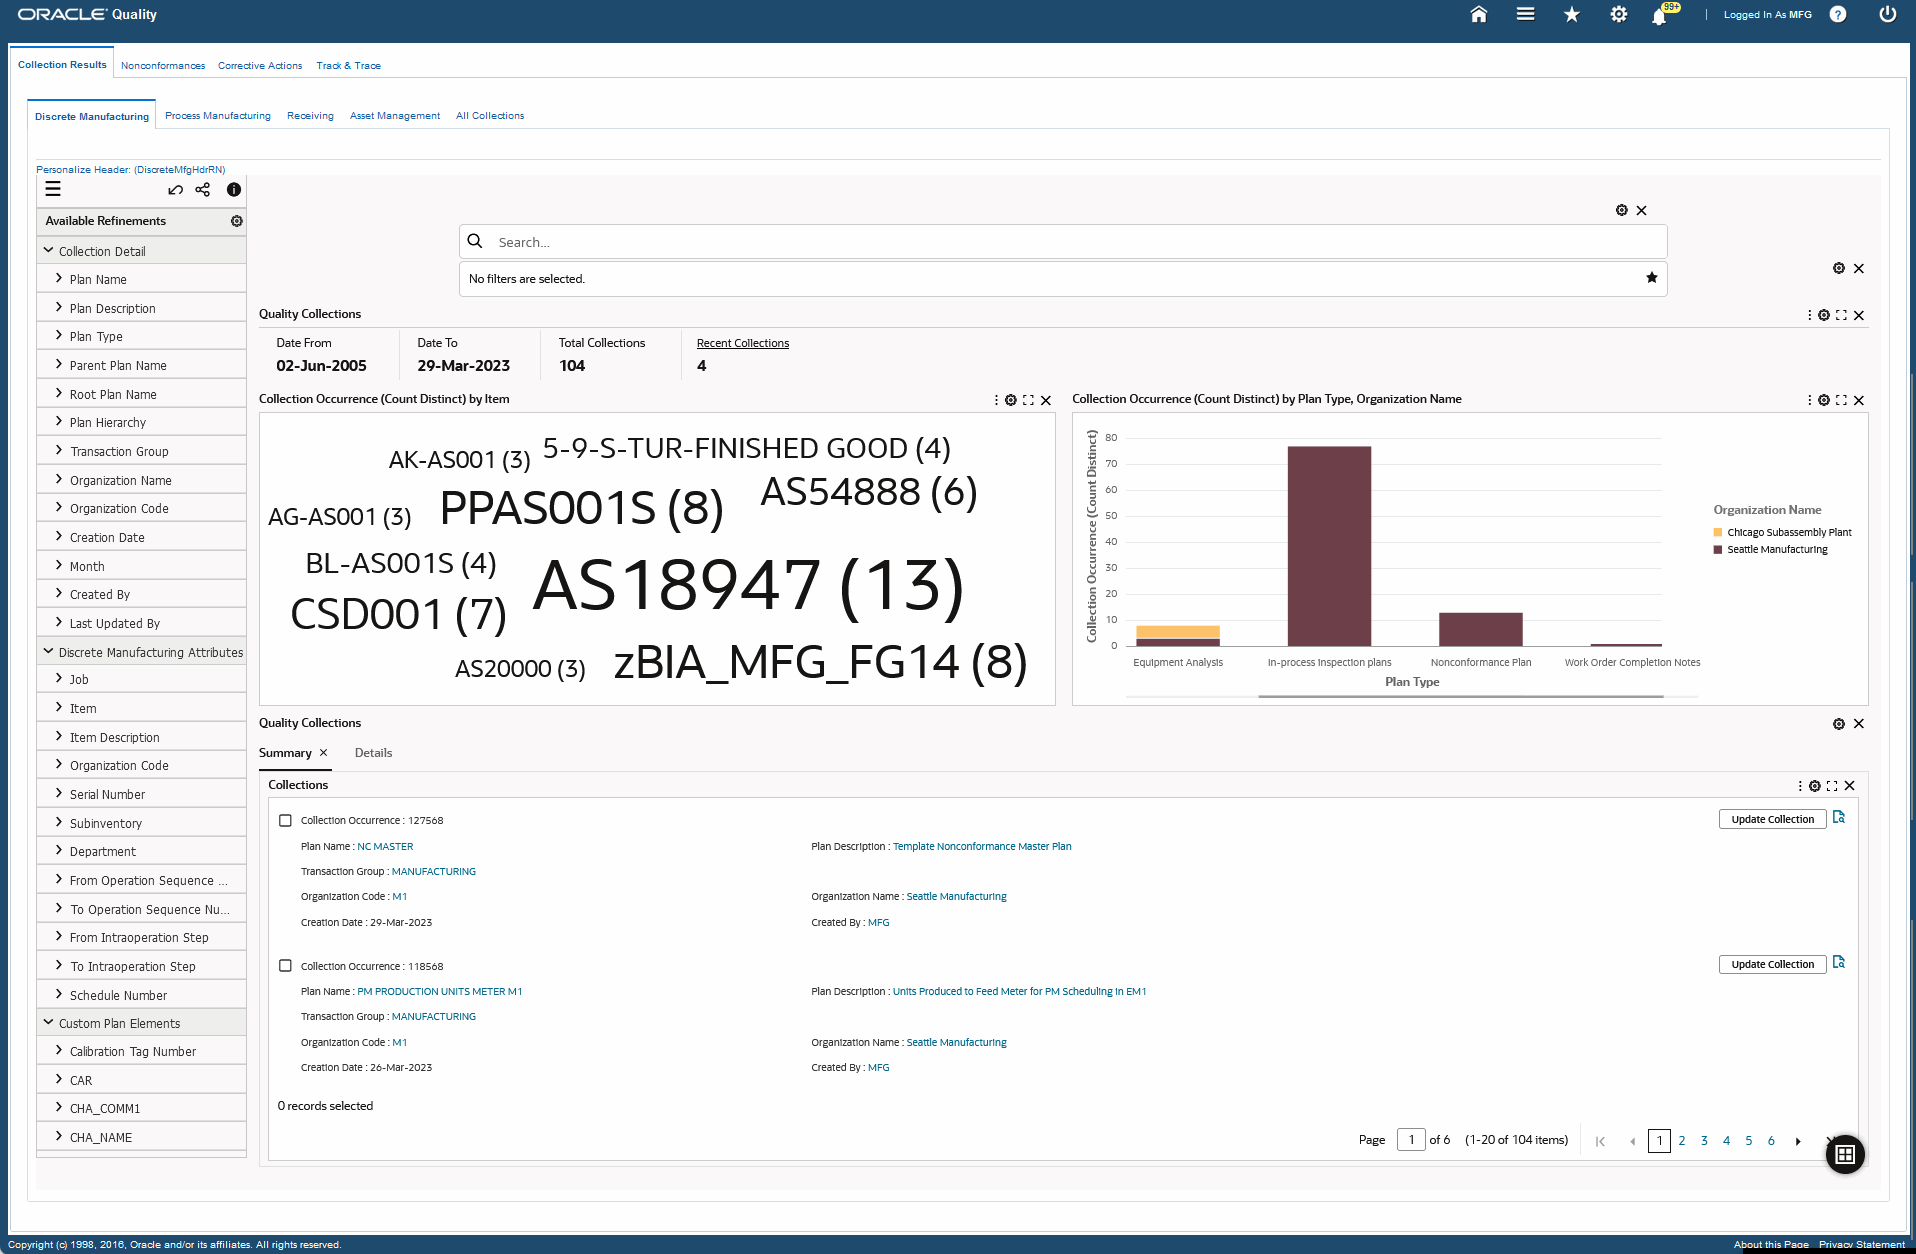
The following table describes the Collection Results dashboard's Discrete Manufacturing tab components:
| Component |
Description |
| Quality Collections (summary bar) |
The Quality Collections summary bar displays the following key metrics for discrete manufacturing :
-
Date From
This metric displays the starting date for the discrete manufacturing quality collection information that is included in the dashboard view. This date changes depending on the information you filter in the dashboard.
-
Date To
This metric displays the end date for the discrete manufacturing quality collection information that is included in the dashboard view. This date changes depending on the information you filter in the dashboard.
-
Total Collection
This metric displays the total number of quality collection plans for discrete manufacturing.
-
Recent Collections
This metric displays the recent number of quality collection plans for discrete manufacturing.
Click a metric to refine the information in the dashboard. |
| Collection Occurrence (Count Distinct) by Item (tag cloud) |
This tag cloud displays the top ten quality collection plans for discrete manufacturing organizations based on items. Click the Options icon to select Item, Organization Name, Transaction Group, or Department from the Dimension menu.
You can also click an entity in the tag cloud to filter the data in the dashboard. |
| Collection Occurrence (Count Distinct) by Plan Type, Organization Name (chart) |
This chart displays quality collection plans for discrete manufacturing organizations according to plan type and organization name. Click the Options icon to select Organization Name, Item, Department, Transaction Type, Inspection Result, or Component Item from the Dimension menu. Select Plan Type, Department, Item, or Month from the Group Dimensions menu.
You can refine the information that is displayed in the dashboard by clicking a data point on the charts and the dimension and metric value for a data point. |
| Results Tables (tab layout) |
The results tables for the Discrete Manufacturing tab display information about discrete manufacturing quality collection information under the following tabs:
-
Summary
Use this tab to view information about collection occurrence, plan name, plan description, transaction group, organization code, organization name, creation date, and who it was created by.
Use the Update Collection button to update the information for a collection plan in the Quality Workbench.
-
Details
Use this tab to select and view collection results information based on the following options available from the drop-down list:
When you select Discrete Manufacturing Attributes, you can click the View Production Quality link in the Details tab to navigate to the Production Quality dashboard of Discrete Manufacturing Command Center.
Note: When you click the View Production Quality link for an item to navigate to the Production Quality dashboard, the dashboard retains the filters, and shows the same filtered data for the item and job (if information is available for the job).
Click the links in the table columns to refine the information available in the dashboard.
The following actions are available from the Options icon in the tables for the Collection Results dashboard:
|
Process Manufacturing Tab
From the Quality responsibility, navigate to the Collection Results dashboard's Process Manufacturing tab:
(N) Quality > Workbench > Quality Command Center > Collection Results (tab) > Process Manufacturing (tab)
Process Manufacturing Tab
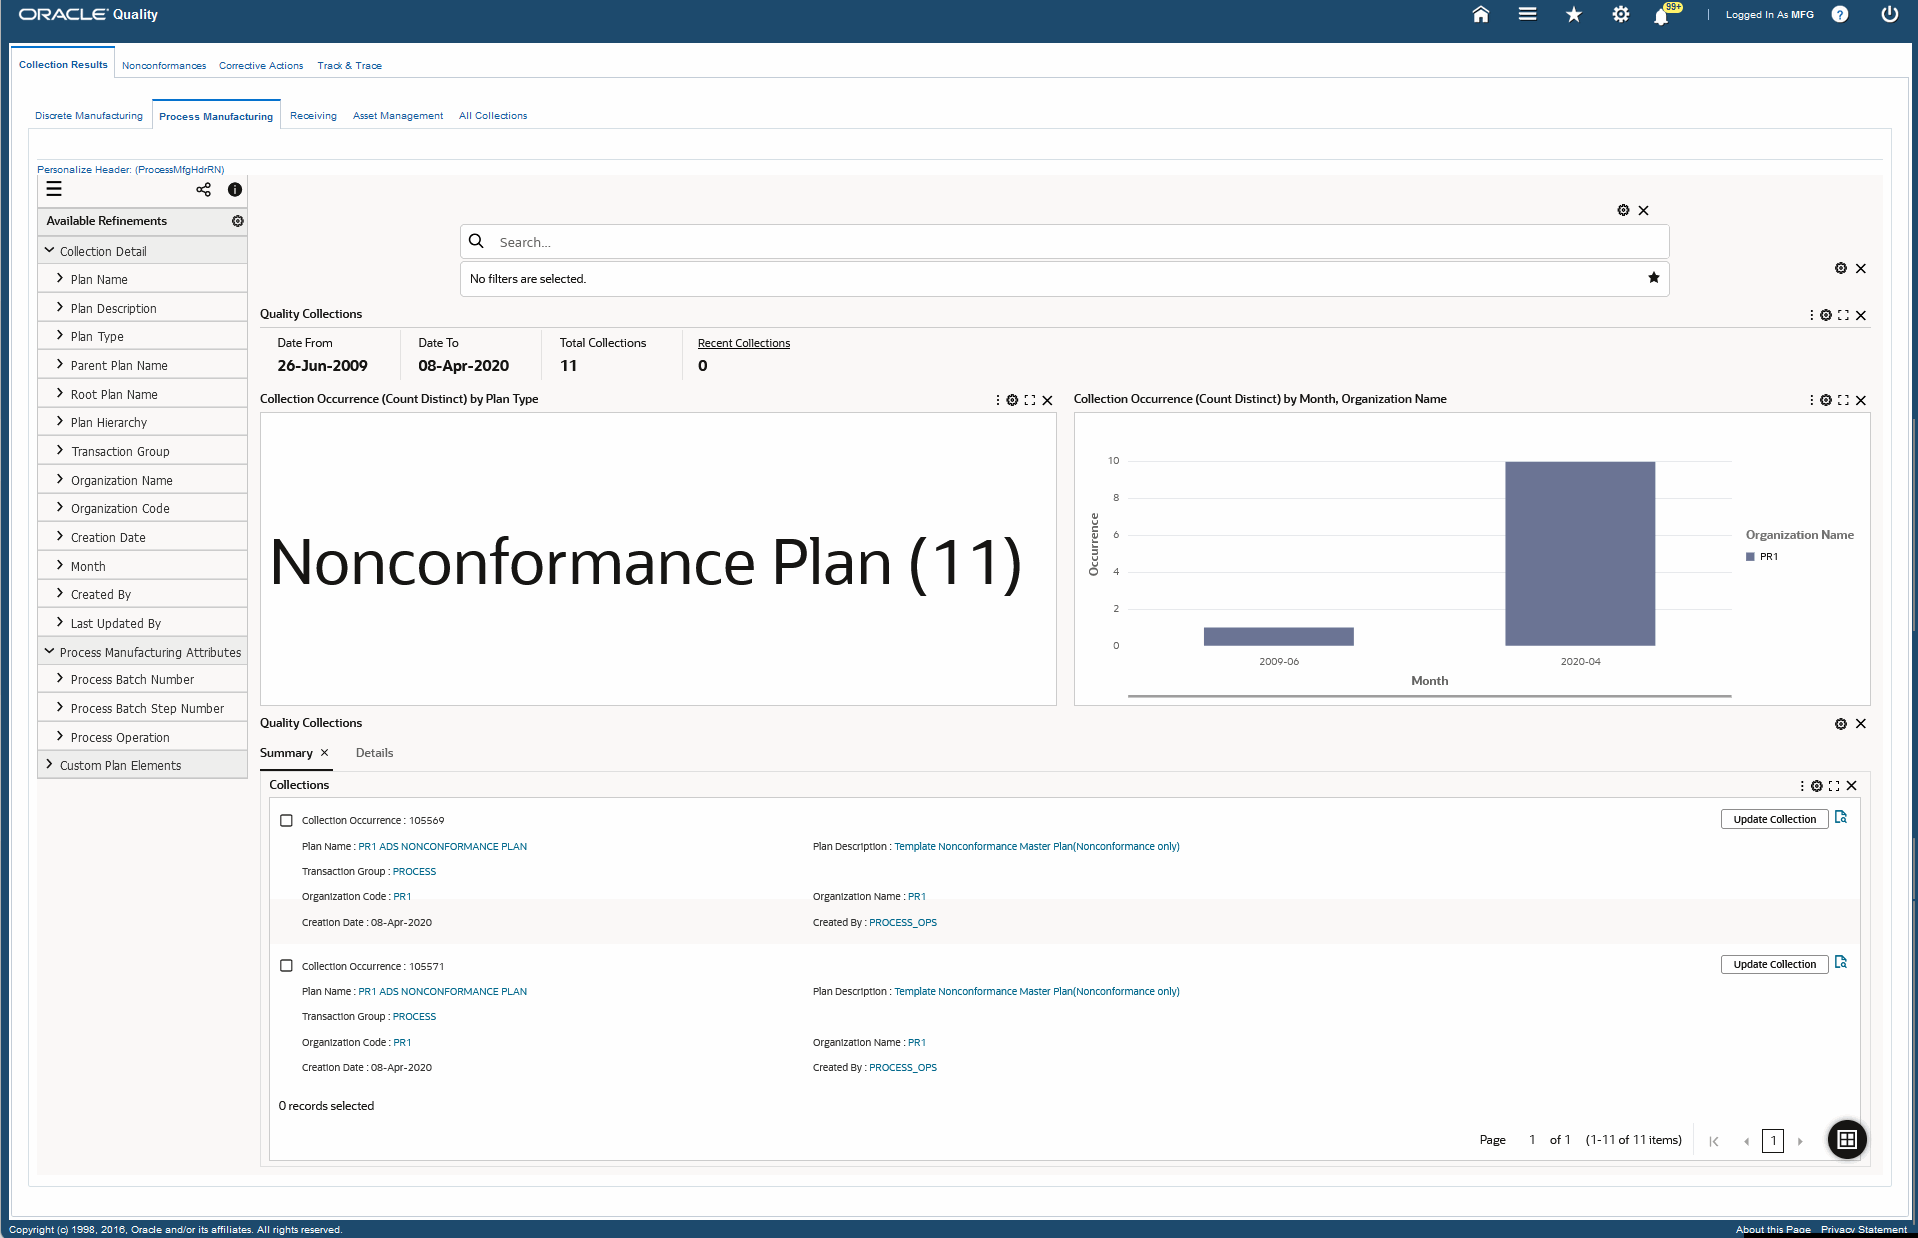
The following table describes the Collection Results dashboard's Process Manufacturing tab components:
| Component |
Description |
| Quality Collections (summary bar) |
The Quality Collections summary bar displays the following key metrics for process manufacturing:
-
Date From
This metric displays the starting date for the process manufacturing quality collection information that is included in the dashboard view. This date changes depending on the information you filter in the dashboard.
-
Date To
This metric displays the end date for the process manufacturing quality collection information that is included in the dashboard view. This date changes depending on the information you filter in the dashboard.
-
Total Collection
This metric displays the total number of quality collection plans for process manufacturing.
-
Recent Collections
This metric displays the recent number of quality collection plans for process manufacturing.
Click a metric to refine the information in the dashboard. |
| Collection Occurrence (Count Distinct) by Plan Type (tag cloud) |
This tag cloud displays the top ten quality collection plans for process manufacturing organizations according to plan type. Click the Options icon to select Plan Type, Organization Name, or Item from the Dimension menu.
You can also click an entity in the tag cloud to filter the data in the dashboard. |
| Collection Occurrence (Count Distinct) by Month, Organization Name (chart) |
This chart displays the quality collection plans for process manufacturing organizations according to month and organization name. Click the Options icon to select Organization Name from the Dimension menu and Month, Plan Type, or Process Batch Number from the Group Dimensions menu.
You can refine the information that is displayed in the dashboard by clicking a data point on the charts and the dimension and metric value for a data point. |
| Results Tables (tab layout) |
The results tables for the Process Manufacturing tab display information about process manufacturing quality collection information under the following tabs:
-
Summary
Use this tab to view information about collection occurrence, plan name, plan description, transaction group, organization code, organization name, creation date, and who it was created by.
Use the Update Collection button to update the information for a collection plan in the Quality Workbench.
-
Details
Use this tab to select and view collection results information based on the following options available from the drop-down list:
-
Click the links in the table columns to refine the information available in the dashboard.
The following actions are available from the Options icon in the tables for the Collection Results dashboard:
|
Receiving Tab
From the Quality responsibility, navigate to the Collection Results dashboard's Receiving tab:
(N) Quality > Workbench > Quality Command Center > Collection Results (tab) > Receiving (tab)
Receiving Tab
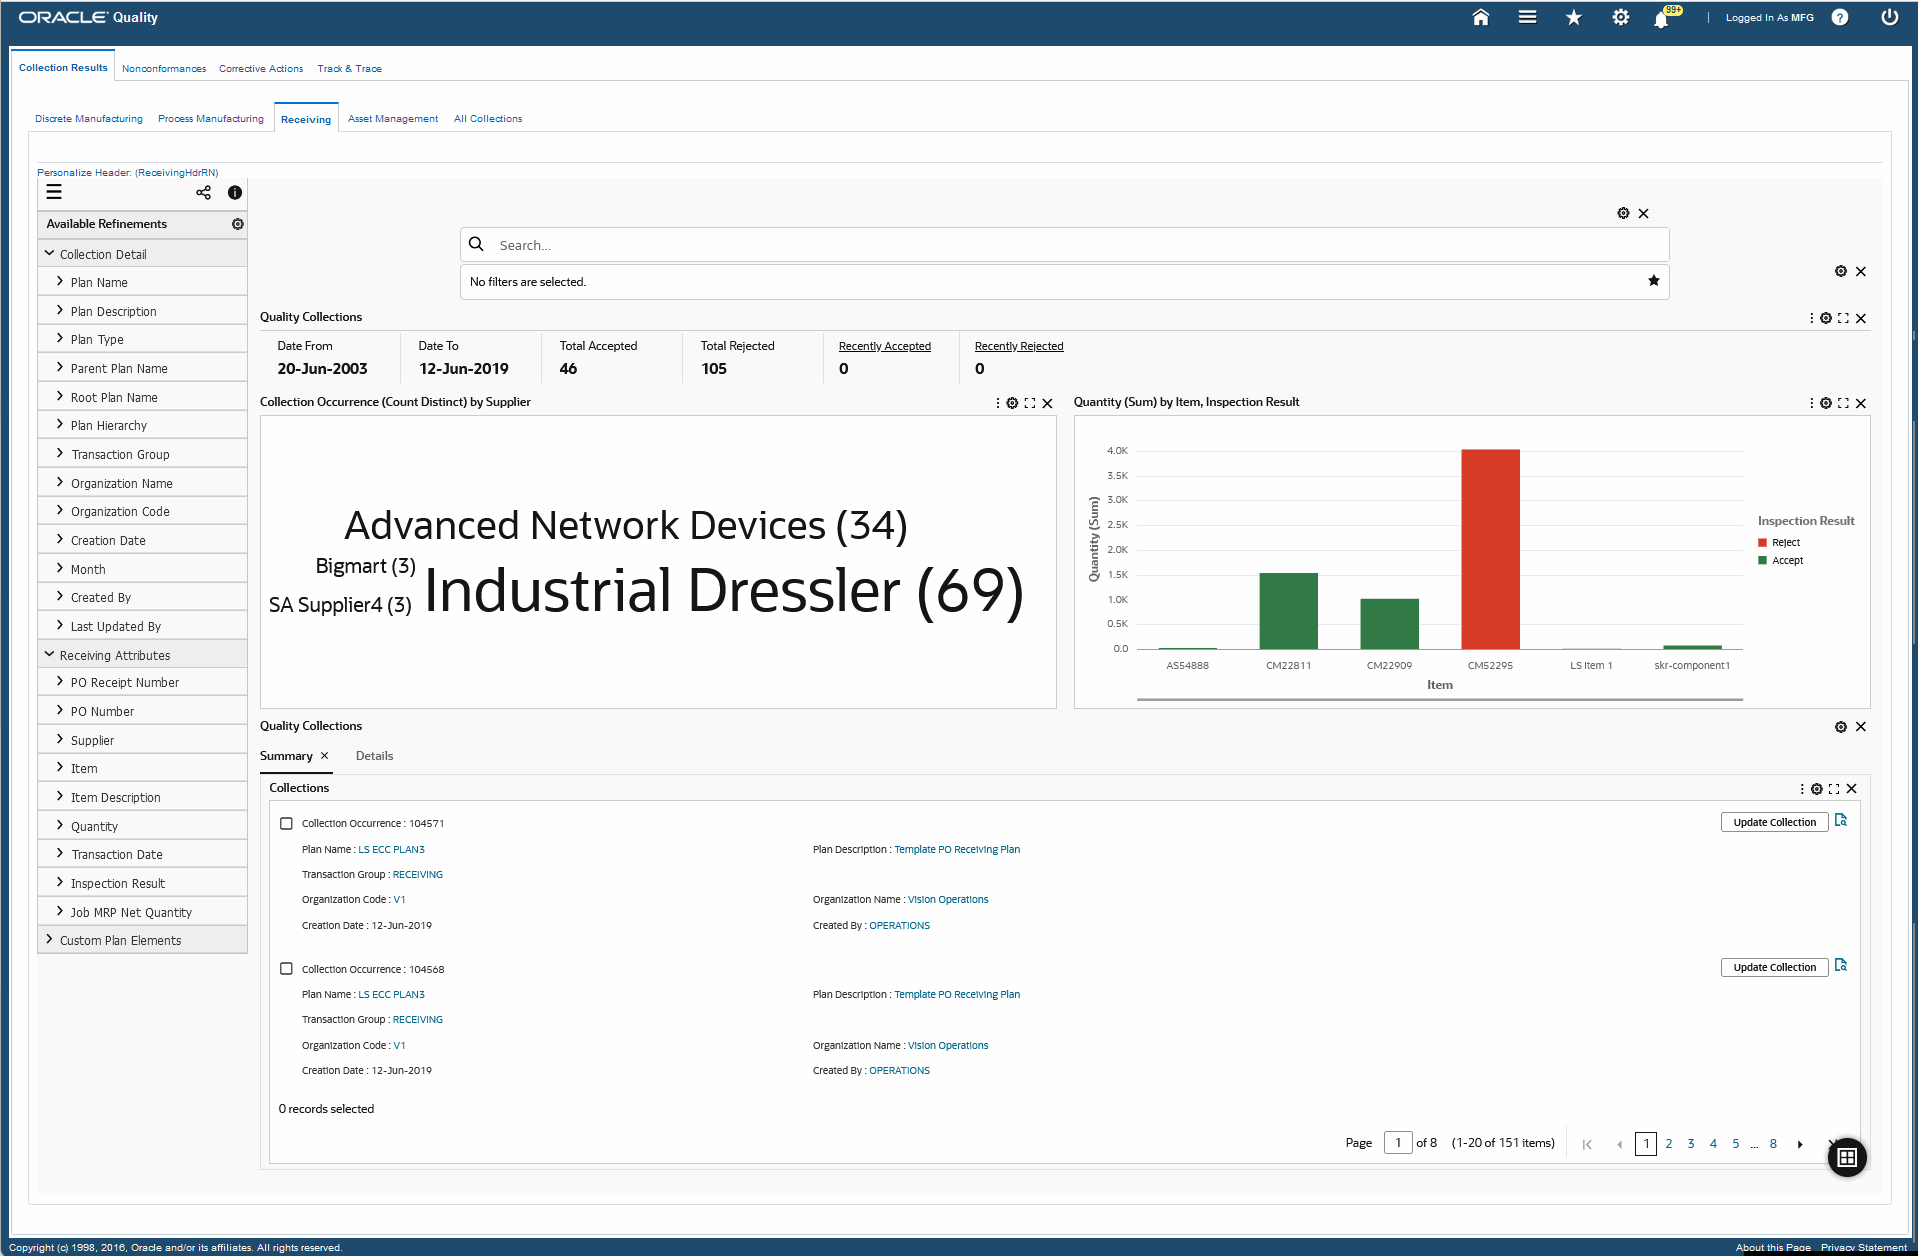
The following table describes the Collection Results dashboard's Receiving tab components:
| Component |
Description |
| Quality Collections (summary bar) |
The Quality Collections summary bar displays the following key metrics:
-
Date From
This metric displays the starting date for the receiving quality collection information that is included in the dashboard view. This date changes depending on the information you filter in the dashboard.
-
Date To
This metric displays the end date for the receiving quality collection information that is included in the dashboard view. This date changes depending on the information you filter in the dashboard.
-
Total Accepted
This metric displays the total number of quality collection plans for receiving transactions that have been accepted.
-
Total Rejected
This metric displays the total number of quality collection plans for receiving transactions that have been rejected.
-
Recently Accepted
This metric displays the total number of recently accepted quality collection plans for receiving transactions.
-
Recently Rejected
This metric displays the total number of recently rejected quality collection plans for receiving transactions.
Click a metric to refine the information in the dashboard. |
| Collection Occurrence (Count Distinct) by Supplier (tag cloud) |
This tag cloud displays the top ten quality collection plans for receiving transactions on the basis of suppliers. Click the Options icon to select Supplier, Buyer, Inspection Result, or Item from the Dimension menu. menu.
You can click an entity in the tag cloud to filter the data in the dashboard. |
| Quantity (Sum) by Item, Inspection Result (chart) |
This chart displays quality collection plans for receiving transactions according to item and inspection result. Click the Options icon to select Inspection Result, Supplier, Owner, or Organization Name from the Dimension menu. Select Item, Supplier, PO Receipt Number, Month, and Plan Type from the Group Dimensions menu.
You can refine the information that is displayed in the dashboard by clicking a data point on the charts and the dimension and metric value for a data point. |
| Results Tables (tab layout) |
The results tables for the Receiving tab display information about receiving quality collection information under the following tabs:
-
Summary
Use this tab to view information about collection occurrence, plan name, plan description, transaction group, organization code, organization name, creation date, and who it was created by.
Use the Update Collection button to update the information for a collection plan in the Quality Workbench.
-
Details
Use this tab to select and view collection results information based on the following options available from the drop-down list:
-
Collection Detail
-
Receiving Attributes
-
Custom Plan Elements
Click the links in the table columns to refine the information available in the dashboard.
The following actions are available from the Options icon in the tables for the Collection Results dashboard:
|
Asset Management Tab
From the Quality responsibility, navigate to the Collection Results dashboard's Asset Management tab:
(N) Quality > Workbench > Quality Command Center > Collection Results (tab) > Asset Management (tab)
Asset Management Tab
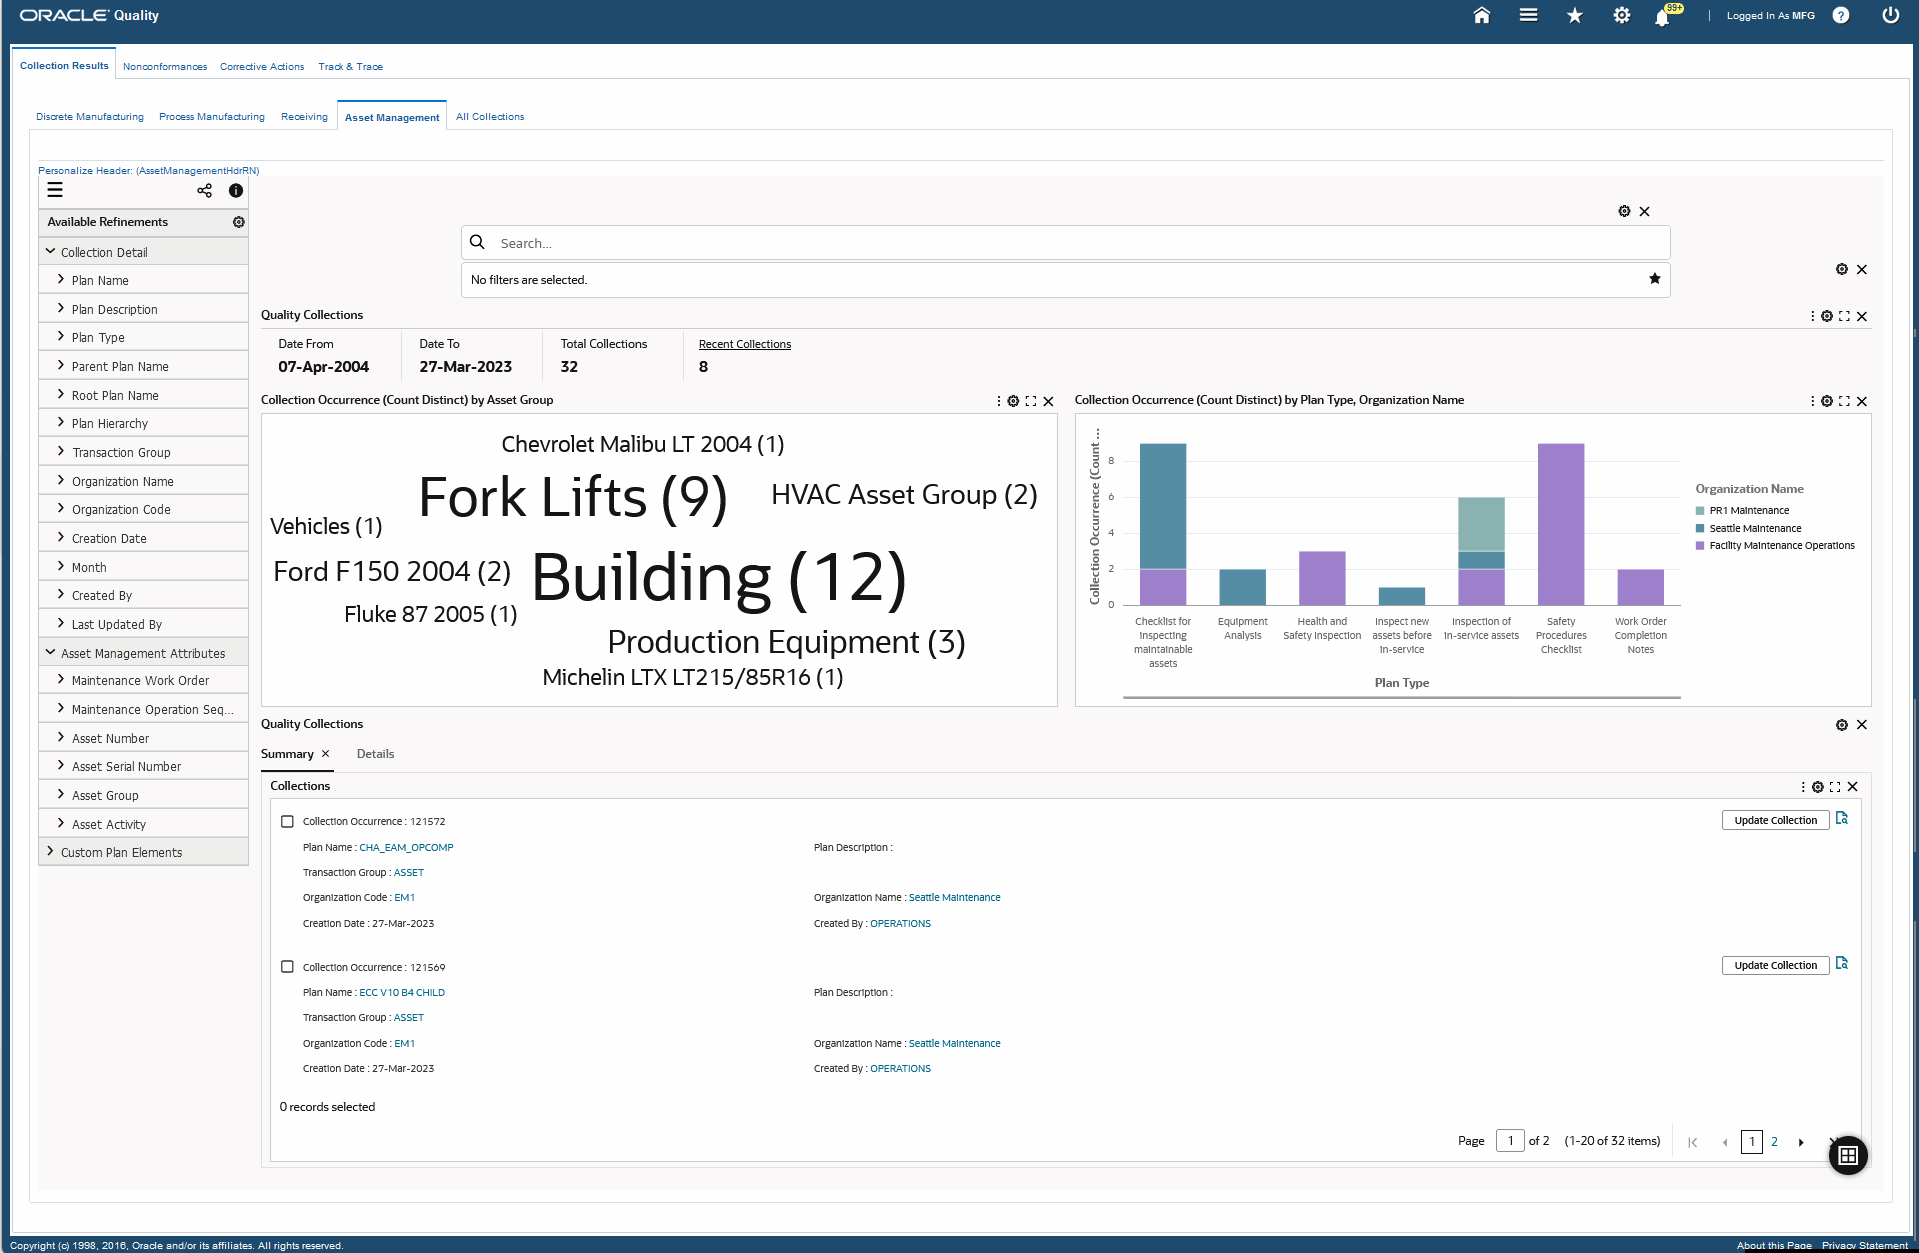
The following table describes the Collection Results dashboard's Asset Management tab components:
| Component |
Description |
| Quality Collections (summary bar) |
The Quality Collections summary bar displays the following key metrics for asset management quality collections:
-
Date From
This metric displays the starting date for the asset management quality collection information that is included in the dashboard view. This date changes depending on the information you filter in the dashboard.
-
Date To
This metric displays the end date for the asset management quality collection information that is included in the dashboard view. This date changes depending on the information you filter in the dashboard.
-
Total Collections
This metric displays the total number of quality collection plans for asset management.
-
Recent Collections
This metric displays the recent number of quality collection plans for asset management
Click a metric to refine the information in the dashboard. |
| Collection Occurrence (Count Distinct) by Asset Group (tag cloud) |
This tag cloud displays the top ten quality collection plans for asset management organizations on the basis of asset groups. Click the Options icon to select Asset Group, Asset Activity, or Item from the Dimension menu.
You can click an entity in the tag cloud to filter the data in the dashboard. |
| Collection Occurrence (Count Distinct) by Plan Type, Organization Name (chart) |
This chart displays quality collection plans for asset management organizations according to plan type and organization name. Click the Options icon to select Organization Name, Asset Serial Number, Asset Number, or Asset Activity from the Dimension menu. Select Plan Type, Asset Group, or Month from the Group Dimensions menu.
You can refine the information that is displayed in the dashboard by clicking a data point on the charts and the dimension and metric value for a data point. |
| Results Tables (tab layout) |
The results tables for the Asset Management tab display information about asset management quality collection information under the following tabs:
-
Summary
Use this tab to view information about collection occurrence, plan name, plan description, transaction group, organization code, organization name, creation date, and who it was created by.
Use the Update Collection button to update the information for a collection plan in the Quality Workbench.
-
Details
Use this tab to select and view collection results information based on the following options available from the drop-down list:
-
Collection Detail.
-
Discrete Manufacturing Attributes,
-
Process Manufacturing Attributes.
-
Asset Management. Attributes
-
Receiving Attributes.
-
Collection Identifiers.
Click the links in the table columns to refine the information available in the dashboard.
The following actions are available from the Options icon in the tables for the Collection Results dashboard:
|
All Collections Tab
From the Quality responsibility, navigate to the Collection Results dashboard's All Collections tab:
(N) Quality > Workbench > Quality Command Center > Collection Results (tab) > All Collections (tab)
All Collections Tab
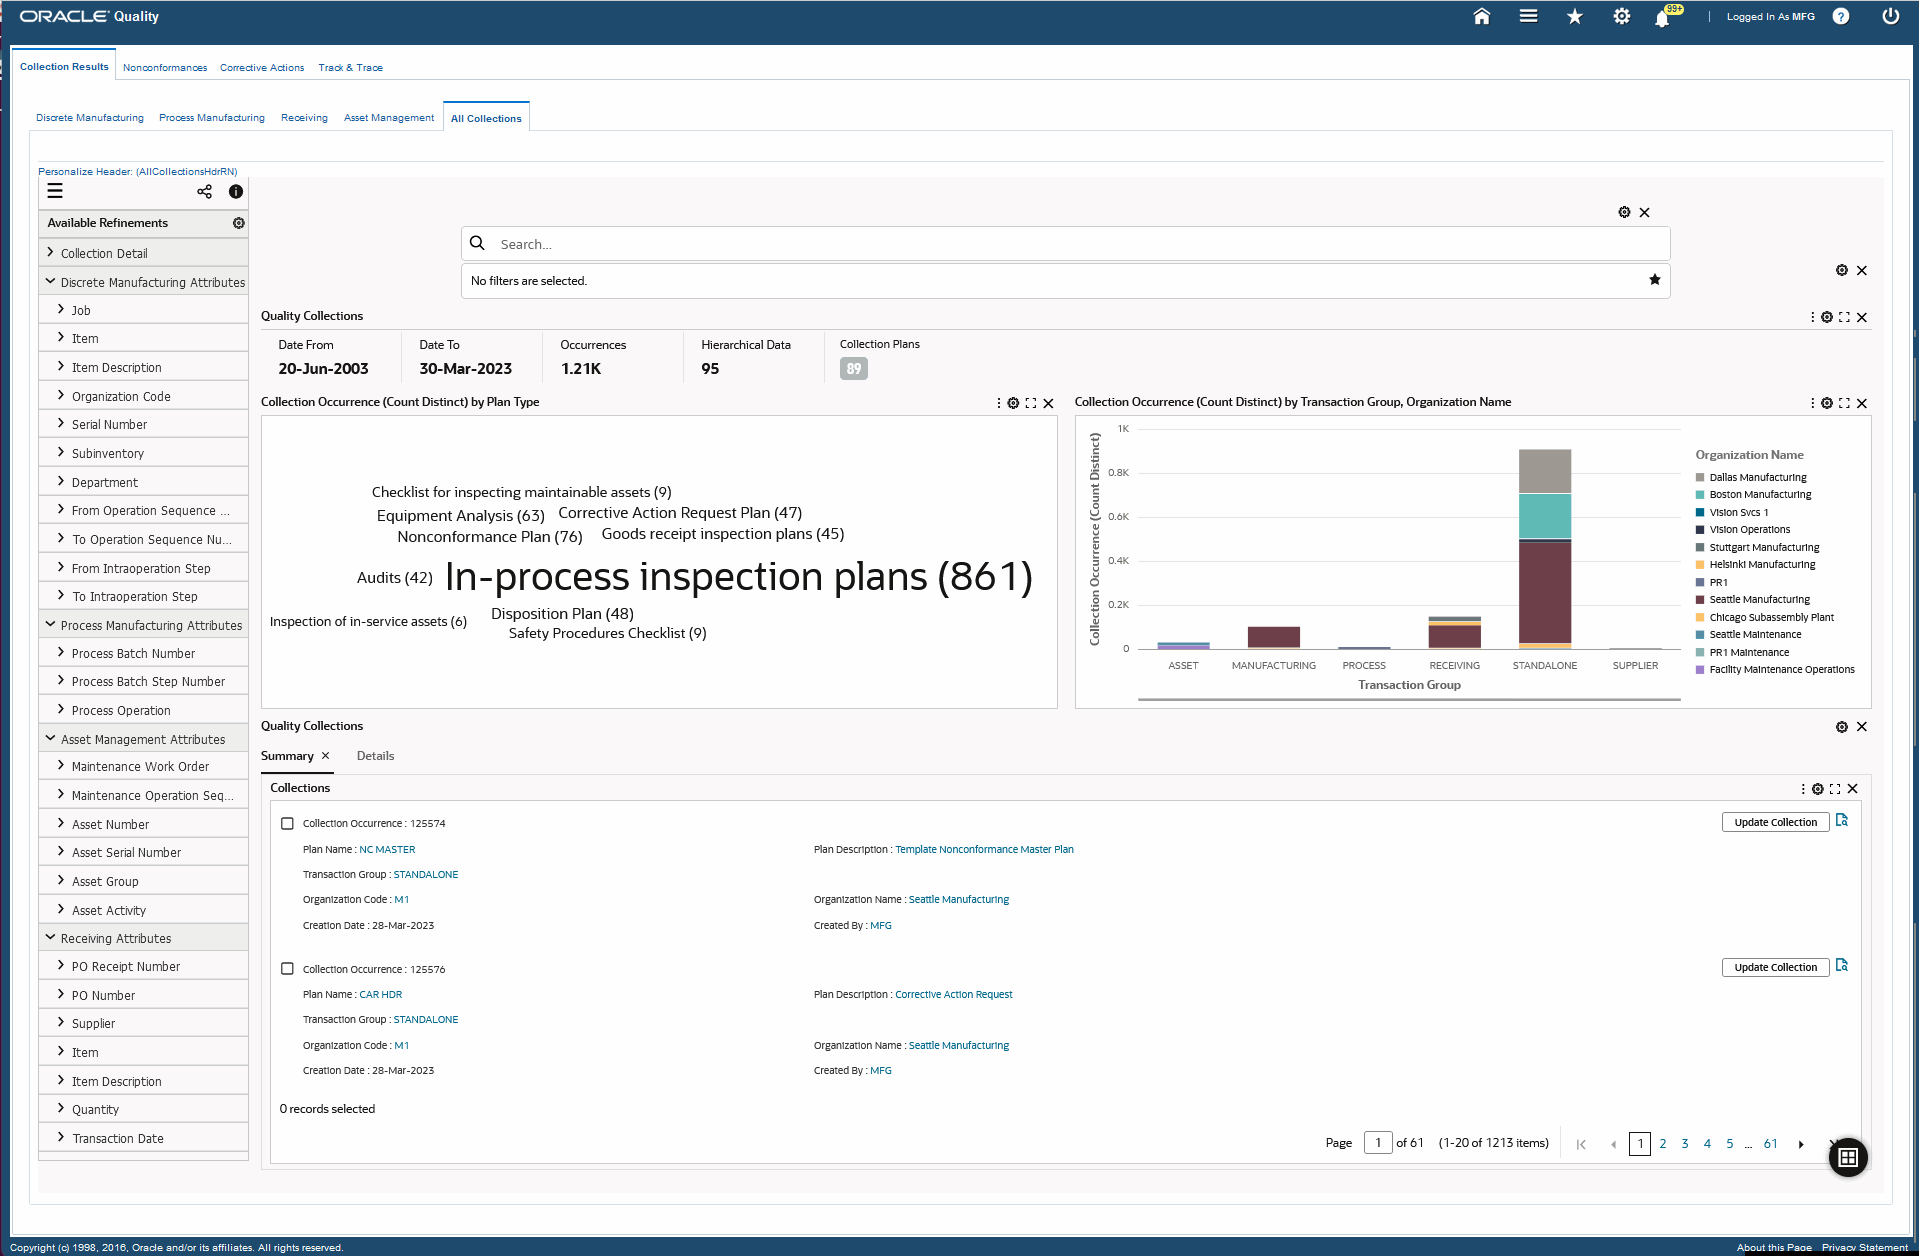
The following table describes the Collection Results dashboard's All Collections tab components:
| Component |
Description |
| Quality Collections (summary bar) |
The Quality Collections summary bar displays the following key metrics for all quality collections across all transaction groups:
-
Date From
This metric displays the starting date for all the quality collection information that is included in the dashboard view. This date changes depending on the information you filter in the dashboard.
-
Date To
This metric displays the end date for all the quality collection information that is included in the dashboard view. This date changes depending on the information you filter in the dashboard.
-
Occurrences
This metric displays the total number of records for all discrete manufacturing, process manufacturing, receiving, and asset management quality collection information available in the dashboard.
-
Hierarchical Data
This metric displays the number of parent-child quality collection plans for all transaction groups.
-
Collection Plans
This metric displays the number of quality collection plans for all transaction groups. Click this metric to view and select a collection plan from the list of values to view information in the dashboard.
Click any metric to refine the information in the dashboard. |
| Collection Occurrence (Count Distinct) by Plan Type (tag cloud) |
This tag cloud displays the top quality collection plans on the basis of plan type. Click the Options icon to select Plan Type, Month, Item, Department, Transaction Group, Supplier, or Asset Group from the Dimension menu.
You can click an entity in the tag cloud to filter the data in the dashboard. |
| Collection Occurrence (Count Distinct) by Transaction Group, Organization Name (chart) |
This chart displays all quality collection plans according to transaction group and organization name. Click the Options icon to select Organization Name or Inspection Result from the Dimension menu. Select Transaction Group or Month from the Group Dimensions menu.
You can refine the information that is displayed in the dashboard by clicking a data point on the charts and the dimension and metric value for a data point. |
| Results Tables (tab layout) |
The results tables for the All Collections tab display information about quality collection information across transaction groups under the following tabs:
-
Summary
Use this tab to view information about collection occurrence, plan name, plan description, transaction group, organization code, organization name, creation date, and who it was created by.
Use the Update Collection button to update the information for a collection plan in the Quality Workbench.
-
Details
Use this tab to select and view collection results information based on the following options available from the drop-down list:
-
Collection Detail.
-
Discrete Manufacturing Attributes,
-
Process Manufacturing Attributes.
-
Receiving Attributes.
-
Asset Management. Attributes
-
Collection Plan Elements.
When you select Discrete Manufacturing Attributes, you can click the View Production Quality link in the Details tab to navigate to the Production Quality dashboard of Discrete Manufacturing Command Center.
Note: When you click the View Production Quality link for an item to navigate to the Production Quality dashboard, the dashboard retains the filters, and shows the same filtered data for the item and job (if information is available for the job).
Click the links in the table columns to refine the information available in the dashboard.
The following actions are available from the Options icon in the tables for the Collection Results dashboard:
|
See:
Nonconformances Dashboard
The Nonconformances dashboard enables quality analysts and quality managers to manage quality nonconformances and dispositions of defects in products and processes. Use the Nonconformances dashboard to:
-
Prioritize reported nonconformances based on the type and severity of each issue.
-
Manage appropriate disposition of each nonconformance occurrence.
-
Analyze costs and trends associated with quality nonconformance defects.
-
Create corrective actions to prevent future nonconformances.
-
Navigate from the results tables to track and trace nonconformances in the Track & Trace dashboard.
The Nonconformances dashboard provides the following tabs to enable you to view transaction-focused quality collection information:
Each tab shows transaction group specific metrics, charts, and results information. You can also use the transaction related attributes in the Available Refinements in each tab to search for and filter the data.
Using refinements, you can search for specific information and analyze nonconformance metrics, charts, and results tables. See the Quality Command Center Overview for more information.
Discrete Manufacturing Tab
From the Quality responsibility, navigate to the Nonconformances dashboard's Discrete Manufacturing tab:
(N) Quality > Workbench > Quality Command Center > Nonconformances (tab) > Discrete Manufacturing tab
Discrete Manufacturing Tab
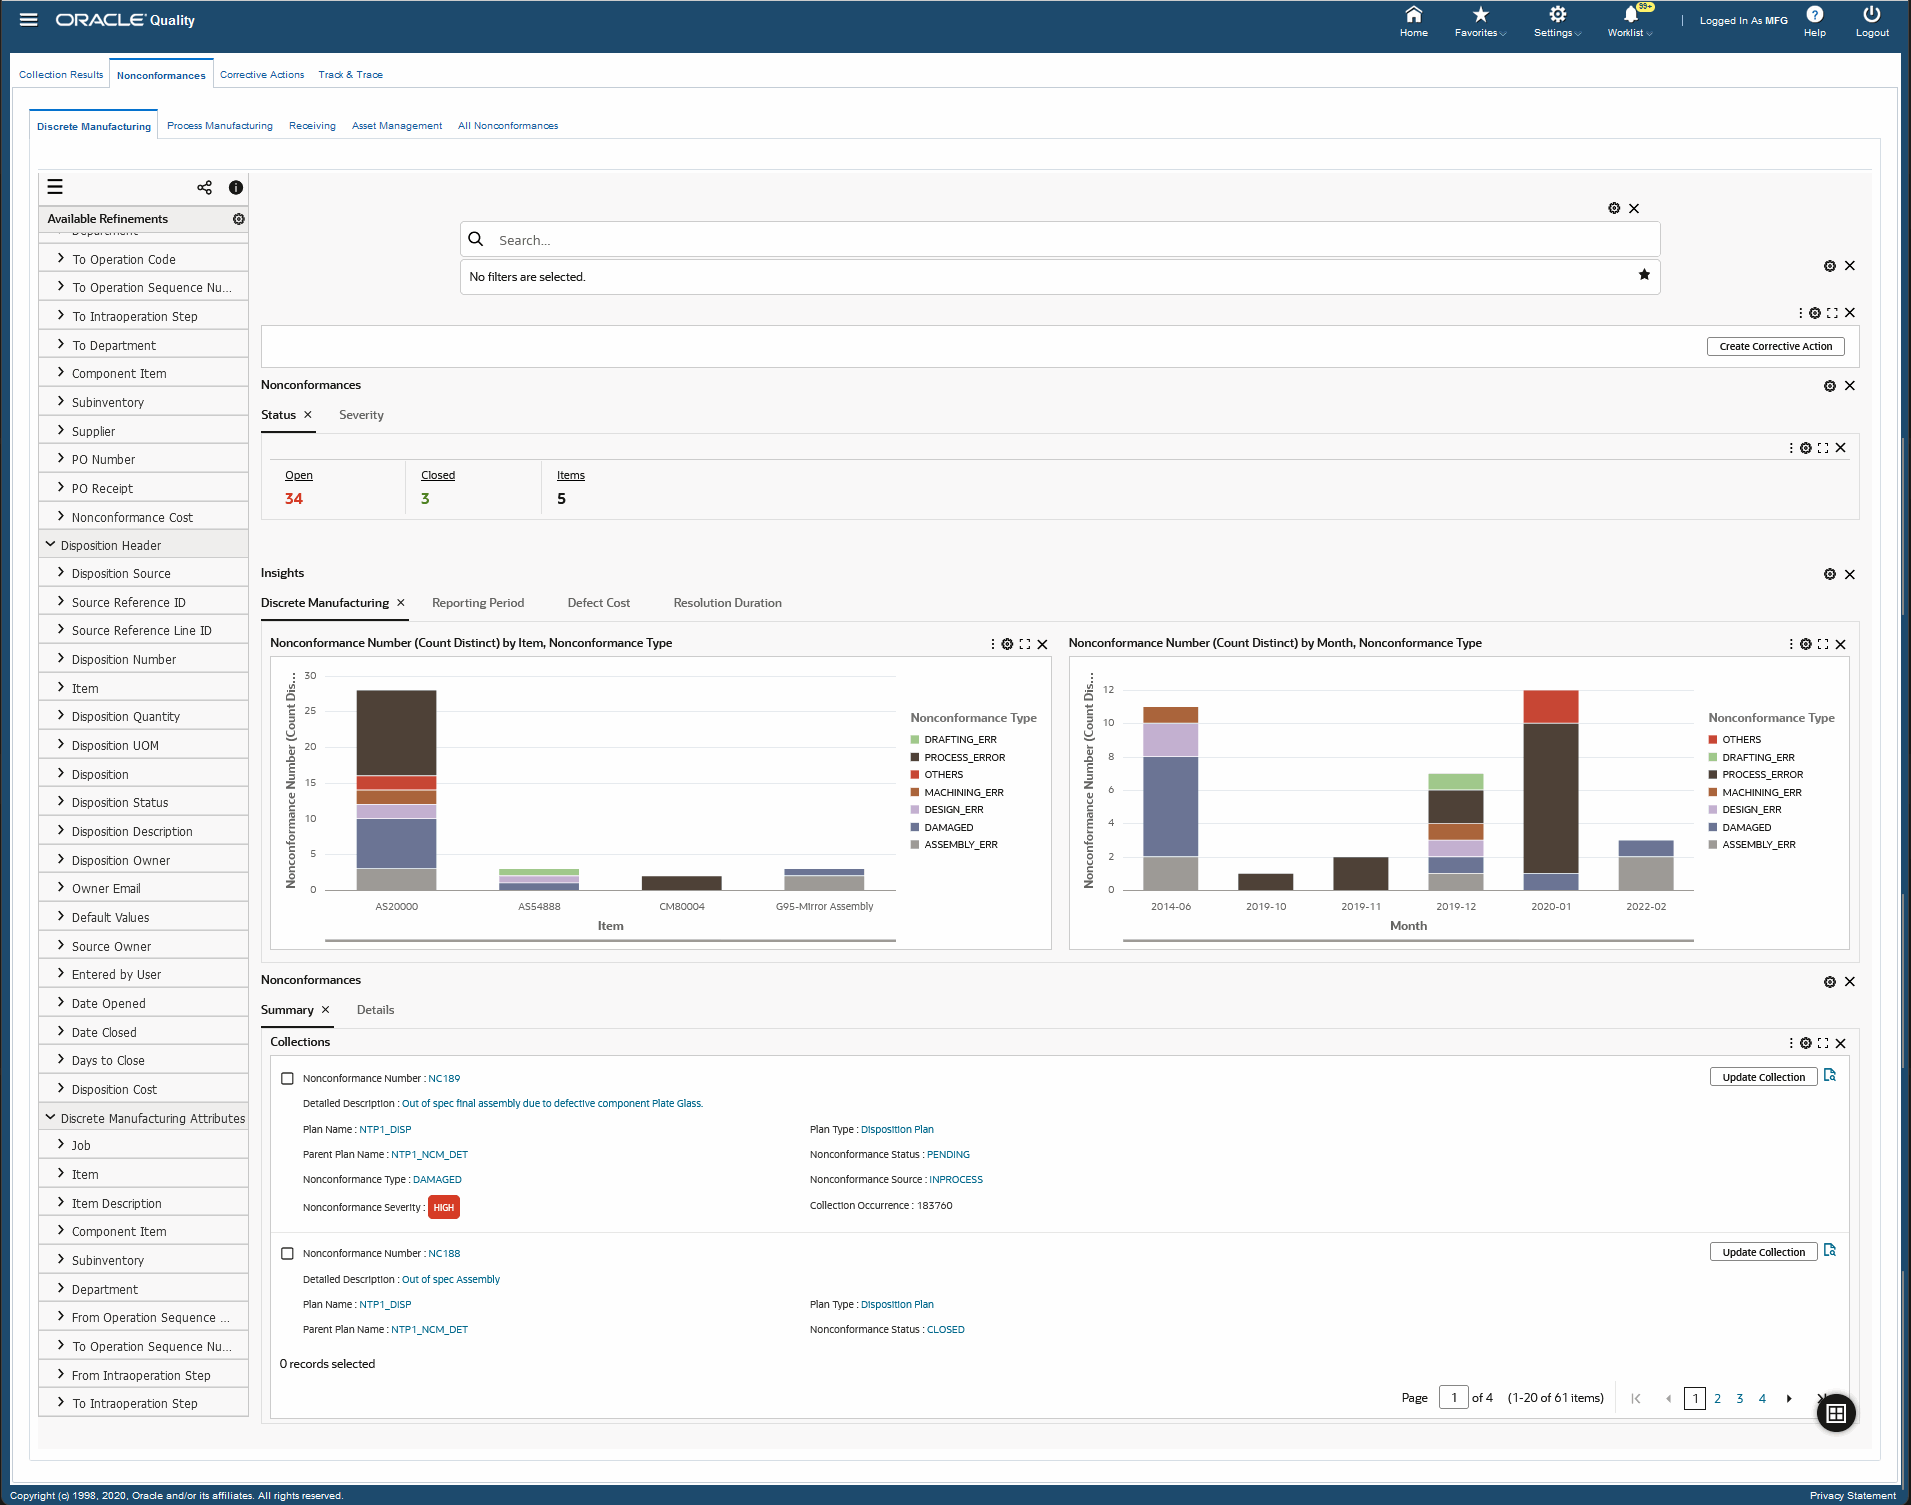
The following table describes the Nonconformances dashboard's Discrete Manufacturing tab components:
| Component |
Description |
| Create Corrective Action (button) |
To log a corrective action for a nonconformance, click Create Corrective Action to navigate to the Corrective Actions tab in the Quality Workbench. |
| Nonconformances (tab layout) |
The Nonconformances tab layout displays key metrics in the following tabs for discrete manufacturing organizations:
-
Status:
-
Open
This metric displays the number of open nonconformances.
-
Closed
This metric displays the number of closed nonconformances.
-
Item
This metric displays the number nonconformances for items.
-
Severity:
-
High Severity
This metric displays the number of high severity nonconformances.
-
Medium Severity
This metric displays the number of medium severity nonconformances.
-
Low Severity
This metric displays the number of low severity nonconformances.
-
Alerts
This metric displays the number of nonconformances alerts. Click this metric to view and select a nonconformance number and type from the list of values.
Click any metric to refine the information in the dashboard. |
| Insights (tab layout) |
The Insights tab layout provides nonconformance information in charts in the following tabs:
-
Discrete Manufacturing
This tab provides charts on nonconformances for discrete manufacturing organizations.
-
Reporting Period
This tab provides charts on nonconformances in a reporting period for discrete manufacturing quality transactions.
-
Defect Costs
This tab provides charts on the defect costs for discrete manufacturing quality transactions.
-
Resolution Duration
This tab provides charts on open and closed nonconformances for discrete manufacturing quality transactions.
You can refine the information that is displayed in the dashboard by clicking a data point on the charts and the dimension and metric value for a data point. |
| Discrete Manufacturing (tab) |
The Discrete Manufacturing tab displays the following charts:
-
Nonconformance Number (Count Distinct) by Item, Nonconformance Type - This chart displays the number of nonconformances for discrete manufacturing organizations and nonconformance types for items. You can click the Options icon to select Nonconformance Severity, Nonconformance Priority, Nonconformance Status, Nonconformance Source, Organization Name, or Organization Code from the Dimension menu. Select Item, Department, Job, Component Item, Nonconformance Source, Nonconformance Type, Nonconformance Severity, Nonconformance Priority, or Nonconformance Status from the Group Dimensions menu.
-
Nonconformance Number (Count Distinct) by Month, Nonconformance Type - This chart displays the nonconformances for items by month and nonconformance types. You can click the Options icon to select Nonconformance Type, Nonconformance Source, Nonconformance Severity, Nonconformance Priority, Nonconformance Status, Organization Name, Department, Organization Code, Item, or Component Item from the Dimension menu. Select Month from the Group Dimensions menu.
|
| Reporting Period (tab) |
The Reporting Period tab displays the following charts for discrete manufacturing quality transactions:
-
Nonconformance Number (Count Distinct) by Month, Nonconformance Type - This chart displays nonconformances and nonconformance type for specific reporting periods. You can click the Options icon to select Nonconformance Type, Nonconformance Source, Nonconformance Severity, Nonconformance Priority, Nonconformance Status, Organization Name, Organization Code, or Department from the Dimension menu. Select Month from the Group Dimensions menu.
-
Disposition Number (Count Distinct) by Month, Disposition - This chart displays the number of dispositions and the type of dispositions for specific reporting periods. You can click the Options icon to select Disposition, Disposition Source, Disposition Status, Disposition Owner, Organization Name, Organization Code, Cause Code, or Defect Code from the Dimension menu. Select Month from the Group Dimensions menu.
|
| Defect Cost (tab) |
The Defect Cost tab displays the following charts for discrete manufacturing quality transactions:
-
Nonconformance Number (Count Distinct) by Quality Nonconforming (Sum), Nonconformance Cost (Sum) by Organization Code, Item - This chart displays defect cost information for nonconformances. You can click the Options icon for each chart to select Organization Code, Nonconformance Type, Nonconformance Source, Nonconformance Status Nonconformance Severity, or Nonconformance Priority from the Dimension menu. Select Item, Supplier, Nonconformance Type, Nonconformance Source, Nonconformance Severity, Nonconformance Priority, or Nonconformance Status from the Group Dimensions menu.
-
Nonconformance Cost (Sum) by Month, Item - This chart displays the nonconformances costs for items within specific months. You can click the Options icon for each chart to select Item, Nonconformance Number, Disposition Number, Quantity Nonconforming, or Disposition Quantity from the Dimension menu. Select Month from the Group Dimensions menu.
|
| Resolution Duration (tab) |
The Resolution Duration tab displays the following charts for discrete manufacturing quality transactions:
Click the Options icon for each chart to select Nonconformance Type or Item from the Dimension menu. From the Group Dimensions menu you can select Item, Nonconformance Type, Department, Job, Component title, or Nonconformance Source. |
| Results Tables (tab layout) |
The results tables on the Nonconformances dashboard's Discrete Manufacturing tab display information about discrete manufacturing collection plans under the following tabs:
-
Summary
Use this tab to view information about collection plans including nonconformance number, detailed description, plan name, plan type, parent plan name.
Use the Update Collection button to update the information for a collection plan in the Quality Workbench.
-
Details
Use this tab to select and view collection results information based on the following options available from the drop-down list:
Click the link icon in the Network column for a nonconformance number to view the Network View diagram in the Track & Trace dashboard. You can also select multiple nonconformance numbers in the Details tab, and then select View Network from the Actions menu.
When you select Discrete Manufacturing Attributes, you can click the View Production Quality link in the Details tab for an item to navigate to the Production Quality dashboard of the Discrete Manufacturing Command Center.
Note: When you click the View Production Quality link for an item to navigate to the Production Quality dashboard, note that the dashboard retains the filters, and shows the same filtered data for the item and job (if information is available for the job).
Click the links in the table columns to refine the information available in the dashboard.
The following actions are available from the Options icon in the Nonconformances dashboard tables:
|
Process Manufacturing Tab
From the Quality responsibility, navigate to the Nonconformances dashboard's Process Manufacturing tab:
(N) Quality > Workbench > Quality Command Center > Nonconformances (tab) > Process Manufacturing tab
Process Manufacturing Tab
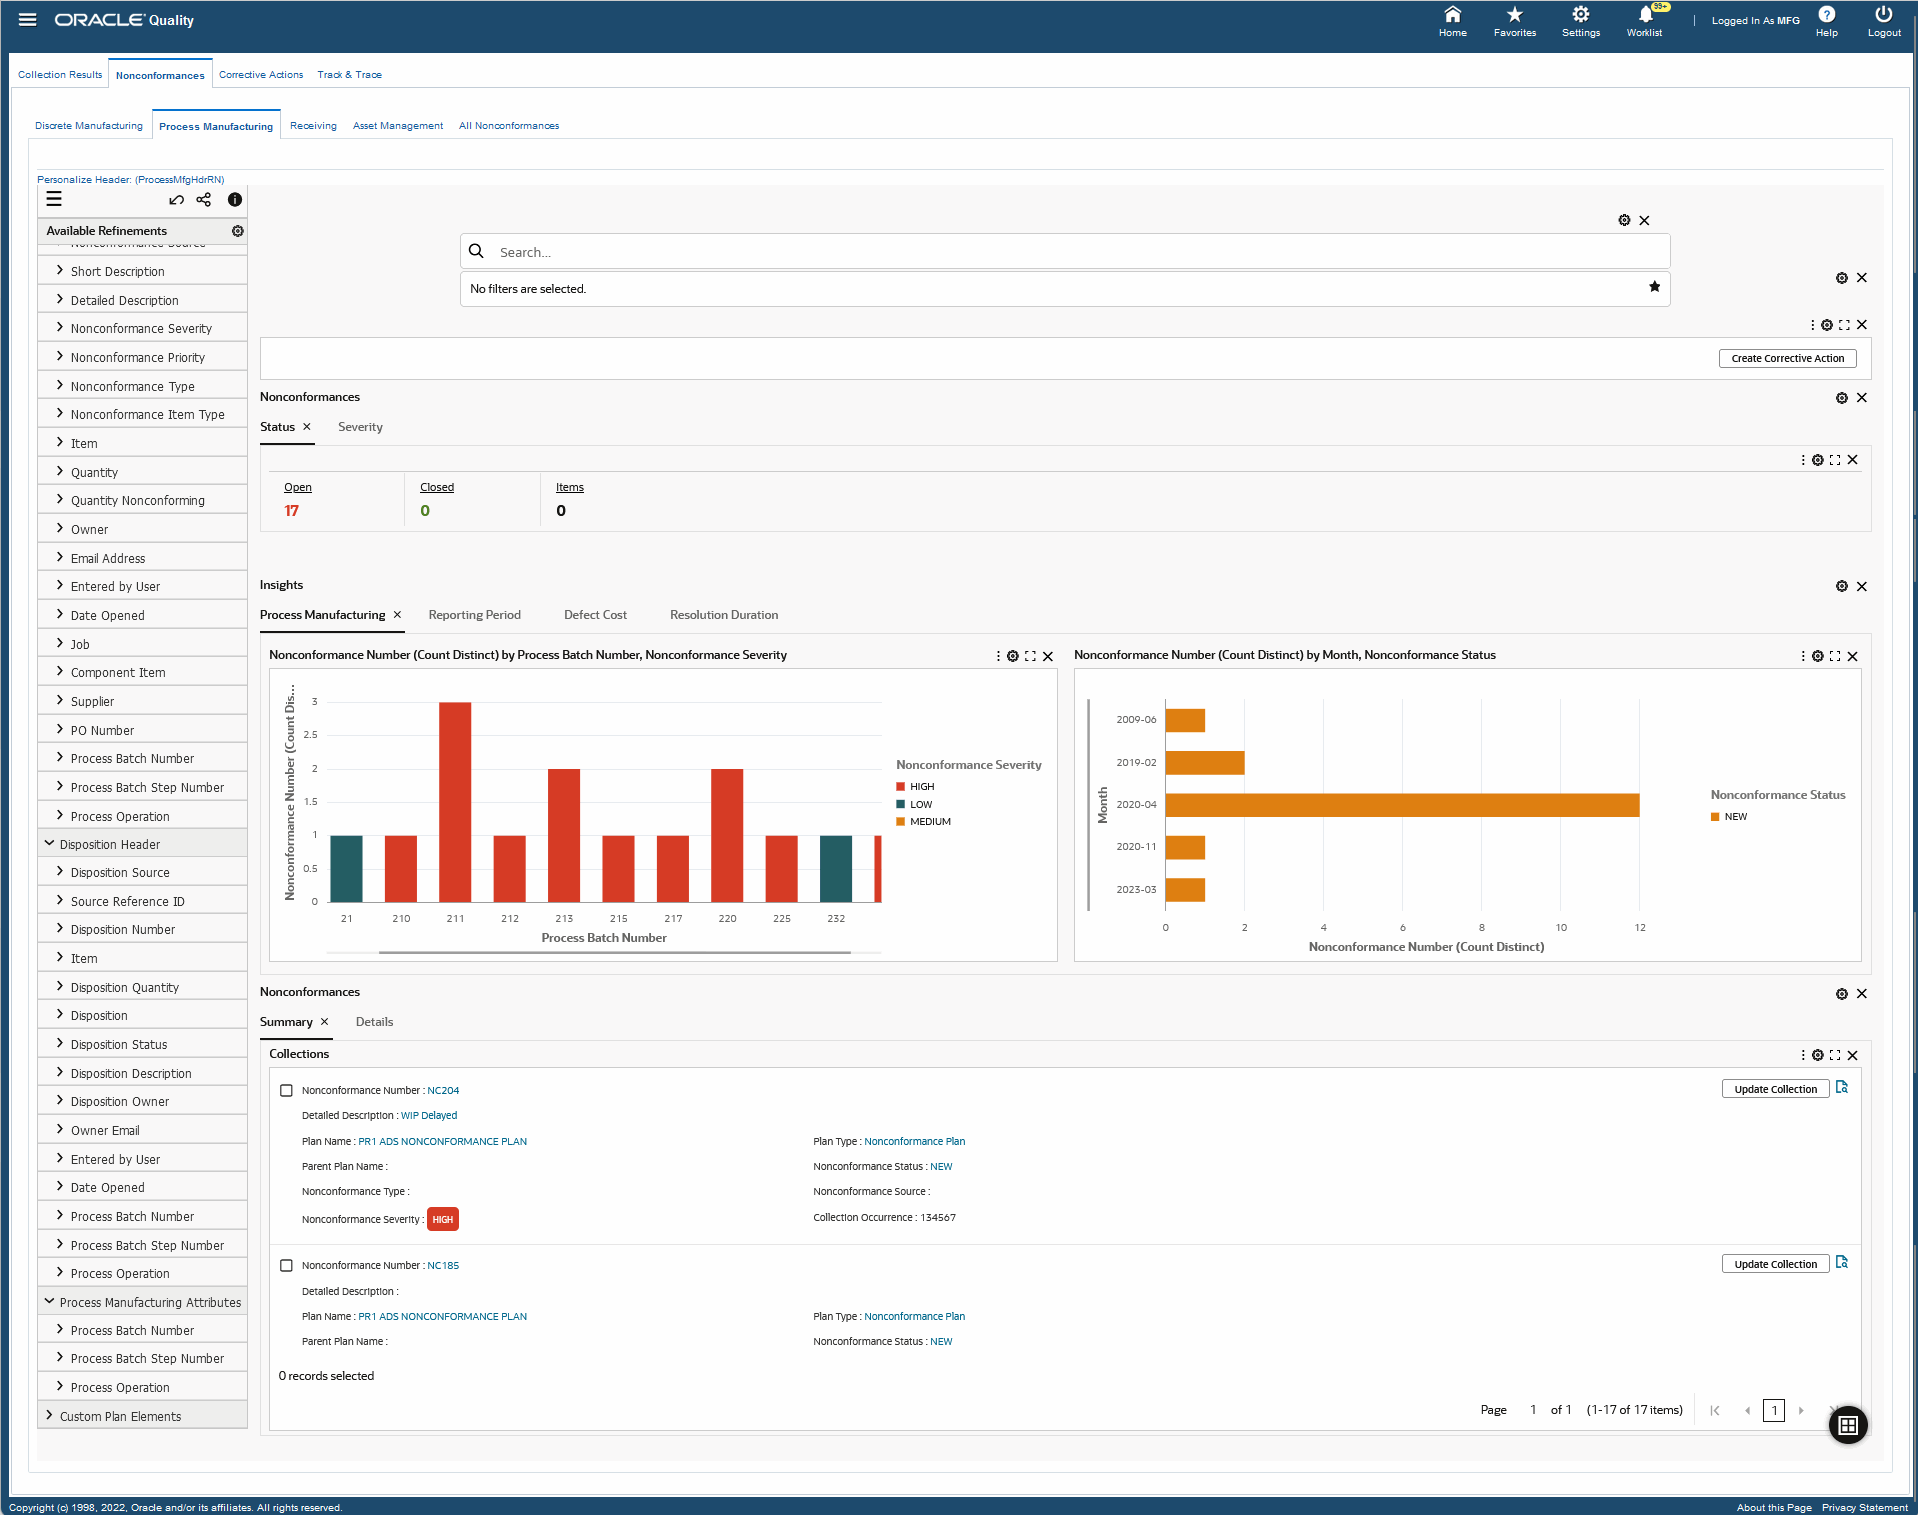
The following table describes the Nonconformances dashboard's Process Manufacturing tab components:
| Component |
Description |
| Create Corrective Action (button) |
To log a corrective action for a nonconformance, click Create Corrective Action to navigate to the Corrective Actions tab in the Quality Workbench. |
| Nonconformances (tab layout) |
The Nonconformances tab layout displays key metrics in the following tabs for process manufacturing organizations:
-
Status:
-
Open
This metric displays the number of open nonconformances.
-
Closed
This metric displays the number of closed nonconformances.
-
Item
This metric displays the number nonconformances for items.
-
Severity:
-
High Severity
This metric displays the number of high severity nonconformances.
-
Medium Severity
This metric displays the number of medium severity nonconformances.
-
Low Severity
This metric displays the number of low severity nonconformances.
-
Alerts
This metric displays the number of nonconformances alerts. Click this metric to view and select a nonconformance number and type from the list of values.
Click any metric to refine the information in the dashboard. |
| Insights (tab layout) |
The Insights tab layout provides nonconformance information in charts in the following tabs:
-
Process Manufacturing
This tab provides charts on nonconformances for process manufacturing organizations.
-
Reporting Period
This tab provides charts on nonconformances in a reporting period for process manufacturing quality transactions.
-
Defect Costs
This tab provides charts on the defect costs for process manufacturing quality transactions.
-
Resolution Duration
This tab provides charts on open and closed nonconformances for process manufacturing quality transactions.
You can refine the information that is displayed in the dashboard by clicking a data point on the charts and the dimension and metric value for a data point. |
| Process Manufacturing (tab) |
The Process Manufacturing tab displays the following charts:
-
Nonconformance Number (Count Distinct) by Process Batch Number, Nonconformance Severity chart displays the number of nonconformances for process manufacturing, on basis on process batch numbers and nonconformance severity. You can click the Options icon to select Nonconformance Severity, Nonconformance Priority, Nonconformance Status, Nonconformance Source, Organization Name, or Organization Code from the Dimension menu. Select Process Batch Number, Process Activity, Process Operation, Process Parameter, Process Resource, Nonconformance Source, Nonconformance Type, Nonconformance Severity, Nonconformance Priority, Nonconformance Status, or Item from the Group Dimensions menu.
-
Nonconformance Number (Count Distinct) by Month and Nonconformance Type chart displays nonconformances for process manufacturing organization by month and nonconformance type. You can click the Options icon to select Nonconformance Type, Nonconformance Source, Nonconformance Severity, Nonconformance Priority, Nonconformance Status, Organization Name, Organization Code, Department, or Component Item from the Dimension menu. Select Month from the Group Dimensions menu.
|
| Reporting Period (tab) |
The Reporting Period tab displays the following charts for process manufacturing quality transactions:
-
Nonconformance Number (Count Distinct) by Month, Nonconformance Type - This chart displays nonconformances and nonconformance type for specific reporting periods. You can click the Options icon to select Nonconformance Type, Nonconformance Source, Nonconformance Severity, Nonconformance Priority, Nonconformance Status, Organization Name, Organization Code, or Department from the Dimension menu. Select Month from the Group Dimensions menu.
-
Disposition Number (Count Distinct) by Month, Disposition - This chart displays the number of dispositions and the type of dispositions for specific reporting periods. You can click the Options icon to select Disposition, Disposition Source, Disposition Status, Disposition Owner, Organization Name, Organization Code, Cause Code, or Defect Code from the Dimension menu. Select Month from the Group Dimensions menu.
|
| Defect Cost (tab) |
The Defect Cost tab displays the following charts for process manufacturing quality transactions:
-
Nonconformance Number (Count Distinct) by Quality Nonconforming (Sum), Nonconformance Cost (Sum) by Organization Code, Item - This chart displays defect cost information for nonconformances. You can click the Options icon for each chart to select Organization Code, Nonconformance Type, Nonconformance Source, Nonconformance Status Nonconformance Severity, or Nonconformance Priority from the Dimension menu. Select Item, Supplier, Nonconformance Type, Nonconformance Source, Nonconformance Severity, Nonconformance Priority, or Nonconformance Status from the Group Dimensions menu.
-
Nonconformance Cost (Sum) by Month, Item - This chart displays the nonconformances costs for items within specific months. You can click the Options icon for each chart to select Item, Nonconformance Number, Disposition Number, Quantity Nonconforming, or Disposition Quantity from the Dimension menu. Select Month from the Group Dimensions menu.
|
| Resolution Duration (tab) |
The Resolution Duration tab displays the following charts for process manufacturing quality transactions:
Click the Options icon for each chart to select Nonconformance Type or Item from the Dimension menu. From the Group Dimensions menu you can select Item, Nonconformance Type, Department, Job, Component title, or Nonconformance Source. |
| Results Tables (tab layout) |
The results tables on the Nonconformances dashboard's Process Manufacturing tab display information about process manufacturing collection plans under the following tabs:
-
Summary
Use this tab to view information about collection plans including nonconformance number, detailed description, plan name, plan type, parent plan name.
Use the Update Collection button to update the information for a collection plan in the Quality Workbench.
-
Details
Use this tab to select and view collection results information based on the following options available from the drop-down list:
Click the link icon in the Network column for a nonconformance number to view the Network View diagram in the Track & Trace dashboard. You can also select multiple nonconformance numbers in the Details tab, and then select View Network from the Actions menu.
Click the links in the table columns to refine the information available in the dashboard.
The following actions are available from the Options icon in the Nonconformances dashboard tables:
|
Receiving Tab
From the Quality responsibility, navigate to the Nonconformances dashboard's Receiving tab:
(N) Quality > Workbench > Quality Command Center > Nonconformances (tab) > Receiving tab
Receiving Tab
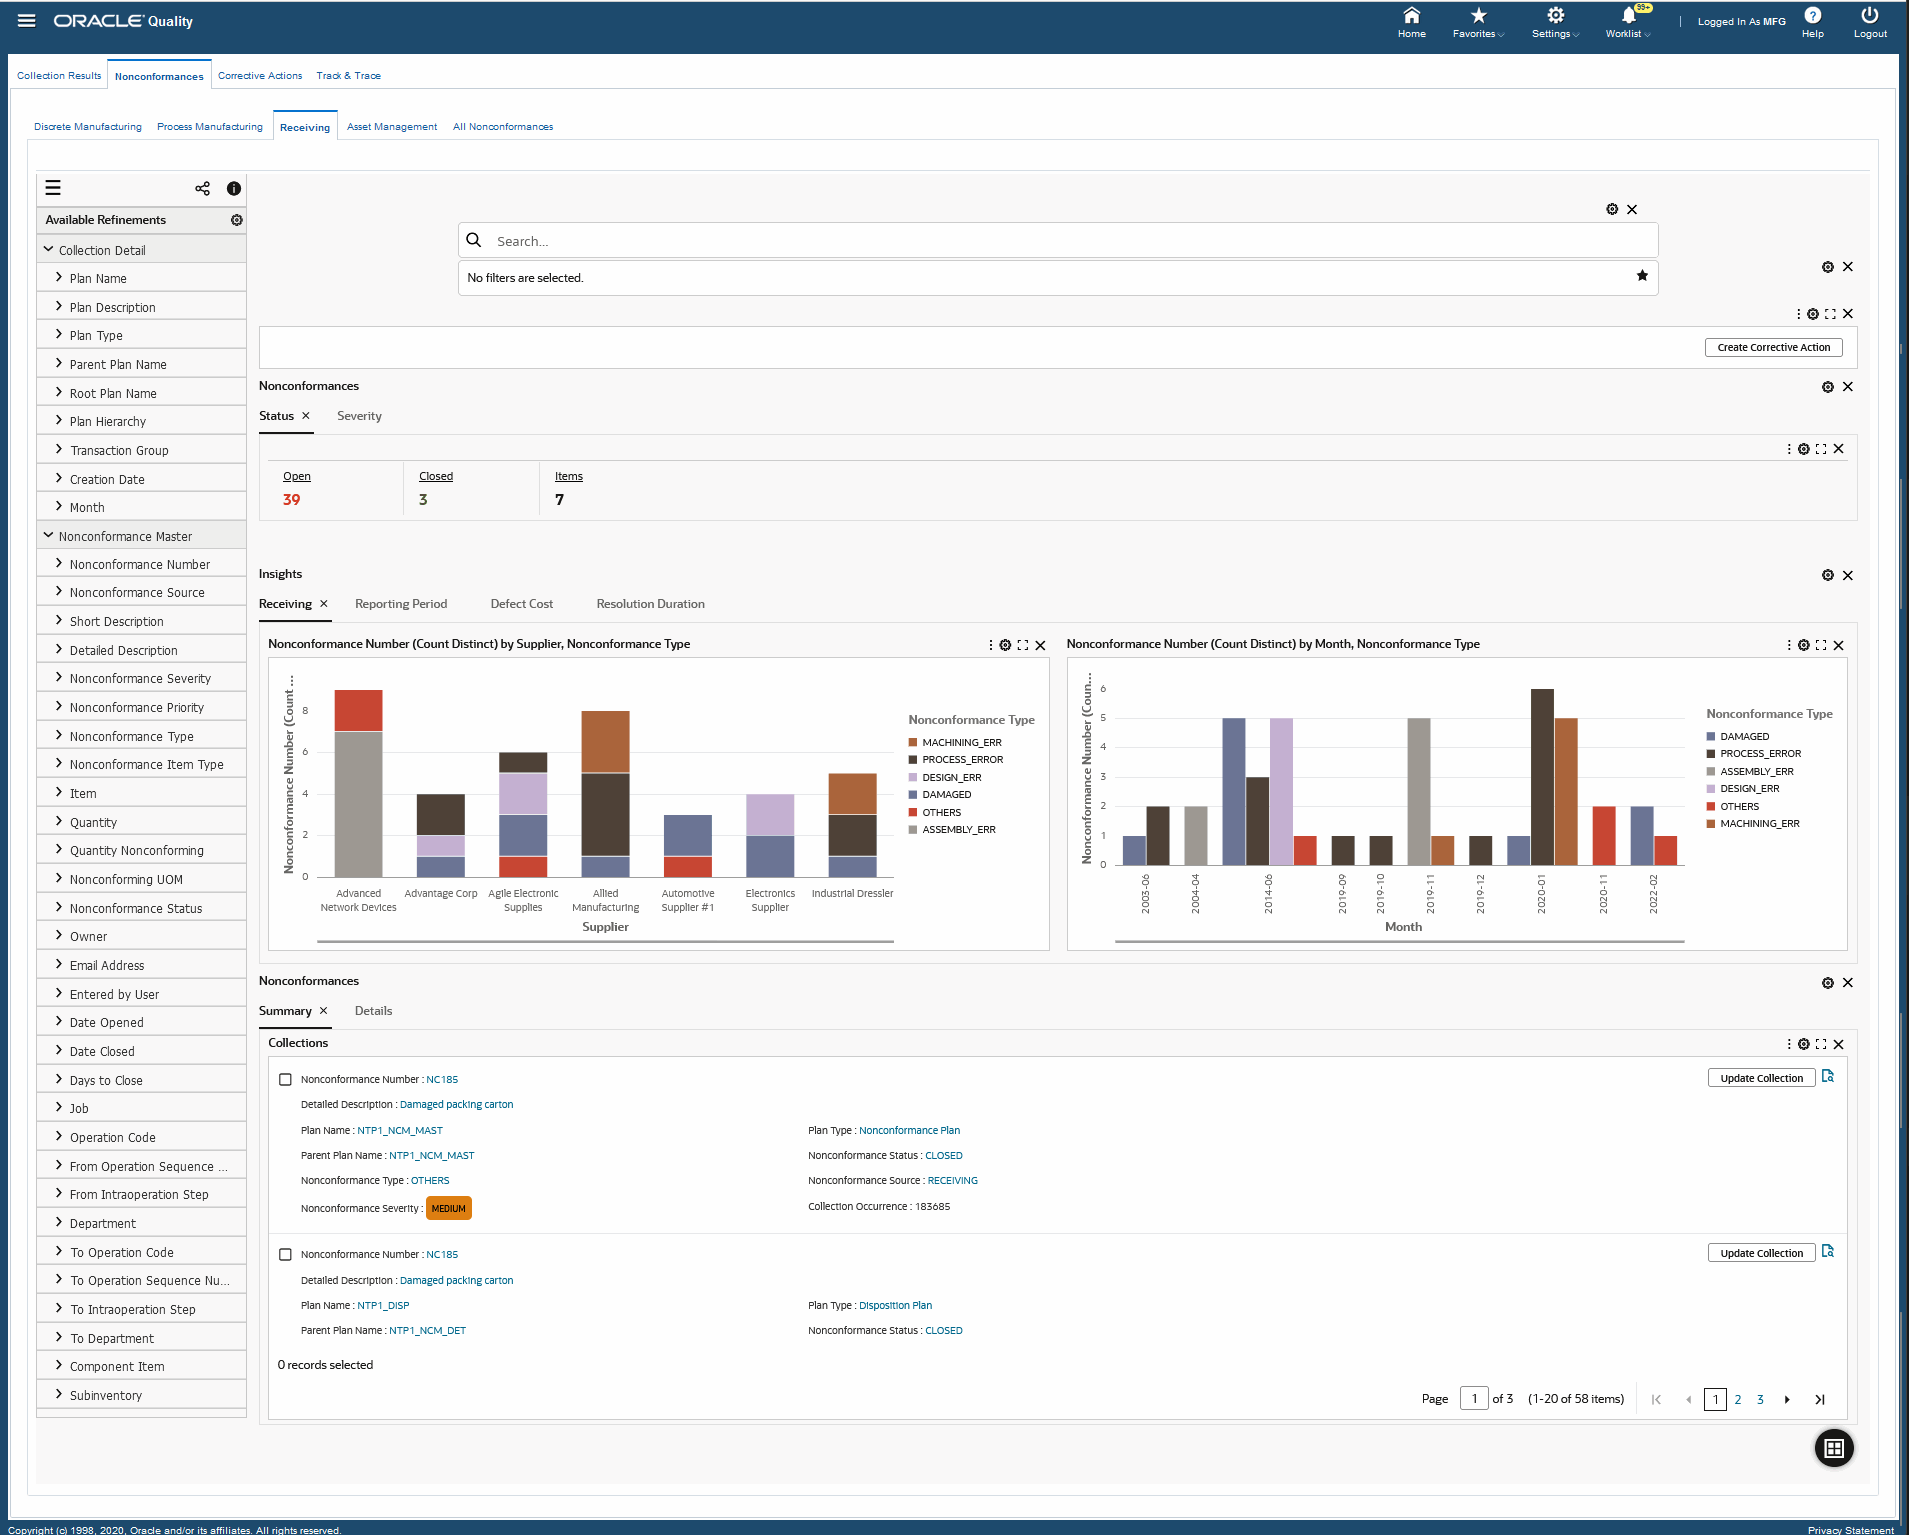
The following table describes the Nonconformances dashboard's Receiving tab components:
| Component |
Description |
| Create Corrective Action (button) |
To log a corrective action for a nonconformance, click Create Corrective Action to navigate to the Corrective Actions tab in the Quality Workbench. |
| Nonconformances (tab layout) |
The Nonconformances tab layout displays key metrics in the following tabs for receiving quality transactions:
-
Status:
-
Open
This metric displays the number of open nonconformances.
-
Closed
This metric displays the number of closed nonconformances.
-
Item
This metric displays the number nonconformances for items.
-
Severity:
-
High Severity
This metric displays the number of high severity nonconformances.
-
Medium Severity
This metric displays the number of medium severity nonconformances.
-
Low Severity
This metric displays the number of low severity nonconformances.
-
Alerts
This metric displays the number of nonconformances alerts. Click this metric to view and select a nonconformance number and type from the list of values.
Click any metric to refine the information in the dashboard. |
| Insights (tab layout) |
The Insights tab layout provides nonconformance information in charts in the following tabs:
-
Receiving
This tab provides charts on the nonconformances for receiving transactions.
-
Reporting Period
This tab provides charts on nonconformances in a reporting period for receiving quality transactions.
-
Defect Costs
This tab provides charts on the defect costs for receiving quality transactions.
-
Resolution Duration
This tab provides charts on open and closed nonconformances for receiving quality transactions.
You can refine the information that is displayed in the dashboard by clicking a data point on the charts and the dimension and metric value for a data point. |
| Receiving (tab) |
The Receiving tab displays the following charts:
-
Nonconformance Number (Count Distinct) by Supplier, Nonconformance Type - This chart displays the number of nonconformances, the supplier and nonconformance type for receiving transactions. You can click the Options icon to select Nonconformance Type, Nonconformance Source, Nonconformance Severity, Nonconformance Priority, Nonconformance Status, Organization Name, or Organization Code from the Dimension menu. Select Supplier, Item, Component Item, Nonconformance Type, Nonconformance Source, Nonconformance Severity, Nonconformance Priority, or Nonconformance Status from the Group Dimensions menu.
-
Nonconformance Number (Count Distinct) by Month, Nonconformance Type - This chart displays nonconformances by month and nonconformance type for receiving transactions. You can click the Options icon to select Nonconformance Type, Nonconformance Source, Nonconformance Severity, Nonconformance Priority, Nonconformance Status, Organization Name, Organization Code, Department, Item, Component, or Supplier from the Dimension menu. Select Month from the Group Dimensions menu.
|
| Reporting Period (tab) |
The Reporting Period tab displays the following charts for receiving quality transactions:
-
Nonconformance Number (Count Distinct) by Month, Nonconformance Type - This chart displays nonconformances and nonconformance type for specific reporting periods. You can click the Options icon to select Nonconformance Type, Nonconformance Source, Nonconformance Severity, Nonconformance Priority, Nonconformance Status, Organization Name, Organization Code, or Department from the Dimension menu. Select Month from the Group Dimensions menu.
-
Disposition Number (Count Distinct) by Month, Disposition - This chart displays the number of dispositions and the type of dispositions for specific reporting periods. You can click the Options icon to select Disposition, Disposition Source, Disposition Status, Disposition Owner, Organization Name, Organization Code, Cause Code, or Defect Code from the Dimension menu. Select Month from the Group Dimensions menu.
|
| Defect Cost (tab) |
The Defect Cost tab displays the following charts for receiving quality transactions:
-
Nonconformance Number (Count Distinct) by Quality Nonconforming (Sum), Nonconformance Cost (Sum) by Organization Code, Item - This chart displays defect cost information for nonconformances. You can click the Options icon for each chart to select Organization Code, Nonconformance Type, Nonconformance Source, Nonconformance Status Nonconformance Severity, or Nonconformance Priority from the Dimension menu. Select Item, Supplier, Nonconformance Type, Nonconformance Source, Nonconformance Severity, Nonconformance Priority, or Nonconformance Status from the Group Dimensions menu.
-
Nonconformance Cost (Sum) by Month, Item - This chart displays the nonconformances costs for items within specific months. You can click the Options icon for each chart to select Item, Nonconformance Number, Disposition Number, Quantity Nonconforming, or Disposition Quantity from the Dimension menu. Select Month from the Group Dimensions menu.
|
| Resolution Duration (tab) |
The Resolution Duration tab displays the following charts for receiving quality transactions:
Click the Options icon for each chart to select Nonconformance Type or Item from the Dimension menu. From the Group Dimensions menu you can select Item, Nonconformance Type, Department, Job, Component title, or Nonconformance Source. |
| Results Tables (tab layout) |
The results tables on the Nonconformances dashboard's Receiving tab display information about receiving collection plans under the following tabs:
-
Summary
Use this tab to view information about collection plans including nonconformance number, detailed description, plan name, plan type, parent plan name.
Use the Update Collection button to update the information for a collection plan in the Quality Workbench.
-
Details
Use this tab to select and view collection results information based on the following options available from the drop-down list:
Click the link icon in the Network column for a nonconformance number to view the Network View diagram in the Track & Trace dashboard. You can also select multiple nonconformance numbers in the Details tab, and then select View Network from the Actions menu.
-
Collection Detail
-
Nonconformance Master
-
Disposition Header
-
Receiving Attributes
-
Custom Plan Elements
Click the links in the table columns to refine the information available in the dashboard.
The following actions are available from the Options icon in the Nonconformances dashboard tables:
|
Asset Management Tab
From the Quality responsibility, navigate to the Nonconformances dashboard's Asset Management tab:
(N) Quality > Workbench > Quality Command Center > Nonconformances (tab) > Asset Management tab
Asset Management Dashboard
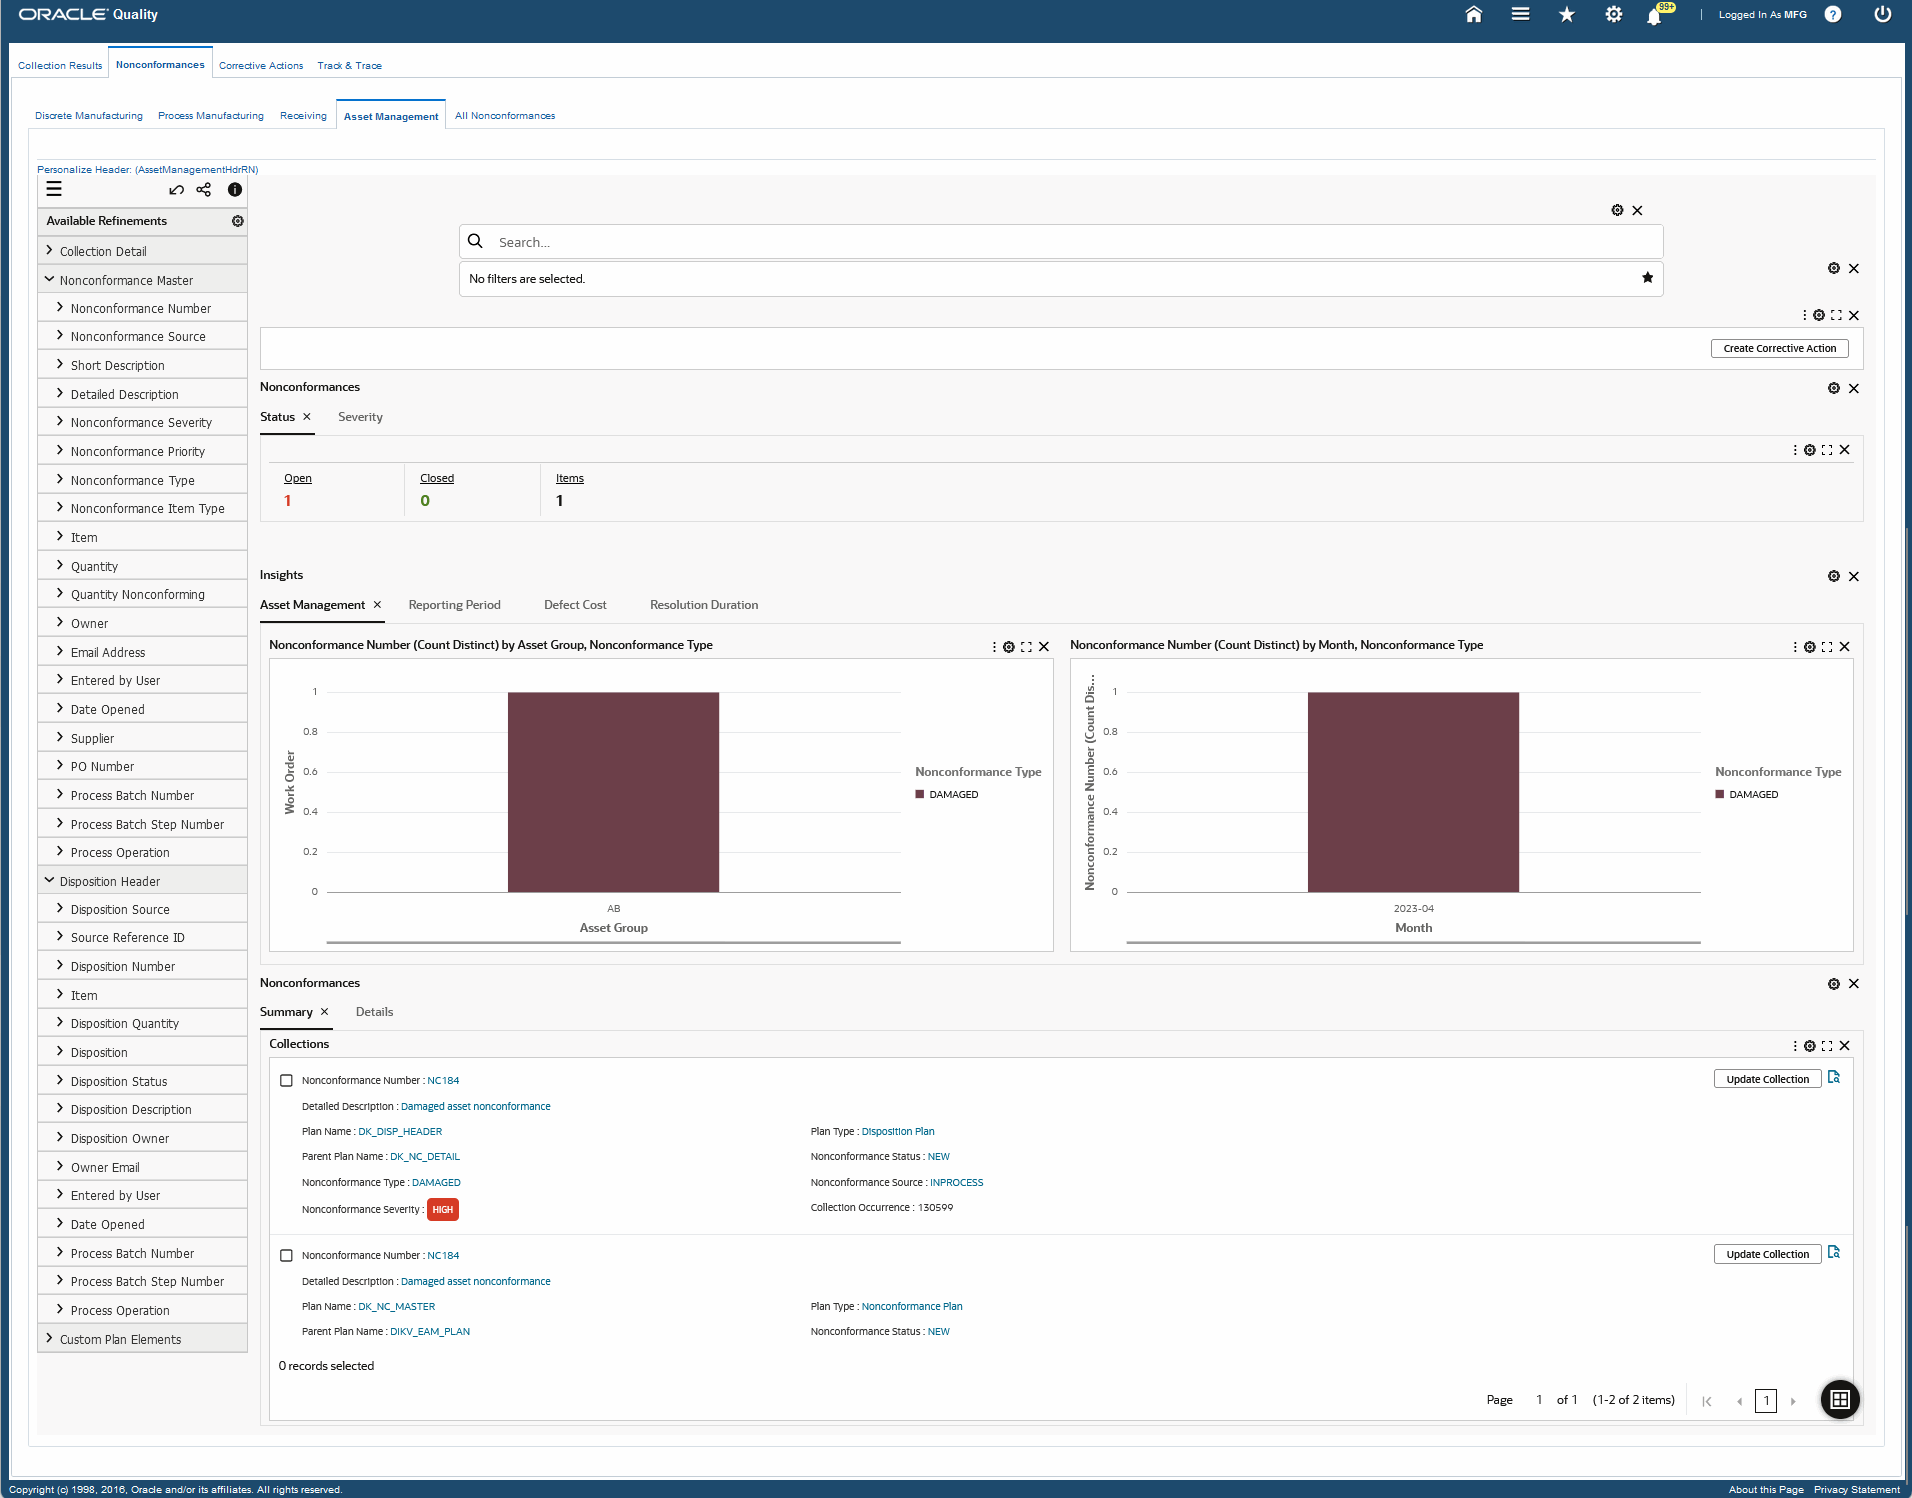
The following table describes the Nonconformances dashboard's Asset Management tab components:
| Component |
Description |
| Create Corrective Action (button) |
To log a corrective action for a nonconformance, click Create Corrective Action to navigate to the Corrective Actions tab in the Quality Workbench. |
| Nonconformances (tab layout) |
The Nonconformances tab layout displays key metrics in the following tabs for asset management quality transactions:
-
Status:
-
Open
This metric displays the number of open nonconformances.
-
Closed
This metric displays the number of closed nonconformances.
-
Item
This metric displays the number nonconformances for items.
-
Severity:
-
High Severity
This metric displays the number of high severity nonconformances.
-
Medium Severity
This metric displays the number of medium severity nonconformances.
-
Low Severity
This metric displays the number of low severity nonconformances.
-
Alerts
This metric displays the number of nonconformances alerts. Click this metric to view and select a nonconformance number and type from the list of values.
Click any metric to refine the information in the dashboard. |
| Insights (tab layout) |
The Insights tab layout provides nonconformance information in charts in the following tabs:
-
Asset Management
This tab provides charts on the nonconformances for asset management.
-
Reporting Period
This tab provides charts on nonconformances in a reporting period for asset management quality transactions.
-
Defect Costs
This tab provides charts on the defect costs for asset management quality transactions.
-
Resolution Duration
This tab provides charts on open and closed nonconformances for asset management quality transactions.
You can refine the information that is displayed in the dashboard by clicking a data point on the charts and the dimension and metric value for a data point. |
| Asset Management (tab) |
The Asset Management tab displays the following charts:
-
Maintenance Work Order (Count Distinct) by Asset Group, Nonconformance Type - This chart displays nonconformances for asset management on the basis of asset groups and nonconformance types. You can click the Options icon to select Nonconformance Type, Nonconformance Source, Nonconformance Severity, Nonconformance Priority, Nonconformance Status, or Organization Name from the Dimension menu. Select Asset Group, Asset Activity, Nonconformance Type, Nonconformance Source, Nonconformance Severity, Nonconformance Priority, or Nonconformance Status from the Group Dimensions menu.
-
Nonconformance Number (Count Distinct) by Month, Nonconformance Type - This chart displays the number of nonconformances and nonconformance type for asset management quality issues. You can click the Options icon to select Nonconformance Type, Nonconformance Source, Nonconformance Severity, Nonconformance Priority, Nonconformance Status, Organization Name, Organization Code, Department, Item, or Component Item from the Dimension menu. Select Month from the Group Dimensions menu.
|
| Reporting Period (tab) |
The Reporting Period tab displays the following charts for asset management quality transactions:
-
Nonconformance Number (Count Distinct) by Month, Nonconformance Type - This chart displays nonconformances and nonconformance type for specific reporting periods. You can click the Options icon to select Nonconformance Type, Nonconformance Source, Nonconformance Severity, Nonconformance Priority, Nonconformance Status, Organization Name, Organization Code, or Department from the Dimension menu. Select Month from the Group Dimensions menu.
-
Disposition Number (Count Distinct) by Month, Disposition - This chart displays the number of dispositions and the type of dispositions for specific reporting periods. You can click the Options icon to select Disposition, Disposition Source, Disposition Status, Disposition Owner, Organization Name, Organization Code, Cause Code, or Defect Code from the Dimension menu. Select Month from the Group Dimensions menu.
|
| Defect Cost (tab) |
The Defect Cost tab displays the following charts for asset management quality transactions:
-
Nonconformance Number (Count Distinct) by Quality Nonconforming (Sum), Nonconformance Cost (Sum) by Organization Code, Item - This chart displays defect cost information for nonconformances. You can click the Options icon for each chart to select Organization Code, Nonconformance Type, Nonconformance Source, Nonconformance Status Nonconformance Severity, or Nonconformance Priority from the Dimension menu. Select Item, Supplier, Nonconformance Type, Nonconformance Source, Nonconformance Severity, Nonconformance Priority, or Nonconformance Status from the Group Dimensions menu.
-
Nonconformance Cost (Sum) by Month, Item - This chart displays the nonconformances costs for items within specific months. You can click the Options icon for each chart to select Item, Nonconformance Number, Disposition Number, Quantity Nonconforming, or Disposition Quantity from the Dimension menu. Select Month from the Group Dimensions menu.
|
| Resolution Duration (tab) |
The Resolution Duration tab displays the following charts for asset management quality transactions:
Click the Options icon for each chart to select Nonconformance Type or Item from the Dimension menu. From the Group Dimensions menu you can select Item, Nonconformance Type, Department, Job, Component title, or Nonconformance Source. |
| Results Tables (tab layout) |
The results tables on the Nonconformances dashboard's Asset Management tab display information about asset management collection plans under the following tabs:
-
Summary
Use this tab to view information about collection plans including nonconformance number, detailed description, plan name, plan type, parent plan name.
Use the Update Collection button to update the information for a collection plan in the Quality Workbench.
-
Details
Use this tab to select and view collection results information based on the following options available from the drop-down list:
Click the link icon in the Network column for a nonconformance number to view the Network View diagram in the Track & Trace dashboard. You can also select multiple nonconformance numbers in the Details tab, and then select View Network from the Actions menu.
Click the links in the table columns to refine the information available in the dashboard.
The following actions are available from the Options icon in the Nonconformances dashboard tables:
|
All Nonconformances Tab
From the Quality responsibility, navigate to the Nonconformances dashboard's All Nonconformance tab:
(N) Quality > Workbench > Quality Command Center > Nonconformances (tab) > All Nonconformances tab
All Nonconformances Tab
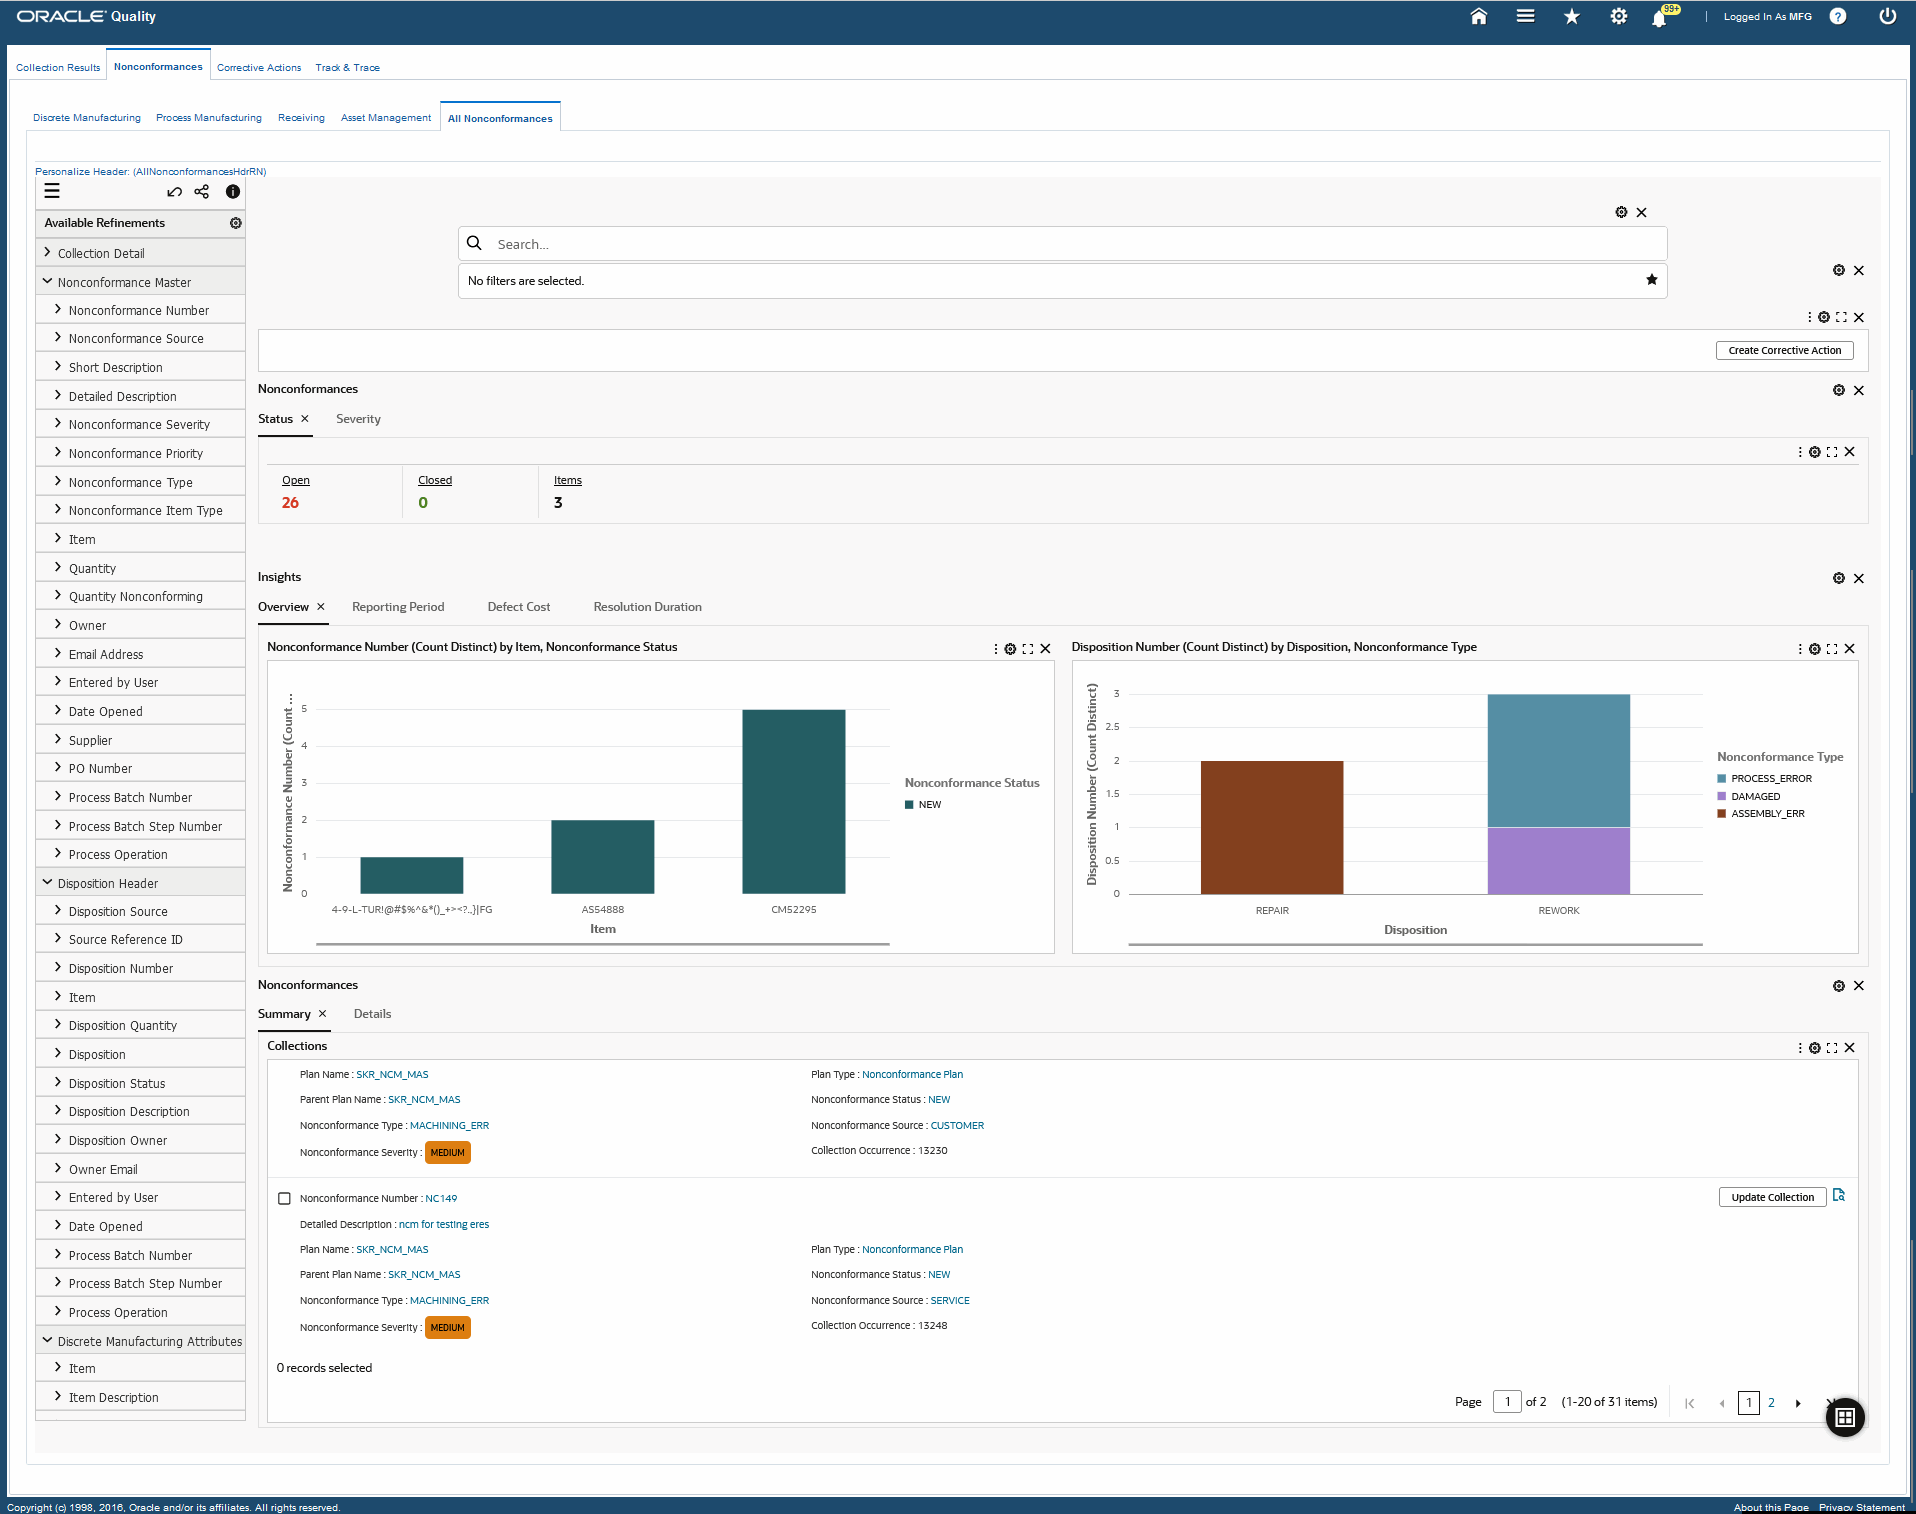
The following table describes the Nonconformances dashboard's All Nonconformances tab components:
| Component |
Description |
| Create Corrective Action (button) |
To log a corrective action for a nonconformance, click Create Corrective Action to navigate to the Corrective Actions tab in the Quality Workbench. |
| Nonconformances (tab layout) |
The Nonconformances tab layout displays key metrics in the following tabs:
-
Status:
-
Open
This metric displays the number of open nonconformances.
-
Closed
This metric displays the number of closed nonconformances.
-
Item
This metric displays the number nonconformances for items.
-
Severity:
-
High Severity
This metric displays the number of high severity nonconformances.
-
Medium Severity
This metric displays the number of medium severity nonconformances.
-
Low Severity
This metric displays the number of low severity nonconformances.
-
Alerts
This metric displays the number of nonconformances alerts. Click this metric to view and select a nonconformance number and type from the list of values.
Click any metric to refine the information in the dashboard. |
| Insights (tab layout) |
The Insights tab layout provides nonconformance information in charts in the following tabs: for all nonconformances across transaction groups
-
Overview
This tab provides charts on all reported nonconformances.
-
Reporting Period
This tab provides charts on all nonconformances in a reporting period.
-
Defect Costs
This tab provides charts on defect costs.
-
Resolution Duration
This tab provides charts about resolution information for all open and closed nonconformances.
You can refine the information that is displayed in the dashboard by clicking a data point on the charts and the dimension and metric value for a data point. |
| Overview (tab) |
The Overview tab displays the following charts for all nonconformances:
-
Nonconformance Number (Count Distinct) by Nonconformance Source, Nonconformance Type - This chart displays the number of nonconformances for each nonconformance type and source like receiving, customer, or service. You can click the Options icon to select Nonconformance Type, Nonconformance Severity, Nonconformance Priority, Nonconformance Status, Nonconformance Source, Organization Name, or Organization Code from the Dimension menu. Select Nonconformance Source, Nonconformance Type, Nonconformance Severity, Nonconformance Priority, Nonconformance Status, Item, Component Item, Asset Group, Supplier, Asset Activity, or Transaction Group Organization Name, Organization Code, or Department from the Group Dimensions menu.
-
Dispositions - This chart displays the number of dispositions, disposition type, and the disposition involved like repair, rework and so on. You can click the Options icon to select Nonconformance, Nonconformance Type, Nonconformance Source, Nonconformance Severity, Nonconformance Priority, or Nonconformance Status, Defect Code, Cause Code, Disposition, Disposition Status, Disposition Source, Disposition Owner, Organization Name, or Organization Code from the Dimension menu. Select Disposition, Disposition Source, Disposition Status, Disposition Owner, Item, Component Item, or Transaction Group from the Group Dimensions menu.
|
| Reporting Period (tab) |
The Reporting Period tab displays the following charts for all nonconformances:
-
Nonconformance Number (Count Distinct) by Month, Nonconformance Type - This chart displays nonconformances and nonconformance type for specific reporting periods. You can click the Options icon to select Nonconformance Type, Nonconformance Source, Nonconformance Severity, Nonconformance Priority, Nonconformance Status, Organization Name, Organization Code, or Department from the Dimension menu. Select Month from the Group Dimensions menu.
-
Disposition Number (Count Distinct) by Month, Disposition - This chart displays the number of dispositions and the type of dispositions for specific reporting periods. You can click the Options icon to select Disposition, Disposition Source, Disposition Status, Disposition Owner, Organization Name, Organization Code, Cause Code, or Defect Code from the Dimension menu. Select Month from the Group Dimensions menu.
|
| Defect Cost (tab) |
The Defect Cost tab displays the following charts or all nonconformances:
-
Nonconformance Number (Count Distinct) by Quality Nonconforming (Sum), Nonconformance Cost (Sum) by Organization Code, Item - This chart displays defect cost information for nonconformances. You can click the Options icon for each chart to select Organization Code, Nonconformance Type, Nonconformance Source, Nonconformance Status Nonconformance Severity, or Nonconformance Priority from the Dimension menu. Select Item, Supplier, Nonconformance Type, Nonconformance Source, Nonconformance Severity, Nonconformance Priority, or Nonconformance Status from the Group Dimensions menu.
-
Nonconformance Cost (Sum) by Month, Item - This chart displays the nonconformances costs for items within specific months. You can click the Options icon for each chart to select Item, Nonconformance Number, Disposition Number, Quantity Nonconforming, or Disposition Quantity from the Dimension menu. Select Month from the Group Dimensions menu.
|
| Resolution Duration (tab) |
The Resolution Duration tab displays the following charts for all nonconformances:
Click the Options icon for each chart to select Nonconformance Type or Item from the Dimension menu. From the Group Dimensions menu you can select Item, Nonconformance Type, Department, Job, Component title, or Nonconformance Source. |
| Results Tables (tab layout) |
The results tables on the Nonconformances dashboard's All Nonconformances tab display information about all collection plans under the following tabs:
-
Summary
Use this tab to view information about collection plans including nonconformance number, detailed description, plan name, plan type, parent plan name.
Use the Update Collection button to update the information for a collection plan in the Quality Workbench.
-
Details
Use this tab to select and view collection results information based on the following options available from the drop-down list:
Click the link icon in the Network column for a nonconformance number to view the Network View diagram in the Track & Trace dashboard. You can also select multiple nonconformance numbers in the Details tab, and then select View Network from the Actions menu.
-
Collection Detail
-
Nonconformance Master
-
Disposition Header
-
Discrete Manufacturing Attributes
-
Process Manufacturing Attributes
-
Receiving Attributes
-
Asset Management Attributes
-
Custom Plan Elements
When you select Discrete Manufacturing Attributes, you can click the View Production Quality link in the Details tab for an item to navigate to the Production Quality dashboard of the Discrete Manufacturing Command Center.
Note: When you click the View Production Quality link for an item to navigate to the Production Quality dashboard, note that the dashboard retains the filters, and shows the same filtered data for the item and job (if information is available for the job).
Click the links in the table columns to refine the information available in the dashboard.
The following actions are available from the Options icon in the Nonconformances dashboard tables:
|
See:
Corrective Actions Dashboard
The Corrective Actions dashboard enables quality analysts and quality managers to ensure proper execution of the identified correction actions that have been logged for nonconformances. Use the Corrective Actions dashboard to:
-
Create corrective actions for identified nonconformances.
-
Prioritize the identified corrective actions.
-
Track status and progress of corrective actions.
-
Manage corrective action processes.
-
Navigate from the results tables to track and trace corrective actions in the Track & Trace dashboard.
Using refinements you can search for specific information and analyze the quality corrective actions metrics, charts, and results tables. See the Quality Command Center Overview for more information.
From the Quality responsibility, navigate to the Corrective Actions dashboard:
(N) Quality > Workbench > Quality Command Center > Corrective Actions (tab)
Corrective Actions Dashboard
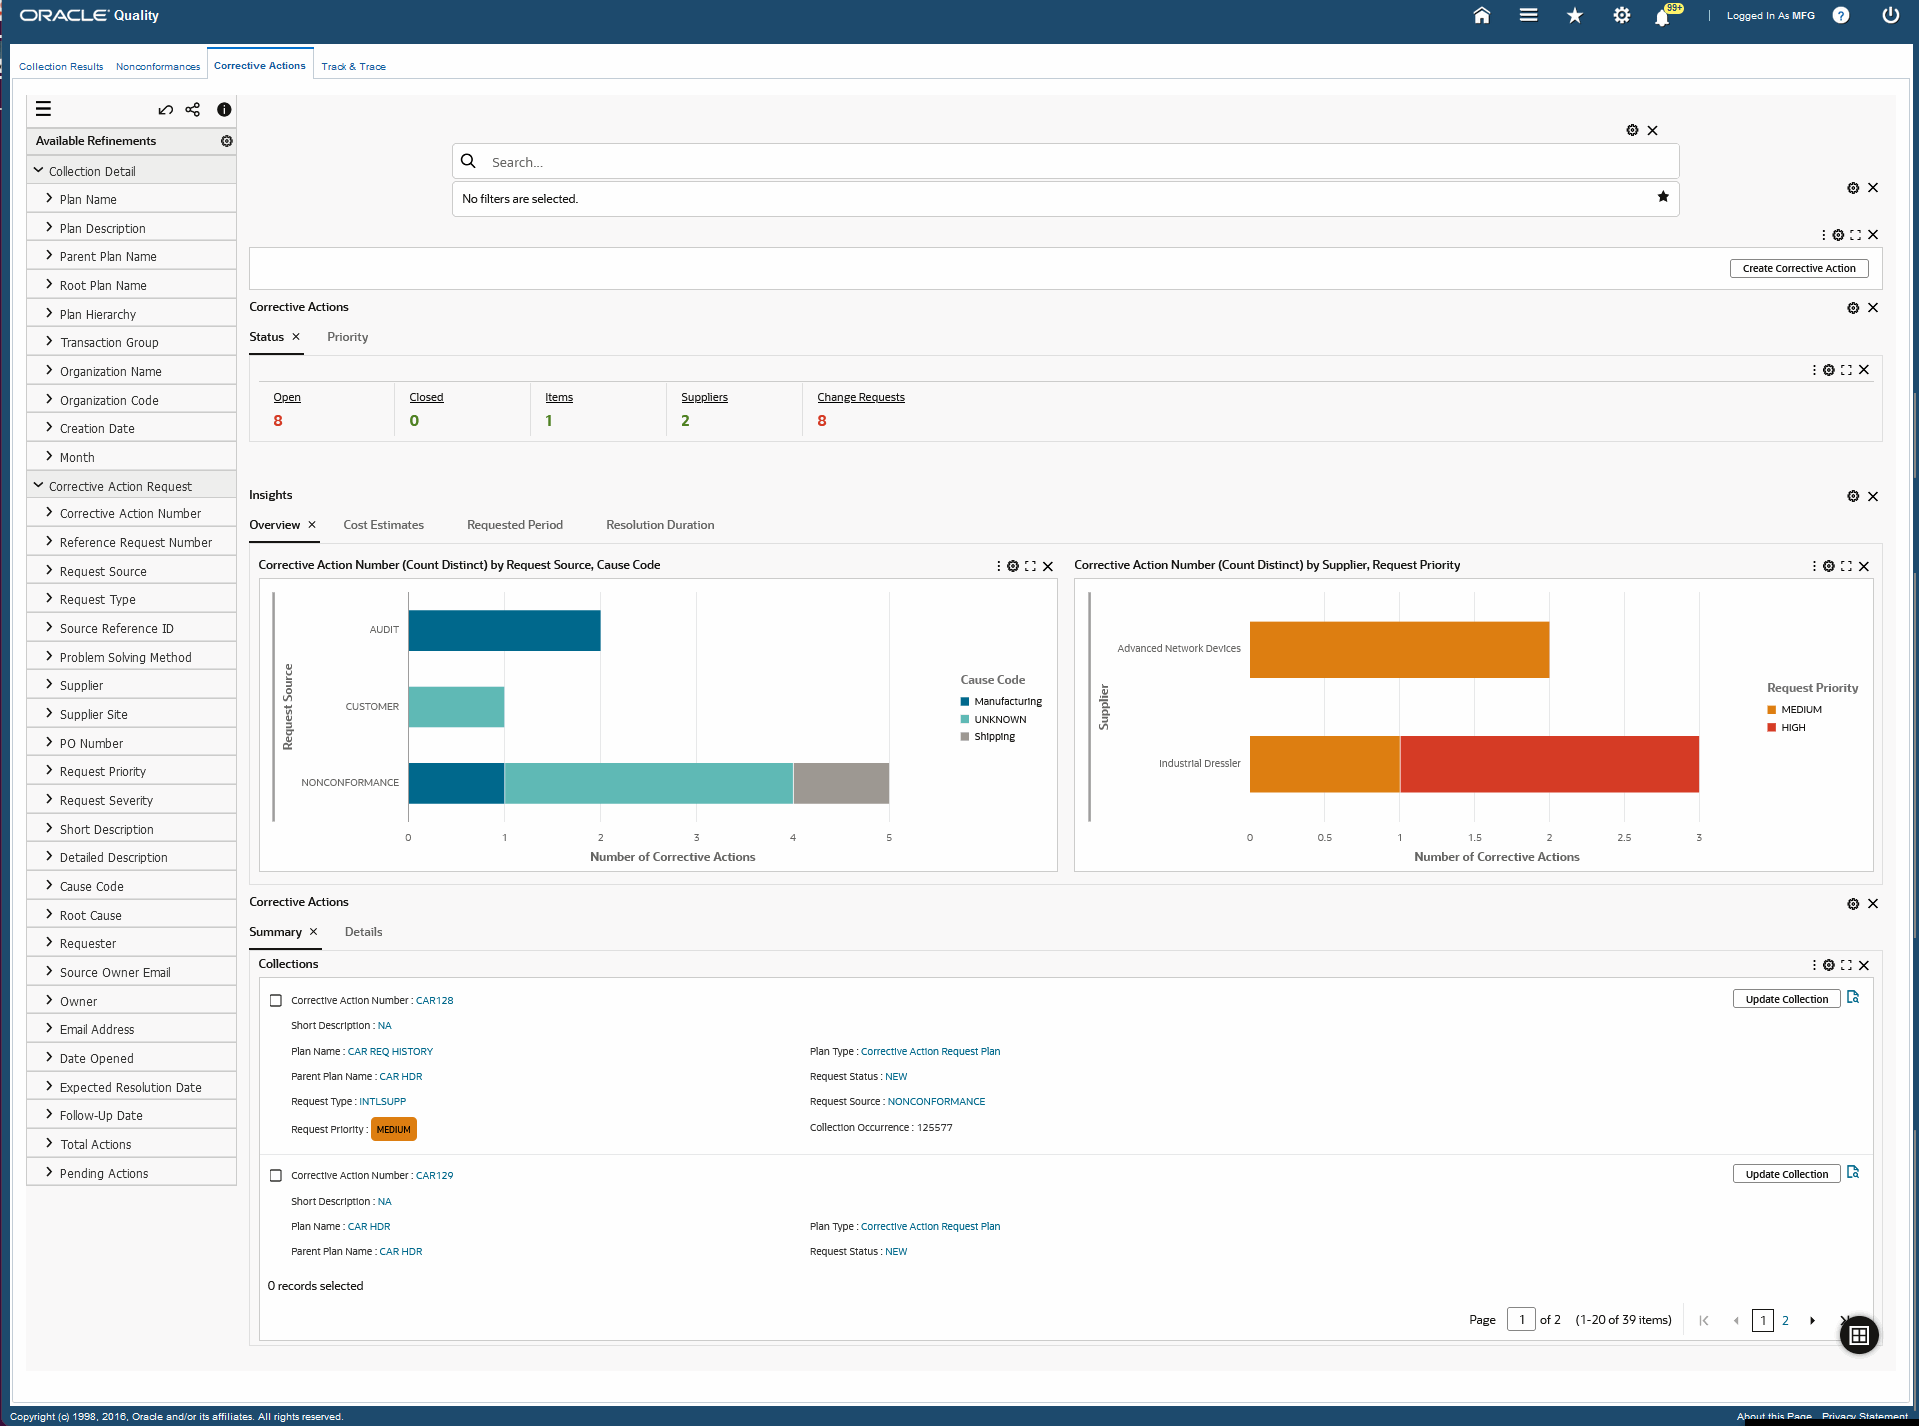
The following table describes the Corrective Actions dashboard components:
| Component |
Description |
| Create Corrective Action (button) |
To log a corrective action for a nonconformance, click Create Corrective Action to navigate to the Corrective Actions tab in the Quality Workbench. |
| Corrective Actions (tab layout) |
The Corrective Actions tab layout displays key metrics in the following tabs:
-
Status:
-
Open
This metric displays the number of open corrective actions.
-
Closed
This metric displays the number of closed corrective actions.
-
Item
This metric displays the number corrective actions for items.
-
Suppliers
This metric displays the number of supplier corrective actions.
-
Change Requests
This metric displays the number of change requests.
-
Priority:
-
High Priority
This metric displays the number of high priority corrective actions.
-
Medium Priority
This metric displays the number of medium priority corrective actions.
-
Low Priority
This metric displays the number of low priority corrective actions.
-
All Open High Priority Corrective Actions
This metric displays the number of high priority corrective actions that are open.
Click a metric to refine the information in the dashboard. |
| Insights (tab layout) |
The Insights tab layout provides corrective action information in charts that display in the following tabs:
-
Overview
This tab provides charts with overview information about logged corrective actions.
-
Cost Estimates
This tab provides charts on cost estimates for corrective actions that have been logged.
-
Requested Period
This tab provides charts on corrective actions logged for nonconformances within requested periods.
-
Resolution Duration
This tab provides charts on open and closed corrective actions.
You can refine the information that is displayed in the dashboard by clicking a data point on the charts and the dimension and metric value for a data point. |
| Overview (tab) |
The Overview tab displays the following charts:
-
Corrective Action Number (Count Distinct) by Item, Cause Code - This chart displays the number of corrective actions for items along with the cause codes. You can click the Options icon to select Cause Code, Root Cause, Standard Violated, Owner, Organization Code, or Problem Solving Method from the Dimension menu. Select Item, Request Type, Request Source, Request Severity, Request Priority, Request Status, or Owner from the Group Dimensions menu.
-
Corrective Action Number (Count Distinct) by Supplier, Request Priority - This chart displays the number of corrective actions by suppliers, and the request priority. You can click the Options icon to select Request Priority, Request Severity, Request Status, Standard Violated, Cause Code, or Root Cause from the Dimension menu. Select Supplier from the Group Dimensions menu.
|
| Cost Estimates (tab) |
The Cost Estimates tab displays the following charts:
-
Implementation Actual (Sum), Implementation Estimate (Sum) by Month - This chart displays actual and estimated cost implementation information for corrective actions.
-
Review Cost Estimate (Sum), Review Cost Actual (Sum) by Month - This chart displays review cost estimate and actual costs by month.
You can click the Options icon for each of the charts to select Month, Request Source, Request Priority, or Request Status from the Dimension menu. |
| Requested Period (tab) |
The Requested Period tab displays the following tag cloud and chart:
-
Corrective Action Number (Count Distinct) by Request Priority - This tag cloud displays the top ten corrective actions on basis of priority. The entities are displayed in relative sizes by frequency of occurrence. Click an entity in the tag cloud to filter the data in the dashboard. You can click the Options icon to select Request Priority, Request Severity, Request Source, Request Status, Request Type, or Owner from the Dimension menu.
-
Corrective Action Number (Count Distinct) by Month, Request Priority - This chart displays the number of corrective actions within specified months as well as priority. You can click the Options icon to select Request Priority, Request Severity, Request Source, Request Status, Request Type, or Owner from the Dimension menu. Select Month from the Group Dimensions menu.
|
| Resolution Duration (tab) |
The Resolution Duration tab displays the following charts:
-
Open Corrective Actions - This chart displays the number of days corrective actions are still open.
-
Closed Corrective Actions - This chart displays the number of days taken to resolve and close corrective actions.
Click the Options icon for each chart to select Cause Code or Item from the Dimension menu. From the Group Dimensions menu you can select Item, Cause Code, Request Type, Request Source, Request Severity, Request Priority, or Owner. |
| Results Tables (tab layout) |
The Corrective Actions dashboard results tables display information about collection plans under the following tabs:
-
Summary
Use this tab to view information about collection plans including corrective action number, short description, plan name, plan type, parent plan name, request type, request source, request priority, and collection occurrence.
Use the Update Collection button to update the information for a collection plan in the Quality Workbench.
-
Details
Use this tab to select and view collection results information based on the following options available from the drop-down list:
-
Collection Detail
-
Corrective Action Request
-
Custom Plan Elements
-
Correct Action Request Review
-
Supplier Corrective Action Response
-
CAR Actions Implementation
-
ECO Submission
-
Discrete Manufacturing Attributes
Click the link icon in the Network column for a corrective action number to view the Network View diagram in the Track & Trace dashboard. You can also select multiple corrective action numbers in the Details tab, and then select View Network from the Actions menu.
When you select Discrete Manufacturing Attributes, you can click the View Production Quality link in the Details tab for an item to navigate to the Production Quality dashboard of the Discrete Manufacturing Command Center.
Note: When you click the View Production Quality link for an item to navigate to the Production Quality dashboard, note that the dashboard retains the filters, and shows the same filtered data for the item and job (if information is available for the job).
Click the links in the table columns to refine the information available in the dashboard.
The following actions are available from the Options icon in the Corrective Actions dashboard tables:
|
See:
Track and Trace Dashboard
The Track & Trace dashboard provides quality inspectors, quality analysts, and quality managers visibility into the execution lifecycle of a nonconformance from when it is logged. You can track and trace quality related nonconformances, their disposition, and corrective actions using the Network View diagram. Use this diagram to perform backward and forward traceability across the transaction sources associated with nonconformances. You can use the traceability solution to audit the actions performed on a nonconformance, disposition, and corrective action. Use the Track & Trace dashboard to:
-
Track the progression of nonconformances, dispositions, and corrective action data entries.
-
Find hierarchical data collected across plans for jobs, purchase orders, service requests and so on.
-
Drill down to take action on a specific nonconformance or corrective action.
The Network View diagram displays the network relationship of the entity that you query. You can use the Search field to find a nonconformance, or corrective action number. You can also select from the available refinements for nonconformances, corrective actions, and collection results such as collection details, nonconformance masters, disposition headers, discrete manufacturing attributes, receiving attributes, and so on to filter the information that displays in the diagram. See the Quality Command Center Overview for more information.
From the Quality responsibility, navigate to the Track & Trace dashboard:
(N) Quality > Workbench > Quality Command Center > Track & Trace (tab)
Track & Trace Dashboard
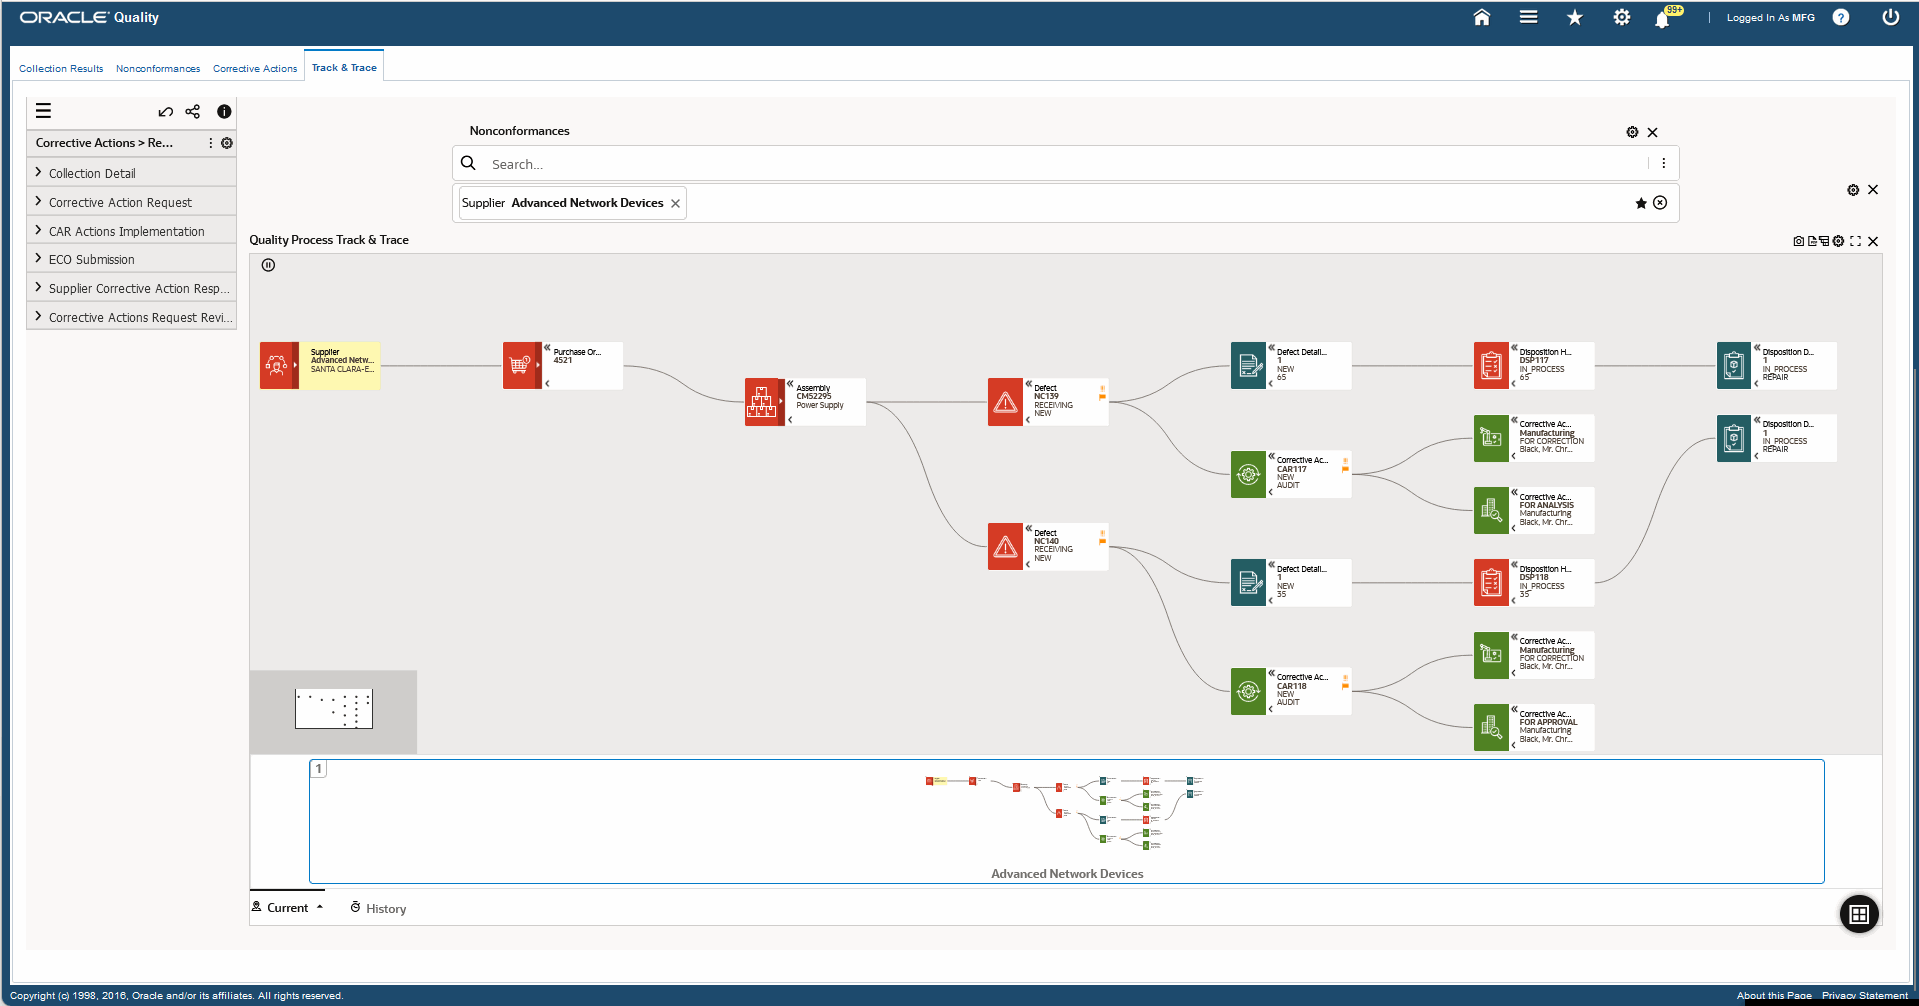
The following table describes the Track & Trace dashboard components:
| Component |
Description |
Network View (diagram)
Outstanding Receivables Dashboard |
This diagram displays the network details for the node you query or the refinements that you select. Right-click a node to select from the following options:
-
Make Anchor Node - Select this option to make a node the main node.
-
Show Adjacent Nodes - Select this option to expand a node to see its related nodes.
-
Highlight Path - Select this option to highlight the specific path of a node. You can right-click and select Unhighlight Path to remove highlighting a path.
-
Explore Node - Select this option to explore the node further.
-
Compare - Select multiple nodes and click Compare for a side-by-side comparison of the records of each selected node.
-
Show Details - Select this for a node to view details. On the Details window that opens, select multiple filters and then click Find Similar to apply these filters to the diagram.
Based on your search and selected refinements, the network diagram displays the following nodes:
-
Component Item - This node displays the component item, organization code, and component lot number. Click Show Details to view department, component revision, component UOM, component serial number, component subinventory, and component locator.
-
Work Order - This node displays information about the job, item and operation code. Click Show Details to view the from intraoperation step, department, to operation code, to operation sequence number, to intraoperation step, production line, line operation, component item, organization code, component lot number, component revision, component UOM, component serial number, component subinventory, and component locator.
-
Assembly - This node displays information about the item, item description, and job. Click Show Details to view operation code, from operation sequence number, from intraoperation step, department, to operation code, to operation sequence number, to intraoperation step, production line, and line operation.
-
Purchase Order - This node displays information about the purchase order number, PO receipt, and PO line number. Click Show Details to view the PO release number, PO shipment, and inspection result.
-
Supplier - This node displays information about the supplier, the supplier site, the approver supplier list (ALS). Click Show Details to view the supplier lot number.
-
Maintenance Work Order - This node displays information about the maintenance work order (WO), the asset number and asset group.
-
Asset - This node displays information about the asset number, maintenance WO, and asset group.
-
Asset Group - This node displays information about the asset group, asset number, and the maintenance WO.
-
Process Batch Number - This node displays the process batch number, lot number, and organization ID. Click Show Details to view process batch step number, process operation, process activity, process name, process parameter, process resource, and process step.
-
Defect - This node displays the nonconformance number, nonconformance source, and nonconformance status. Click Show Details to view the nonconformance type, nonconformance severity, nonconformance priority, transaction group, supplier, job, nonconforming quantity, noncomforming UOM, owner, date opened, days to close, item, component item, asset number, asset group, and asset serial number.
-
Defect Details- This node displays the nonconformance line number, nonconformance line status, and the quantity nonconforming. Click Show Details to view the nonconforming UOM, nonconformance number, owner, date opened, and the days to close.
-
Inventory Segregation - This node displays information about the item, subinventory, and the disposition status. Click Show Details to view the owner and nonconformance number.
-
WIP Segregation - This node displays information about the item, subinventory, and the disposition status. Click Show Details to view the owner and nonconformance number.
-
Corrective Action Header - This node displays the corrective action number, request status, and request source. Click Show Details to view the request severity, request type, request priority, requester, collection occurence, reference request number, source reference ID, standard violated, section violated, problem solving method, item, revision, supplier, supplier site, supplier lot number, PO number, PO line number, PO release number, PO shipment, PO receipt, and department. You can also view information about the cause code, root cause, systemic root cause, owner. View the date when the corrective action was opened, the expected resolution date, actual resolution date, and the follow-up date, approved by, approval date. Also displayed is the review cost estimate, review cost actual implementation estimate, implementation actual, days to close, service request, incident type, problem code, resolution code, item instance, and the corrective action cost
-
Corrective Action Review - This node displays the action type, cause code, and owner. Click Show Details to view the corrective action number.
-
Corrective Action Implementation - This node displays the cause code, implementation type, and owner. Click Show Details to implementation estimate, implementation actual, and corrective action number.
-
Supplier Corrective Action - This node displays the cause code, disposition status, and the supplier. Click Show Details to see the corrective action number.
-
Corrective Action ECO Submission - This node displays the ECO reason code, the ECO type, and implementation type. Click Show Details to see the corrective action number.
-
Disposition Header - This node displays the disposition number, disposition status, and the disposition quantity. Click Show Details to view the disposition UOM, disposition cost, disposition cost, dispostition owner, disposition source, source reference ID, source reference line ID, item, disposition, and disposition description.
-
Disposition Details - This node displays the disposition line number, disposition status, and disposition. Click Show Details to view information about the action type, action executed by, action assigned to, action executed, disposition source, source reference ID, source reference line ID, disposition number, item, disposition quantity, disposition UOM, disposition description, and disposition owner.
-
In-Process Disposition - This node displays the action type, action assigned to and disposition. Click Show Details to see the disposition action and disposition number.
-
Receiving-Related Dispositions - This node displays the action type, action assigned to and disposition. Click Show Details to see the disposition action and disposition number.
-
Inventory-Related Dispositions - This node displays the action type, action assigned to and disposition. Click Show Details to see the disposition action and disposition number.
The nodes also show color coded visual indicator icons for the following:
-
Priority - The node displays icons to quickly view if the priority for the nonconformance defect or request is low, medium, or high.
-
Severity - The node displays icons to quickly view if the severity for the nonconformance defect or request is low, medium, or high.
The following icons are available for the Network View diagram:
-
Export to Image - Export the Network View diagram information as image.
-
Export to PDF - Download and export the information in the PDF format.
-
Row Expander - View the information for nonconformance defect or corrective action in a hierarchical row format. To go back to the diagram view, click the Network Diagram icon.
|
See:


