Oracle Depot Repair Command Center
Depot Repair Command Center
Depot Repair Command Center Overview
You can use the Depot Repair Command Center to increase repair velocity while improving performance and quality. As depot managers and repair managers, you can ensure efficient and effective processing of the repair backlog and improve overall performance by analyzing data using Key Performance Indicators (KPIs), performance evaluation metrics, charts, graphs, and tables. Based on your role, the Depot Repair Command Center enables you to:
-
Eliminate bottlenecks and workload imbalances.
-
Analyze and reduce demand spikes.
-
Manage aging orders, holds and discrepancies.
-
Identify and analyze rework.
-
Anticipate the need for preventive or corrective action.
-
Monitor performance of individuals, teams, and organizations.
-
Monitor performance of third-party repair partners
In Oracle Depot Repair, the following Depot Command Center dashboards enable search functions using Enterprise Command Center integration:
-
Open Service Orders dashboard - Use this dashboard to ensure efficient processing of repairs, manage quality, initiate preventive or corrective actions, and prevent workload imbalances.
-
Resolved Service Orders dashboard - Use this dashboard to provide intelligence on the speed, quality and cost of past repairs.
-
My Service Orders dashboard - Use this dashboard to execute the highest priority work first and to resolve escalations, holds, and late and aging orders.
Note: You can use the Depot Repair Command Center only after the installation and common configurations are completed as described in My Oracle Support Knowledge Document 2495053.1, Installing Oracle Enterprise Command Center Framework, Release 12.2. For additional ECC overview information, see Overview of Oracle Enterprise Command Centers, Oracle E-Business Suite User's Guide
Searching Enterprise Command Center Dashboards
Use the sidebars to refine (filter) the data on each dashboard. You can select a value or record from the Available Refinements component, or use the Search field to find a keyword, a value, or a specific record. The type-ahead feature suggests matches for your entry that correspond to the available refinements. When you submit a search, the search term is added to the Selected Refinements list, and the dashboard data is refined to include only records that match the search. You can add multiple refinements and remove any of them at any time. Use Saved Search to create and save your search. You can edit, delete, or refer to this saved search. You can also search using Descriptive Flexfield (DFF) attributes. For a list of Depot Repair Command Center flexfields, refer to the "Configuring Descriptive Flexfields for Search" section, in the chapter "Oracle Depot Repair Command Center Setup", Oracle Depot Repair Implementation Guide.
Use an asterisk (*) or a percent sign (%) to perform a partial keyword or record search that matches any string of zero or more characters. You can also use a question mark (?) to perform a partial search that matches any single character.
For more information about searching for and refining data in enterprise command centers, see "Overview of Enterprise Command Centers" in Oracle E-Business Suite User's Guide.
Additional Information: For more information about searching for and refining data in Oracle Enterprise Command Centers, see "Search" under Highlights of an Enterprise Command Center, Oracle E-Business Suite User's Guide.
Open Service Orders Dashboard
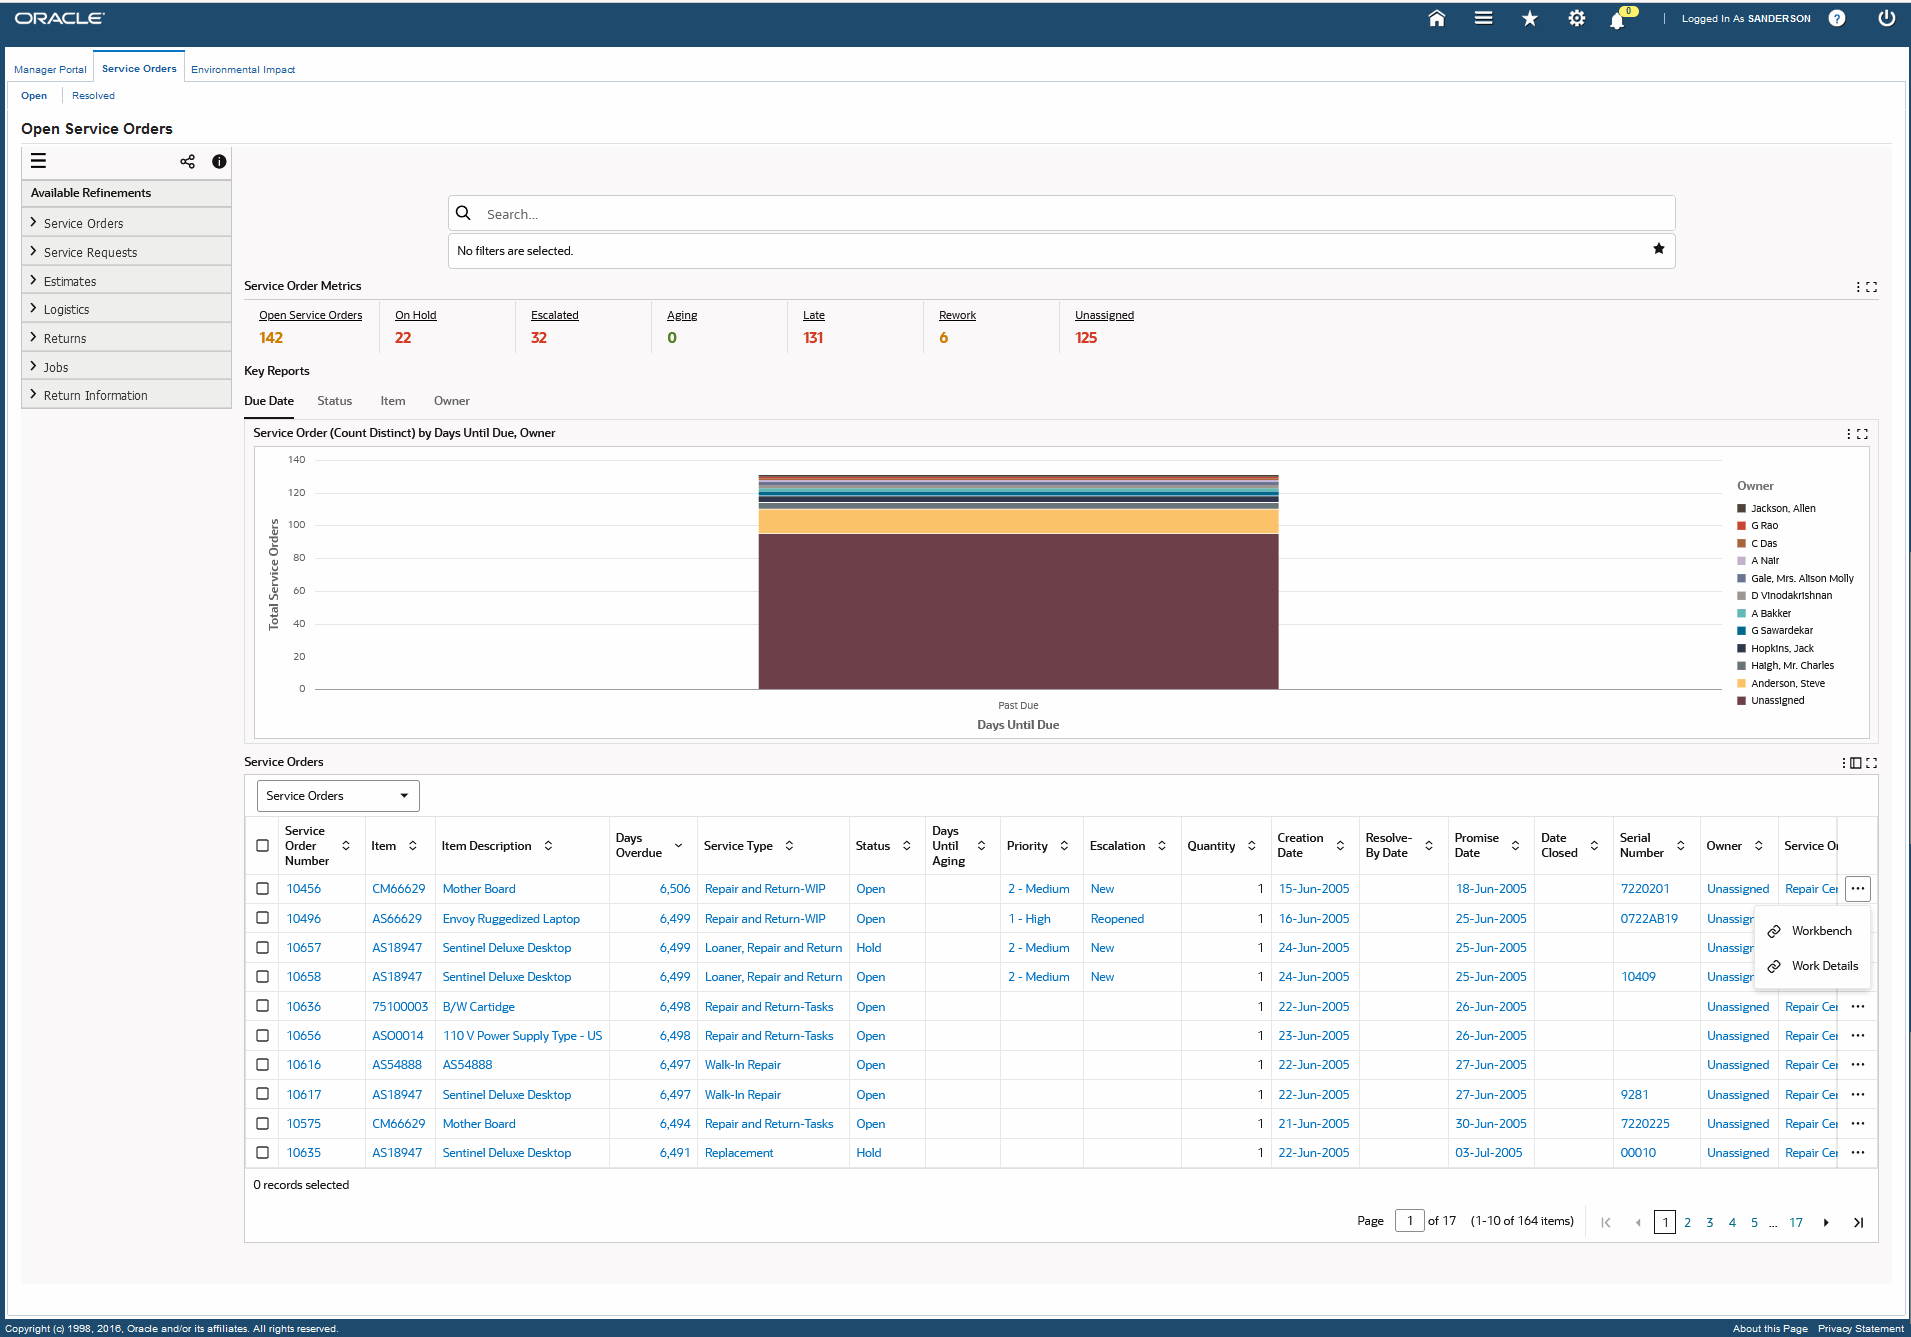
The Open Service Orders dashboard enables you to streamline open orders to deal with current high-impact issues that require immediate resolution and to gather intelligence to analyze data. Use the dashboard to view open, escalated, aging, late, on-hold, rework, and unassigned orders. You can refine the information that is displayed in the dashboard by clicking the metrics, alerts, and portions of the graphs. Using available refinements like service orders, service requests, estimates, actuals, logistics, returns, jobs, carrier, and processor, you can view specific information on the dashboard. See the Depot Repair Command Center Overview for more information.
From the Depot Repair Manager responsibility, navigate to the Open Service Orders dashboard:
(N) Depot Repair > Service Manager Portal > Service Orders (tab) > Open (tab)
Within the Open Service Orders dashboard, you can analyze the data and review item metrics, charts, and tables.
Open Service Orders Dashboard

The following table describes the Open Service Orders dashboard components:
| Components | Description |
|---|---|
| Service Orders Metrics (summary bar) | The Service Orders Metrics (summary bar) displays the following key metrics:
Click a metric to refine the information in the dashboard. |
| Key Reports (tab layout) | The Key Reports tab layout provides charts that summarize open service orders information in the following tabs:
You can refine the displayed data by clicking the data point on a chart and the dimension and metric value for a data point. |
| Due Date (tab) | The Service Order (Count Distinct) by Days Until Due, Owner chart displays information about total service orders, the owners and days until they are due. Click the Options icon to select Owner, Service Org, Inventory Org, or Status from the Dimension menu. Days Until Due is the available option in the Group Dimensions menu. |
| Status (tab) | The Service Order (Count Distinct) by Status, Owner chart displays information about total service orders by status and owner. Click the Options icon to select Owner, Service Org, Inventory Org, or Status from the Dimension menu. Status is the available option in the Group Dimensions menu. |
| Item (tab) | The Service Order (Count Distinct) by Item, Owner chart displays information about total service orders by items ordered and by owner. Click the Options icon to select Owner, Service Org, Inventory Org, or Status from the Dimension menu. Item is the available option in the Group Dimensions menu. |
| Owner (tab) | The Service Order (Count Distinct) by Owner, Status chart displays information about total service orders by owner and status. Click the Options icon to select Status or Days Until Due from the Dimension menu. Select Owner, Service Org, or Inventory Org from the Group Dimensions menu. |
| Results Tables (tab layout) | This Open Service Orders results table shows all service order details that meet the current refinements. You can view subsets of the open service order details by selecting from the following options available from the drop-down list:
Click on the links in the results tables columns to refine the information available in the dashboard. Click the Service Order Number link to navigate to the Service Order page. On the results table, click the Actions icon for a service order number, and select from the following:
You can select to perform the following actions available from the Options icon in the Open Service Orders dashboard results tables:
|
Resolved Service Orders Dashboard
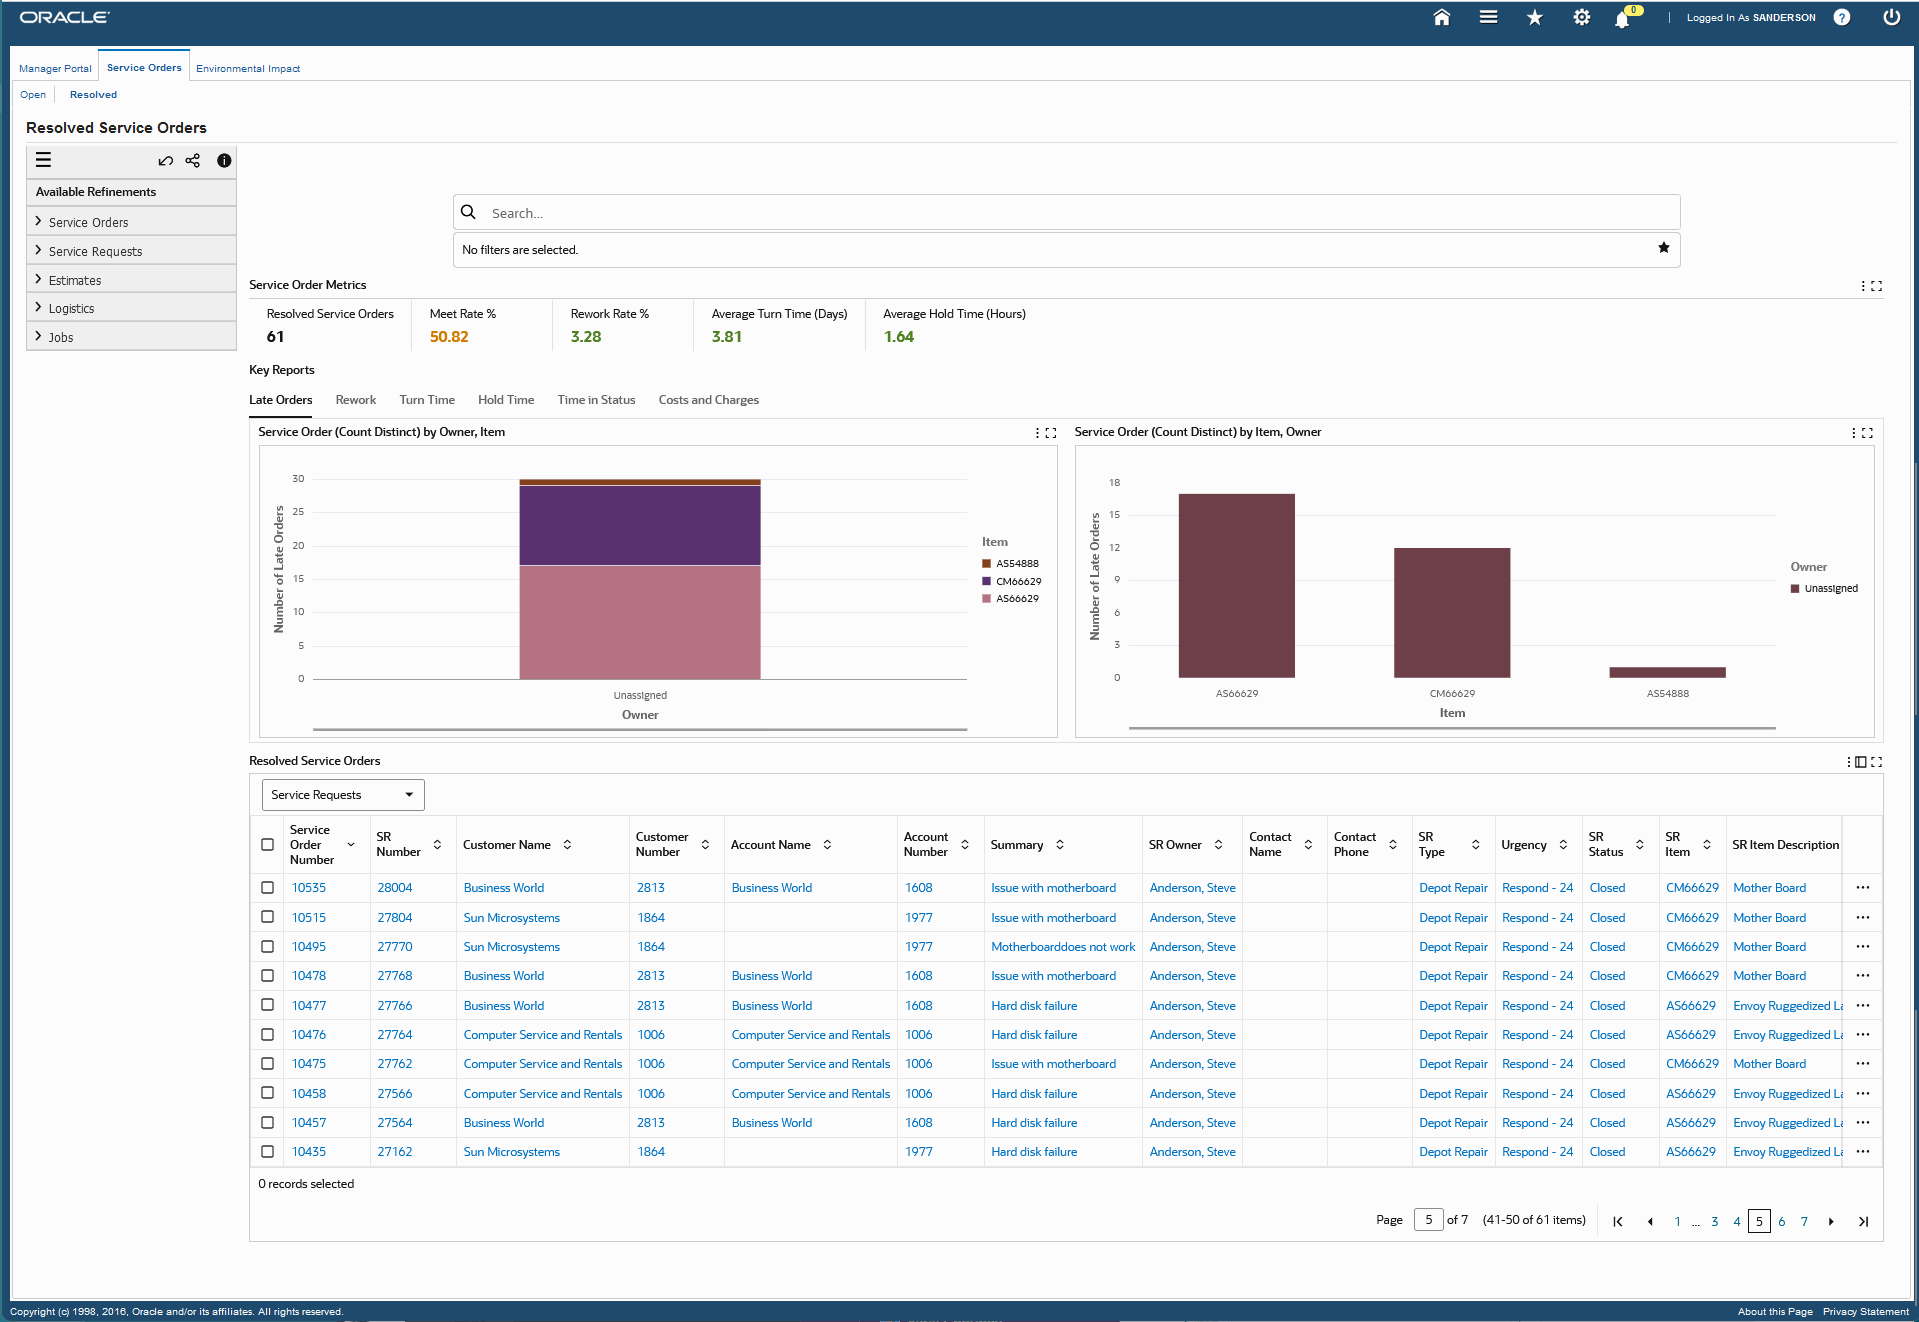
The Resolved Service Orders dashboard provides intelligence on the speed, quality, and cost of past repairs. This dashboard enables depot repair managers to investigate and document where and why there were bottlenecks and workload imbalances; holds, late orders and demand spikes; quality issues and rework; and extraordinary costs or profits. Use this dashboard to create supporting documentation to assess and reward performance, as well as create documentation for warranty claims, service level agreements (SLAs), and regulatory compliance. You can refine the information that is displayed in the dashboard by clicking the metrics, alerts and portions of the graphs. Using available refinements like service orders, service requests, estimates, actuals, logistics, returns, jobs, carrier, and processor, you can view specific information on the dashboard. See the Depot Repair Command Center Overview for more information.
From the Depot Repair Manager responsibility, navigate to the Resolved Service Orders dashboard:
(N) Depot Repair > Service Manager Portal > Service Orders (tab) > Resolved (tab)
Resolved Service Orders Dashboard

The following table describes the Resolved Service Orders dashboard components:
| Components | Description |
|---|---|
| Service Orders Metrics (summary bar) | The Service Orders Metrics (summary bar) displays the following key metrics for resolved service orders:
Click a metric to refine the information in the dashboard. |
| Key Reports (tab layout) | The Key Reports tab layout provides charts that summarize resolved service orders information in the following tabs:
You can refine the displayed data by clicking the data point on a chart and the dimension and metric value for a data point. |
| Late Orders (tab) | The Service Orders (Distinct Count) by Owner, Item chart displays information about the number of late orders, owners, and item. Click the Options icon to select Owner, Service Org, Inventory Org, Operating Unit, Item, or Item Description from the Dimension menu and the Group Dimensions menu. The Service Orders (Distinct Count) by Item, Owner chart displays the number of late orders on basis of items. Click the Options icon to select Owner, Service Org, Inventory Org, or Operating Unit from the Dimension menu. Select Item, or Item Description from the Group Dimensions menu. |
| Rework (tab) | The Service Orders (Distinct Count) by Owner, Item chart displays information about the number of rework orders, owners, and item. Click the Options icon to select Item or Item Description from the Dimension menu. Select Owner, Service Org, Inventory Org, or Operating Unit from the Group Dimensions menu. The Service Orders (Distinct Count) by Item, Owner chart displays the number of rework orders on basis of items. Click the Options icon to select Item or Item Description from the Dimension menu. Select Owner, Service Org, Inventory Org, or Operating Unit from the Group Dimensions menu. |
| Turn Time (tab) | The Turn Time (Average) by Owner chart displays information about the average turn time in days for resolved service orders and the owner details. The Turn Time (Average) by Item chart displays information about the average turn time in days for resolved service orders and the item details. Click the Options icon to select Item, Item Description, Owner, Service Org, Inventory Org, or Operating Unit from the Dimension menu for both charts. |
| Hold Time (tab) | The Time in Status (Average) by Owner chart displays information about the average hold time in days for resolved service orders and the owner details. The Time in Status (Average) by Item chart displays information about the average hold time in days for resolved service orders and the item details. Click the Options icon to select Item, Item Description, Owner, Service Org, Inventory Org, or Operating Unit from the Dimension menu for both charts. |
| Time in Status (tab) | The Time in Status (Average) by Time in Status chart displays information about the average time in status in hours for resolved service orders and the status details like open, closed, and so on. |
| Costs and Charges (tab) | The Total Cost (Sum) Charges (Sum) by Day Closed chart displays information about he total cost and charges for resolved service orders on basis of days the service orders were closed. Click the Options icon to select Days Closed, Week Closed, Month Closed, Quarter Closed, or Year Closed from the Dimension menu. The Total Cost (Sum) Charges (Sum) by Item chart displays information about the total cost and charges for resolved service orders on basis of items. Click the Options icon to select Item, Item Description, Return Type, or Account Name from the Dimension menu. |
| Results Tables (tab layout) | The Resolved Service Orders results table shows all service order details that meet the current refinements. You can view subsets of the resolved service order details by selecting from the following options available from the drop-down list:
Click on the links in the results tables columns to refine the information available in the dashboard. Click the Service Order Number link to navigate to the Service Order page. On the results table, click the Actions icon for a service order number, and select from the following:
You can select to perform the following actions available from the Options icon in the Open Service Orders dashboard results tables:
|
My Service Orders Dashboard
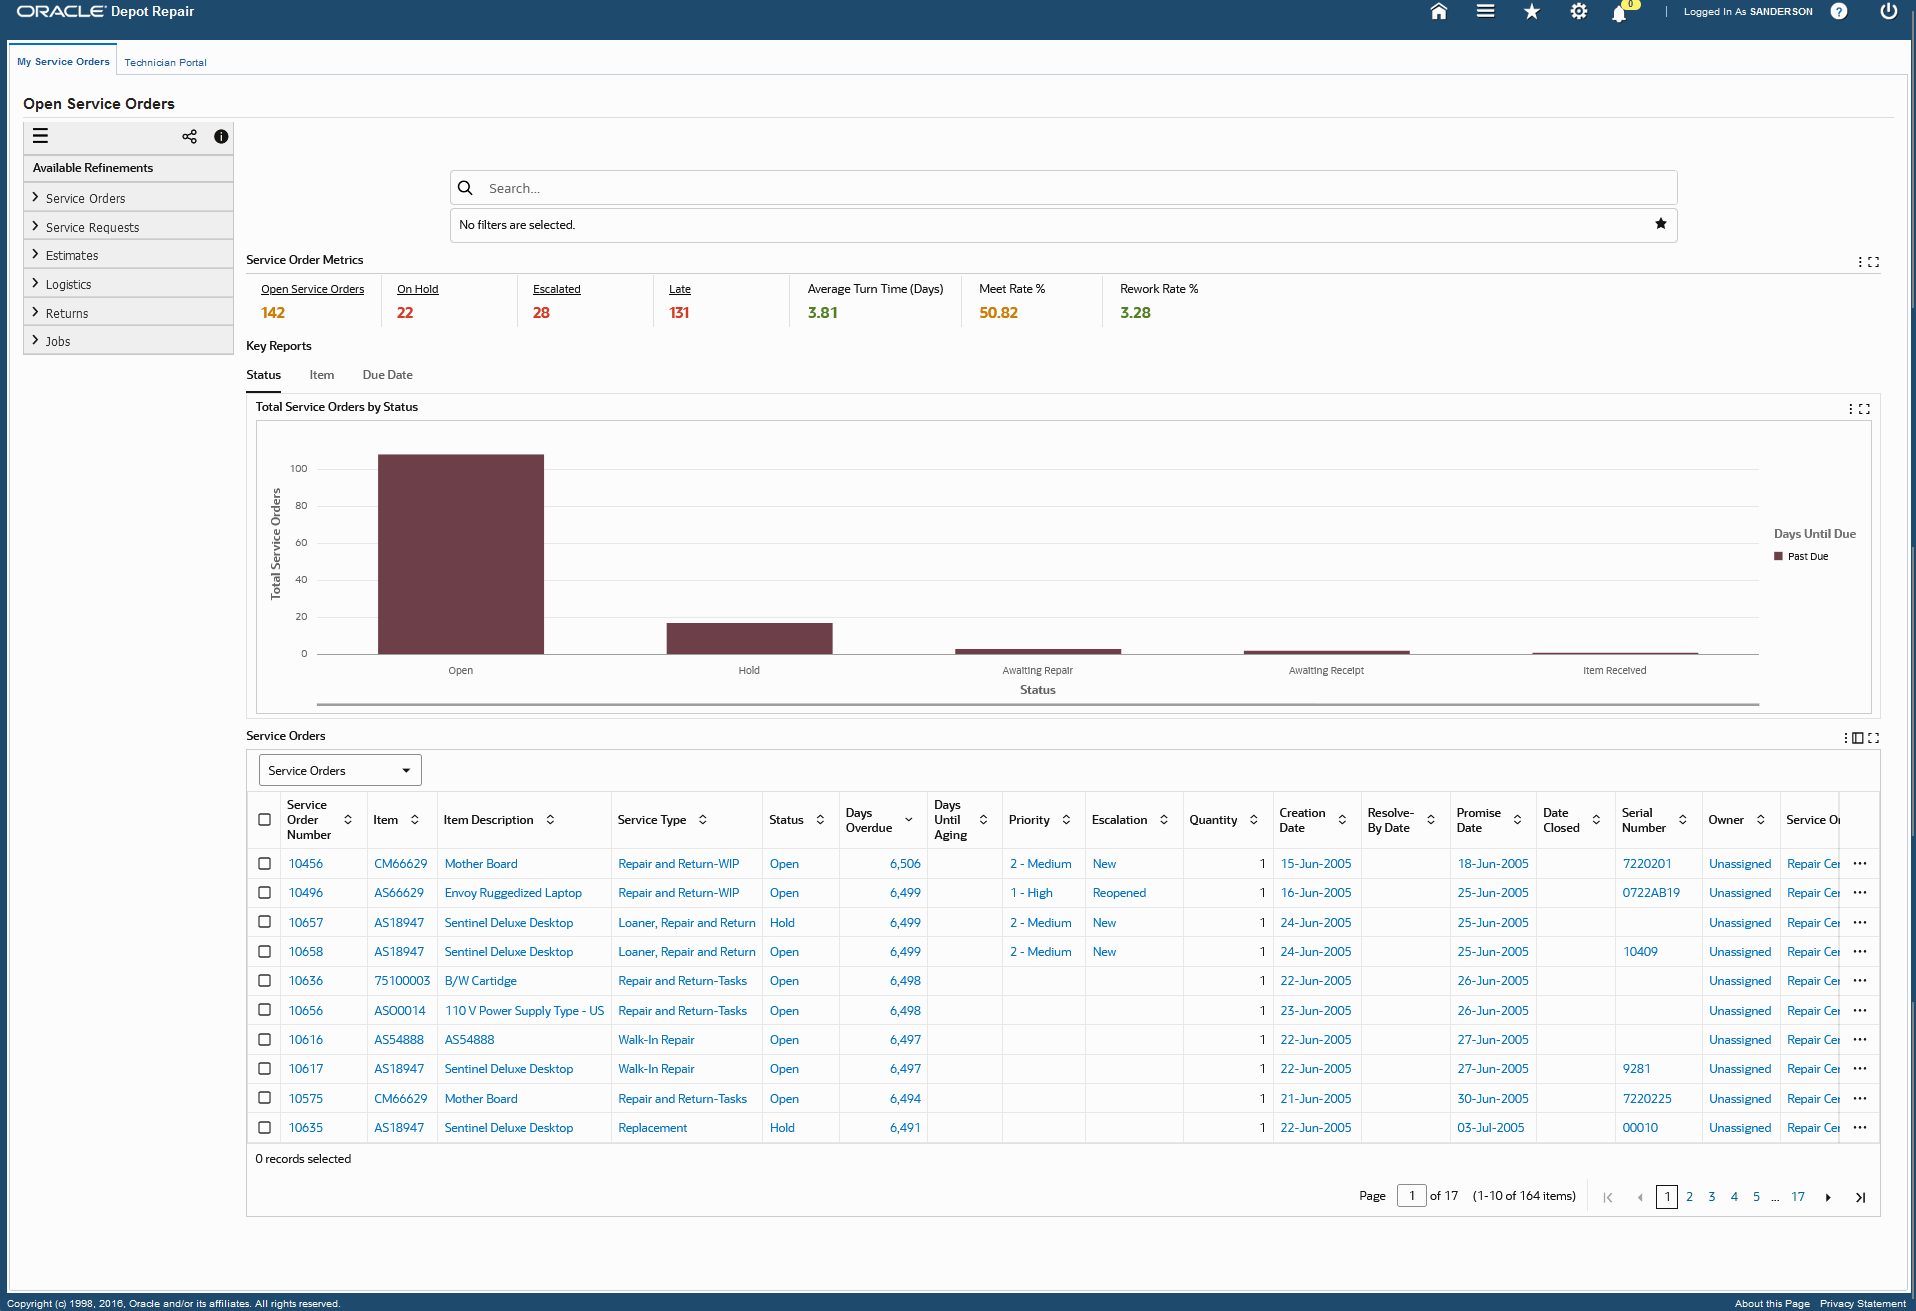
The My Service Orders dashboard helps to ensure efficient and effective processing of the repair backlog. Repair managers can execute the highest priority work first, and resolve escalations, holds, late and aging orders. This dashboard helps to continuously improve speed and quality in the repair processes. You can refine the information that is displayed in the dashboard by clicking the metrics, alerts, and portions of the graphs. Using available refinements like service orders, service requests, estimates, actuals, logistics, returns, and jobs, you can view specific information on the dashboard. See the Depot Repair Command Center Overview for more information.
From the Depot Repair Manager responsibility, navigate to the My Service Orders dashboard:
(N) Depot Repair > Technician Portal > My Service Orders (tab)
My Service Orders Dashboard

The following table describes the My Service Orders dashboard components:
| Components | Description |
|---|---|
| Service Orders Metrics (summary bar) | The Service Orders Metrics (summary bar) displays the following key metrics for your service orders:
Click a metric to refine the information in the dashboard. |
| Key Reports (tab layout) | The Key Reports tab layout provides charts that summarize your service order information in the following tabs:
You can refine the displayed data by clicking the data point on a chart and the dimension and metric value for a data point. |
| Status (tab) | The Total Service Orders by Status chart displays total service order information by status and days until due. Click the Options icon to select Days Until Due, Item or Customer Name from the Dimension menu. Status is the available option in the Group Dimensions menu. |
| Item (tab) | The Total Service Orders by Item chart chart displays total service order information by item and status. Click the Options icon to select Status, Days Until Due, or Customer Name from the Dimension menu. Item is the available option in the Group Dimensions menu. |
| Due Date (tab) | The Total Service Orders by Days Until Due Date chart displays total service order information by days until due and the inventory organization name. Click the Options icon to select Inventory Org, Status, Item, Days Until Due, or Customer Name from the Dimension menu. Days Until Due is the available option in the Group Dimensions menu. |
| Results Tables (tab layout) | The My Service Orders results table shows all service order details that meet the current refinements. You can view subsets of the resolved service order details by selecting from the following options available from the drop-down list:
Click on the links in the results tables columns to refine the information available in the dashboard. Click the Service Order Number link to navigate to the Service Order page. On the results table, click the Actions icon for a service order number, and select from the following:
You can select to perform the following actions available from the Options icon in the My Service Orders dashboard results tables:
|