Oracle Service Command Center
This chapter covers the following topics:
Service Command Center
Overview
The Oracle Service Command Center presents service managers and agents with an integrated view of service request data. You can use key metrics, drillable graphs, and tag clouds to gain insight into request and charge data to diagnose issues and perform efficient and effective corrective actions on related service requests to improve your operational and process efficiency.
Use the Service Command Center to:
-
Deliver timely service:
-
Act on service requests and tasks with SLA risks
-
Prioritize escalated and high priority requests
-
-
Remove bottlenecks and balance workloads:
-
Identify unassigned service requests
-
Distribute workload to individuals and groups
-
-
Expedite service billing:
-
Progress stalled charge lines for invoicing
-
Get insights into service profitability for charges
-
The Service Command Center includes the following dashboards:
-
Agent Dashboard: Use this dashboard to identify service requests that require your immediate attention and to perform actions on those service requests. See the Agent Dashboard for more information.
-
Manager Dashboard: Use this dashboard to get a high-level view of the overall performance of your service organization. See the Manager Dashboard for more information.
-
Service History Dashboard: Use this dashboard to view relationships between customer, product and the service request resolution process. See the Service History Dashboard for more information.
-
Charges Dashboard: Use this dashboard to expedite service billing and to get insights into service profitability, See the Charges Dashboard for more information.
Note: You can use the Service Contracts Command Center only after the installation and common configurations are completed as described in My Oracle Support Knowledge Document 2495053.1, Installing Oracle Enterprise Command Center Framework, Release 12.2. For additional ECC Overview information, see Overview of Oracle Enterprise Command Center Framework, Oracle E-Business Suite User's Guide.
Searching Enterprise Command Center Dashboards
Use the dashboard sidebar to refine (filter) the data on each dashboard. You can also Search using a keyword, value, or a specific record. The type-ahead feature suggests matches for your entry that correspond to the selected data set. When you submit a search, the search term is added to the Selected Refinements list, and the dashboard data is refined to include only records that match the search. You can add multiple refinements and remove any of them at any time. Using Saved Searches, you can create and save your searches and refer to them later. You can also edit and delete saved searches.
Use an asterisk (*) or percent sign (%) to perform a partial keyword or record search that matches any string of zero or more characters. You can also use a question mark (?) to perform a partial search that matches any single character.
Additional Information: For more information about searching for and refining data in enterprise command centers, see Search in Highlights of an Enterprise Command Center, Oracle E-Business Suite User's Guide.
Agent Dashboard
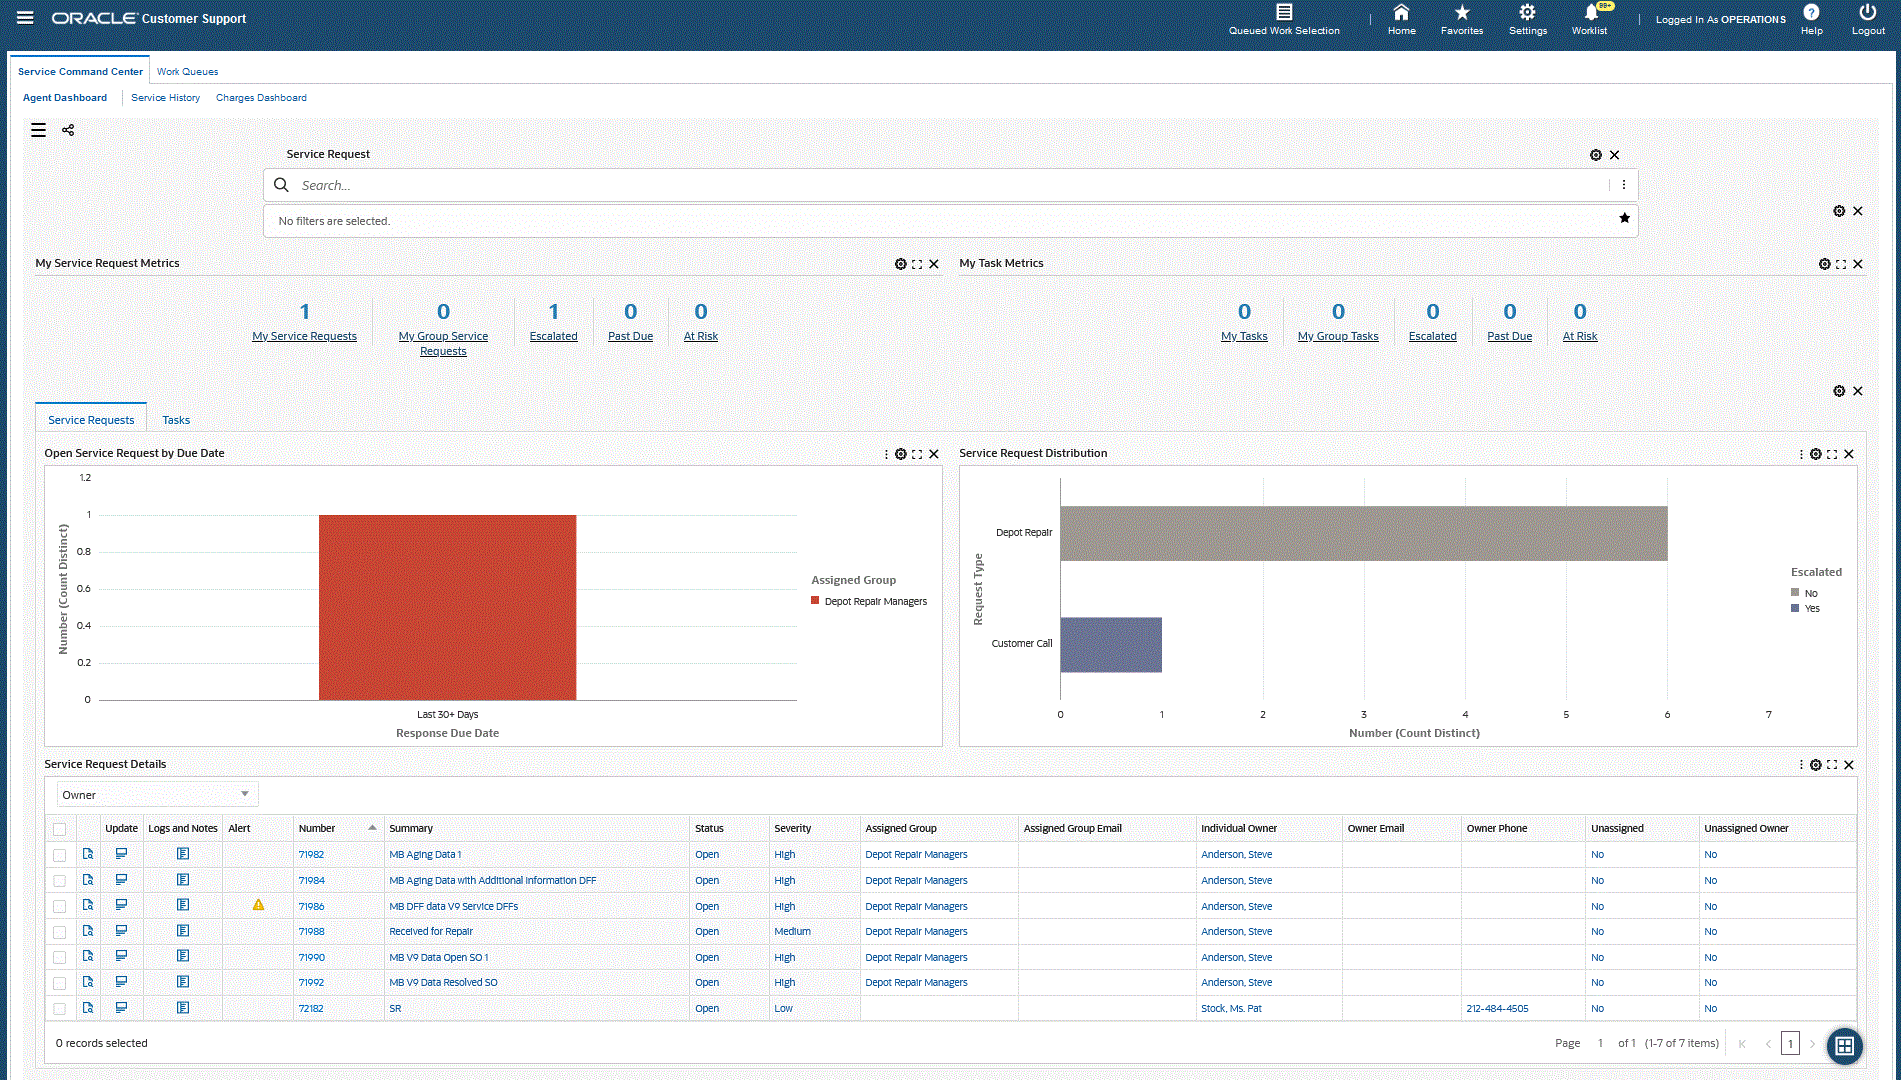
The Agent Dashboard identifies service requests that require immediate attention and enables you to perform actions on those service requests. You can research past issues to quickly resolve current service requests.
Use the dashboard to:
-
Search for service requests using notes keywords. You can search using note attributes such as Note Status and Note Type, Source Type, Service Request Notes, and Task Notes.
-
View service requests and service tasks metrics.
-
View agent work bins.
-
Use in-memory search functionality with near real-time data.
-
Perform daily transactions of service tier 2 agents.
-
Work with service tasks.
-
View and update charges and charge line details.
The dashboard also enables you to eliminate service-level agreements (SLA) compliance risks by:
-
Identifying service requests with potential SLA compliance risks
-
Identifying tasks that cause resolution delays
-
Quickly identifying escalated and high-priority service requests
Access the Agent Dashboard using the following navigation:
(N) Customer Support Specialist responsibility > Customer Support > Agent Dashboard
Agent Dashboard
Update Service Request Dialog Box

The following table describes the Agent Dashboard:
| Component | Description |
|---|---|
| Service Request (search box) | Users can enter notes keywords in the Service Request Search box. You can search using keywords in both service request notes and task notes that return a list of service requests that match the criteria. |
| My Service Requests Metrics (summary bar) | This summary bar contains the following key metrics:
|
| My Task Metrics (summary bar) | This summary bar contains the following key metrics:
|
| Service Requests (tab) | This tab includes the following charts:
|
| Service Request Details (results table) | This results table shows attributes pertaining to service requests details. From the drop-down list, you can select views to show service request details by:
You can perform the following row-level actions:
The following actions are available from the Options icon in this results table.
|
| Tasks (tab) | This tab includes the following charts:
|
| Task Details (results table) | This results table shows attributes pertaining to service tasks details. From the drop-down list, you can select views to show service task details by:
You can perform the following row-level actions:
The following actions are available from the Options icon in the results tables for this tab.
|
To create and update service requests, click the Work Queues tab and navigate to the Agent Dashboard page. To perform specific actions directly from the dashboard, click links associated with a specific service request in the results table to navigate to the Update Service Requests page. Use this page to update service request details.
Note: The application automatically updates service request information on the dashboard when you use the Update Service Request option.
Manager Dashboard
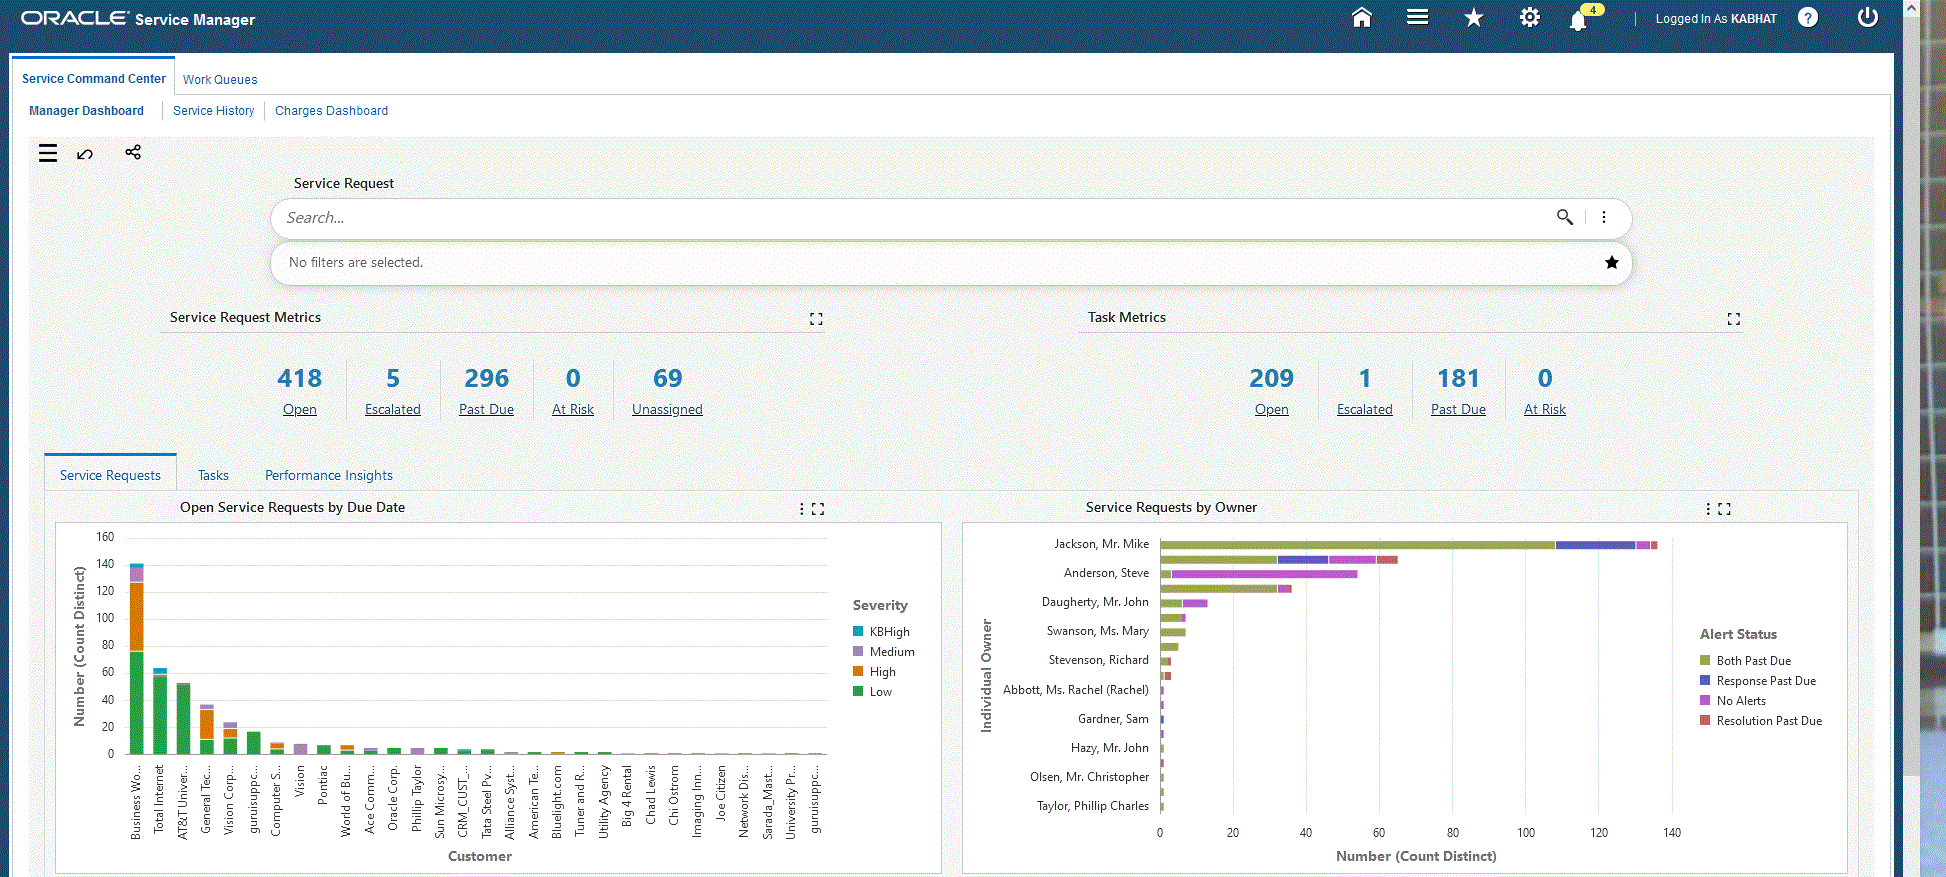
As a service manager, use the Manager Dashboard to identify service requests that require your immediate attention and to perform corrective actions on those service requests. This dashboard provides a high-level view of the overall performance of your service organization, and helps you to manage daily activities and take strategic decisions such as load balancing the outstanding work, focusing on specific customer issues, and tracking critical service information for top records.
The dashboard enables you to:
-
Ensure service-level agreements (SLA) compliance and improve customer satisfaction by:
-
Identifying service requests with potential SLA compliance risks in advance.
-
Identifying tasks that may cause resolution delays.
-
Rebalancing workloads to meet SLA dates and requirements.
-
Identifying customers that need special attention.
-
-
Prioritize service requests by:
-
Quickly identifying escalated and high-priority service requests.
-
Rebalancing the workload to ensure that agents are working on high-priority items.
-
Gaining insight on best customers, tracking items with the most service requests, and addressing critical issues.
-
-
Identify bottlenecks and take corrective actions by:
-
Ensuring that the workload is optimized.
-
Ensuring that the proper resource is working on high priority issues.
-
Manager Dashboard
Update Service Request Dialog Box

Access the Manager Dashboard using the following navigation:
Service Manager responsibility > Manager Dashboard
The following table describes the dashboard:
| Component | Description |
|---|---|
| Service Requests Metrics (summary bar) | This summary bar contains the following key metrics:
|
| Task Metrics (summary bar) | This summary bar contains the following key metrics:
|
| Service Requests (tab) | This tab contains the following charts:
|
| Service Request Details (results table) | This results table displays attributes pertaining to open service requests details. From the drop-down list, you can select views to display Service Request Details by attributes such as owner, problem, product, and so on. You can perform the following row-level actions:
The following actions are available from the Options icon in this results table:
|
| Tasks (tab) | This tab contains the following charts:
|
| Task Details (results table) | This results table shows attributes pertaining to open service tasks details. You can perform the following row-level actions:
The following actions are available from the Options icon in the results tables for this tab.
|
| Performance Insights (tab) | This tab contains the following charts:
To export charts as an image or in a comma-separated values (CSV) file format, click the Options icon in the charts. |
To create and update service requests, click the Work Queues tab and navigate to the Agent Dashboard page. To perform specific actions directly from the dashboard, click links associated with a specific service request in the results table to navigate to the Update Service Requests page. Use this page to update service request details.
Note: The application automatically updates service request information on the dashboard when you use the Update Service Request option.
Service History Dashboard
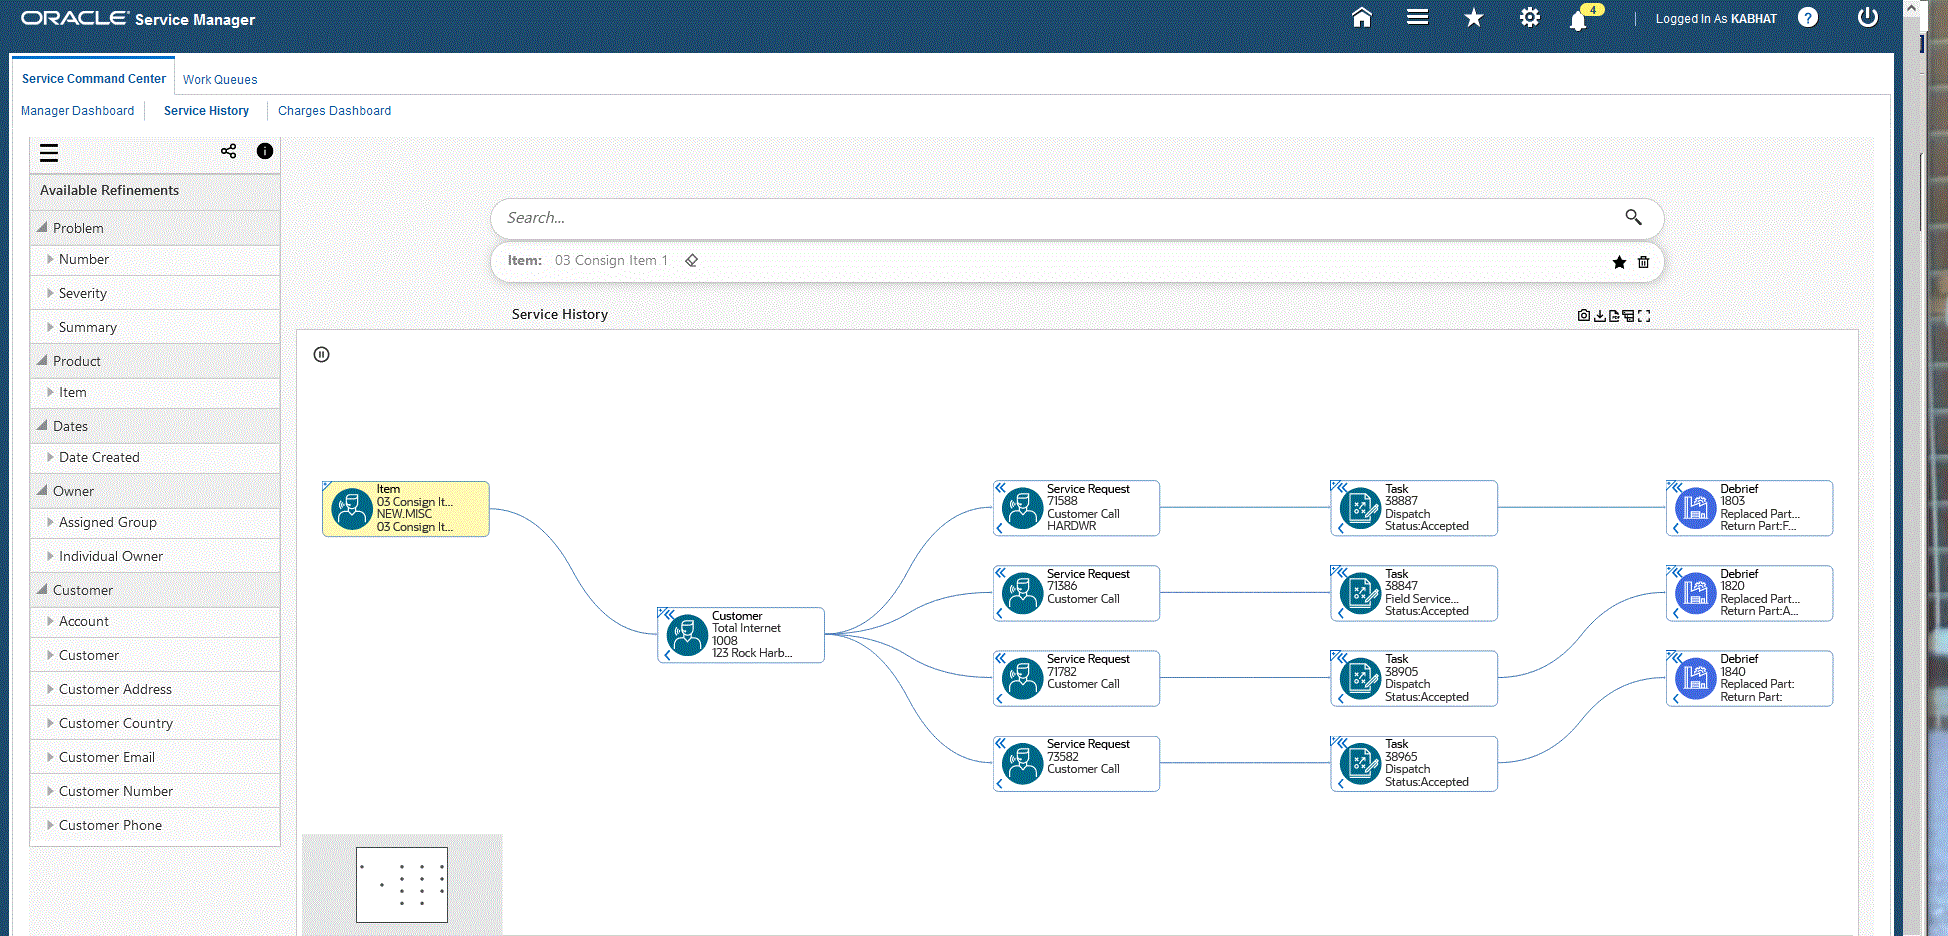
The Service History Dashboard diagram can be used by service managers and customer support specialists to view relationships among data sets. You can use this dashboard to display relationships between customer, product, and the service request resolution process. You can also perform Specific EBS actions to expedite the service resolution process.
Use the dashboard to:
-
Identify past service requests for specific customers or products.
-
Understand the details of parts used or the work completed to resolve specific service request types or issues.
-
Visually identify potential causes of service delays for high priority service requests.
From the Service Manager or Customer Support Specialist responsibility, navigate to the Service History Dashboard:
(N) Service Manager > Service History
(N) Customer Support Specialist > Service History
Service History Dashboard
The following actions are available for each dataset. Right click on each node to display available actions.
| Action | Nodes | Description |
|---|---|---|
| View Notes |
|
Click this action link to view existing notes on the data sets. |
| Create Note |
|
Click this action link to create notes on the data sets. |
| Service Request Links | Service Request | Click this action link to create and view existing service request links for the Service Request. |
Charges Dashboard
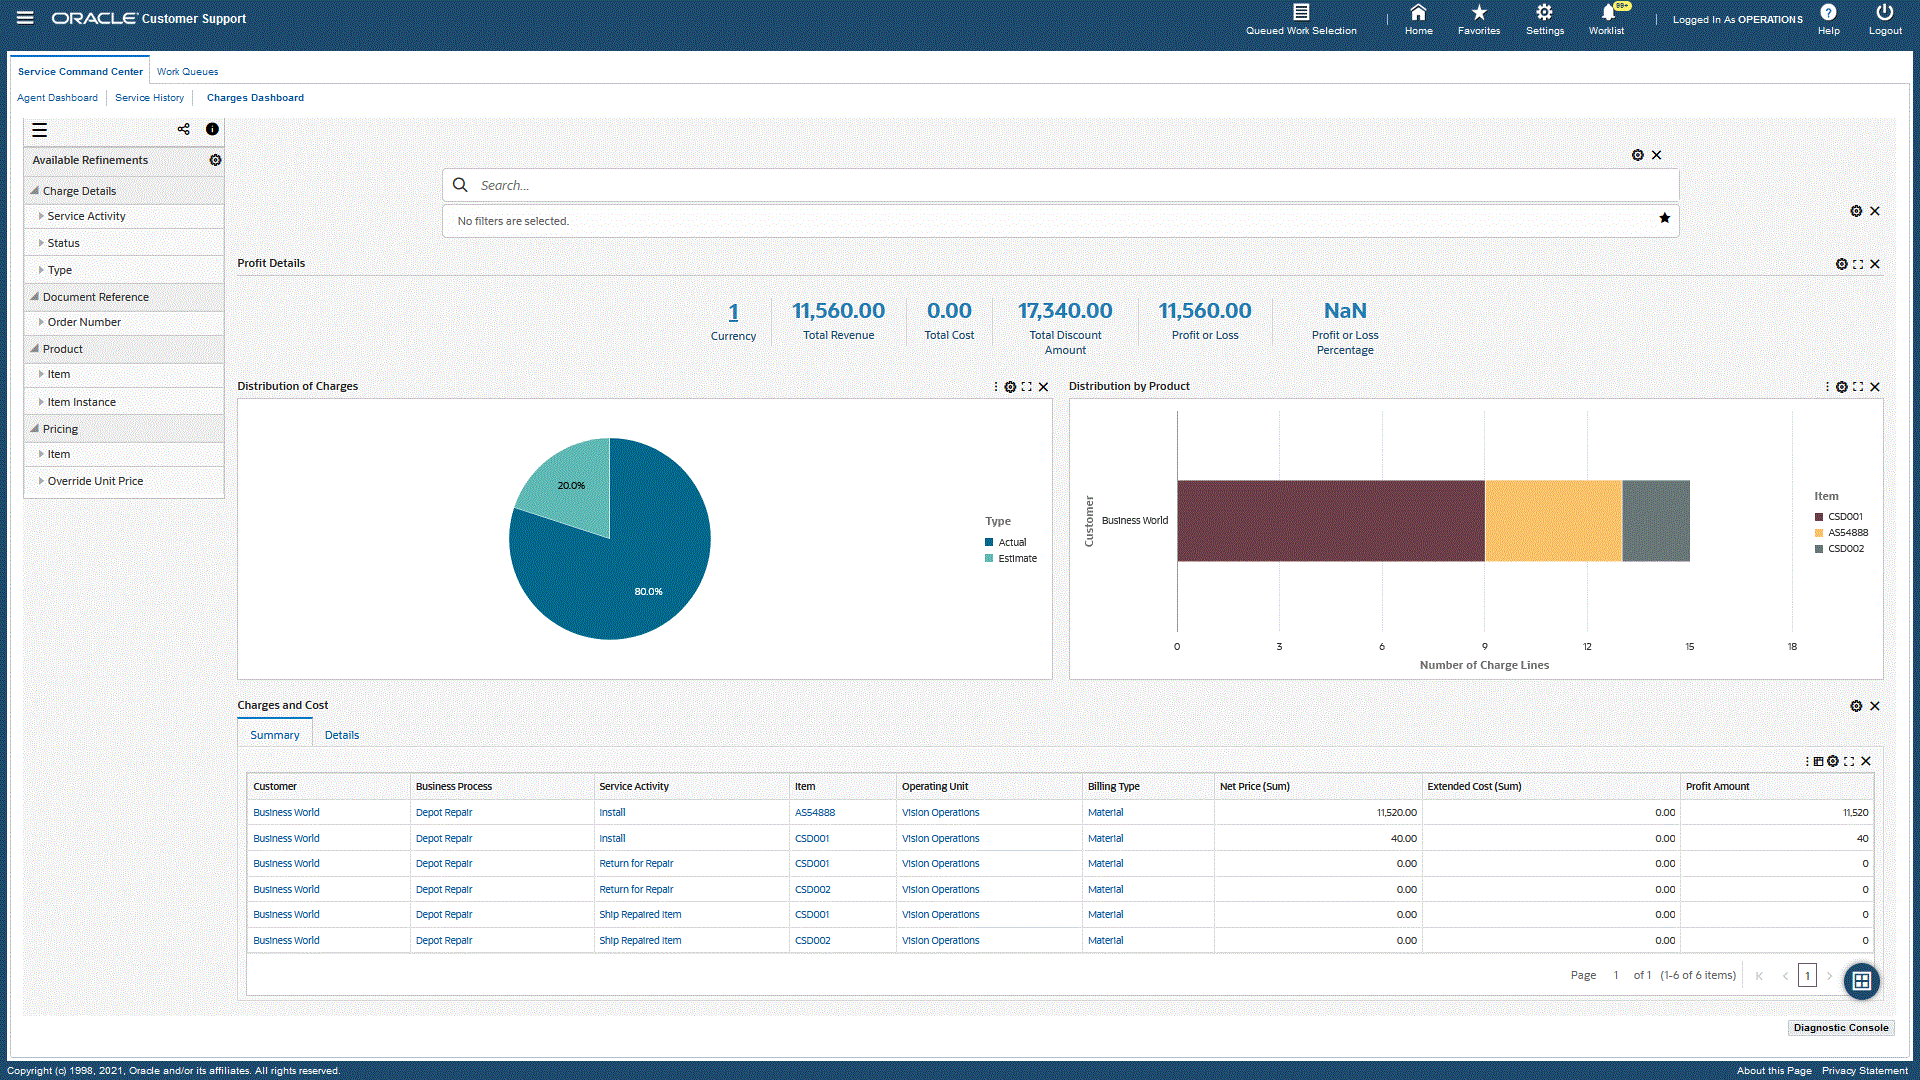
As a service manager, use the Charges Dashboard to ensure that your customers are billed as soon as a service is provided.
Use the dashboard to:
-
Search for service requests using notes keywords.
-
Review charges.
-
Review charge lines by status and find charge lines that are in For Review status.
-
Filter charge lines and review reasons that these lines have not automatically progressed to invoicing.
-
-
Identify stalled charge lines for review and to progress the service billing process.
From the Service Manager or Customer Support Specialist responsibility, navigate to the Charges Dashboard:
(N) Service Manager > Charges Dashboard
(N) Customer Support Specialist > Charges Dashboard
Charges Dashboard
Update Charge Dialog Box
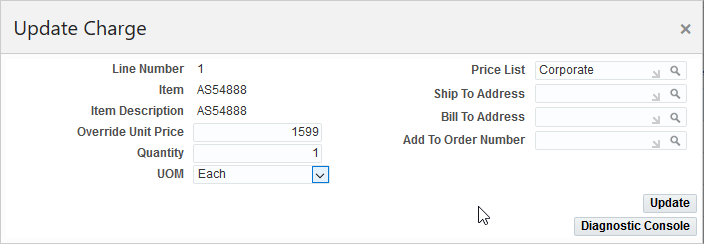
The following table describes the dashboard:
| Component | Description |
|---|---|
| Service Request (search box) | Users can enter notes keywords in the Service Request Search box. You can search using keywords in both service request notes and task notes that return a list of service requests that match the criteria. |
| Profit Details (summary bar) | This summary bar contains the following key metrics:
|
| Distribution of Charges (chart) | This chart shows the charge lines that require urgent attention. This chart displays the number of charge lines for different statuses (new, submitted, failed, needs review, and so on.) You can select dimensions to view the distribution of types and source of charge lines. To export the chart as an image or a comma-separated values (CSV) file format, click the Options icon and select the Export action. |
| Distribution by Product (chart) | This chart shows the number of charge lines. You can click the Options icon and select group dimensions to see the number of charge lines by attributes such as customer, billing type, service activity, and the source. To export the chart as an image or a comma-separated values (CSV) file format, click the Options icon, and select the Export action. |
| Charges and Cost (tabbed component) Summary (tab) |
The Charges and Cost Summary table shows a summary view of charges, cost, and profit based on attributes that include Customer, Business Process, Service Activity, Item, Operating Unit, and Billing Type. The following actions are available from the Options icon in this results table:
|
| Charges and Cost (tabbed component) Details (tab) |
The Charges and Cost Details results table shows attributes pertaining to charges. From the drop-down list, you can select views to display charges by:
You can perform the following row-level actions:
The following actions are available from the Options icon in this results table:
|
