6/29
Process Manufacturing Command Center
This chapter provides information about Oracle Process Manufacturing Command Center dashboards.
This chapter covers the following topics:
Process Manufacturing Command Center Overview
The Process Manufacturing Command Center increases operational efficiency and provides key insight into batch production transactions. Production supervisors, production managers, production schedulers and quality managers can use key metrics, drillable graphs, tag clouds, and network diagrams to quickly identify, track, and intervene in problem areas and outstanding issues. Based on your role, you can use the Process Manufacturing Command Center to:
-
Monitor pending material issues, shortages, and resources.
-
Identify and resolve shop floor schedule delays.
-
Manage customer order delays and production schedule changes.
-
Track outside processing operations.
-
Ensure production batches comply with regulatory mandates.
-
Track and trace the manufacturing production network to visualize the lot and serial units used across the supply chain including purchase orders, production batches, and sales orders.
The Process Manufacturing Command Center includes the following dashboards:
-
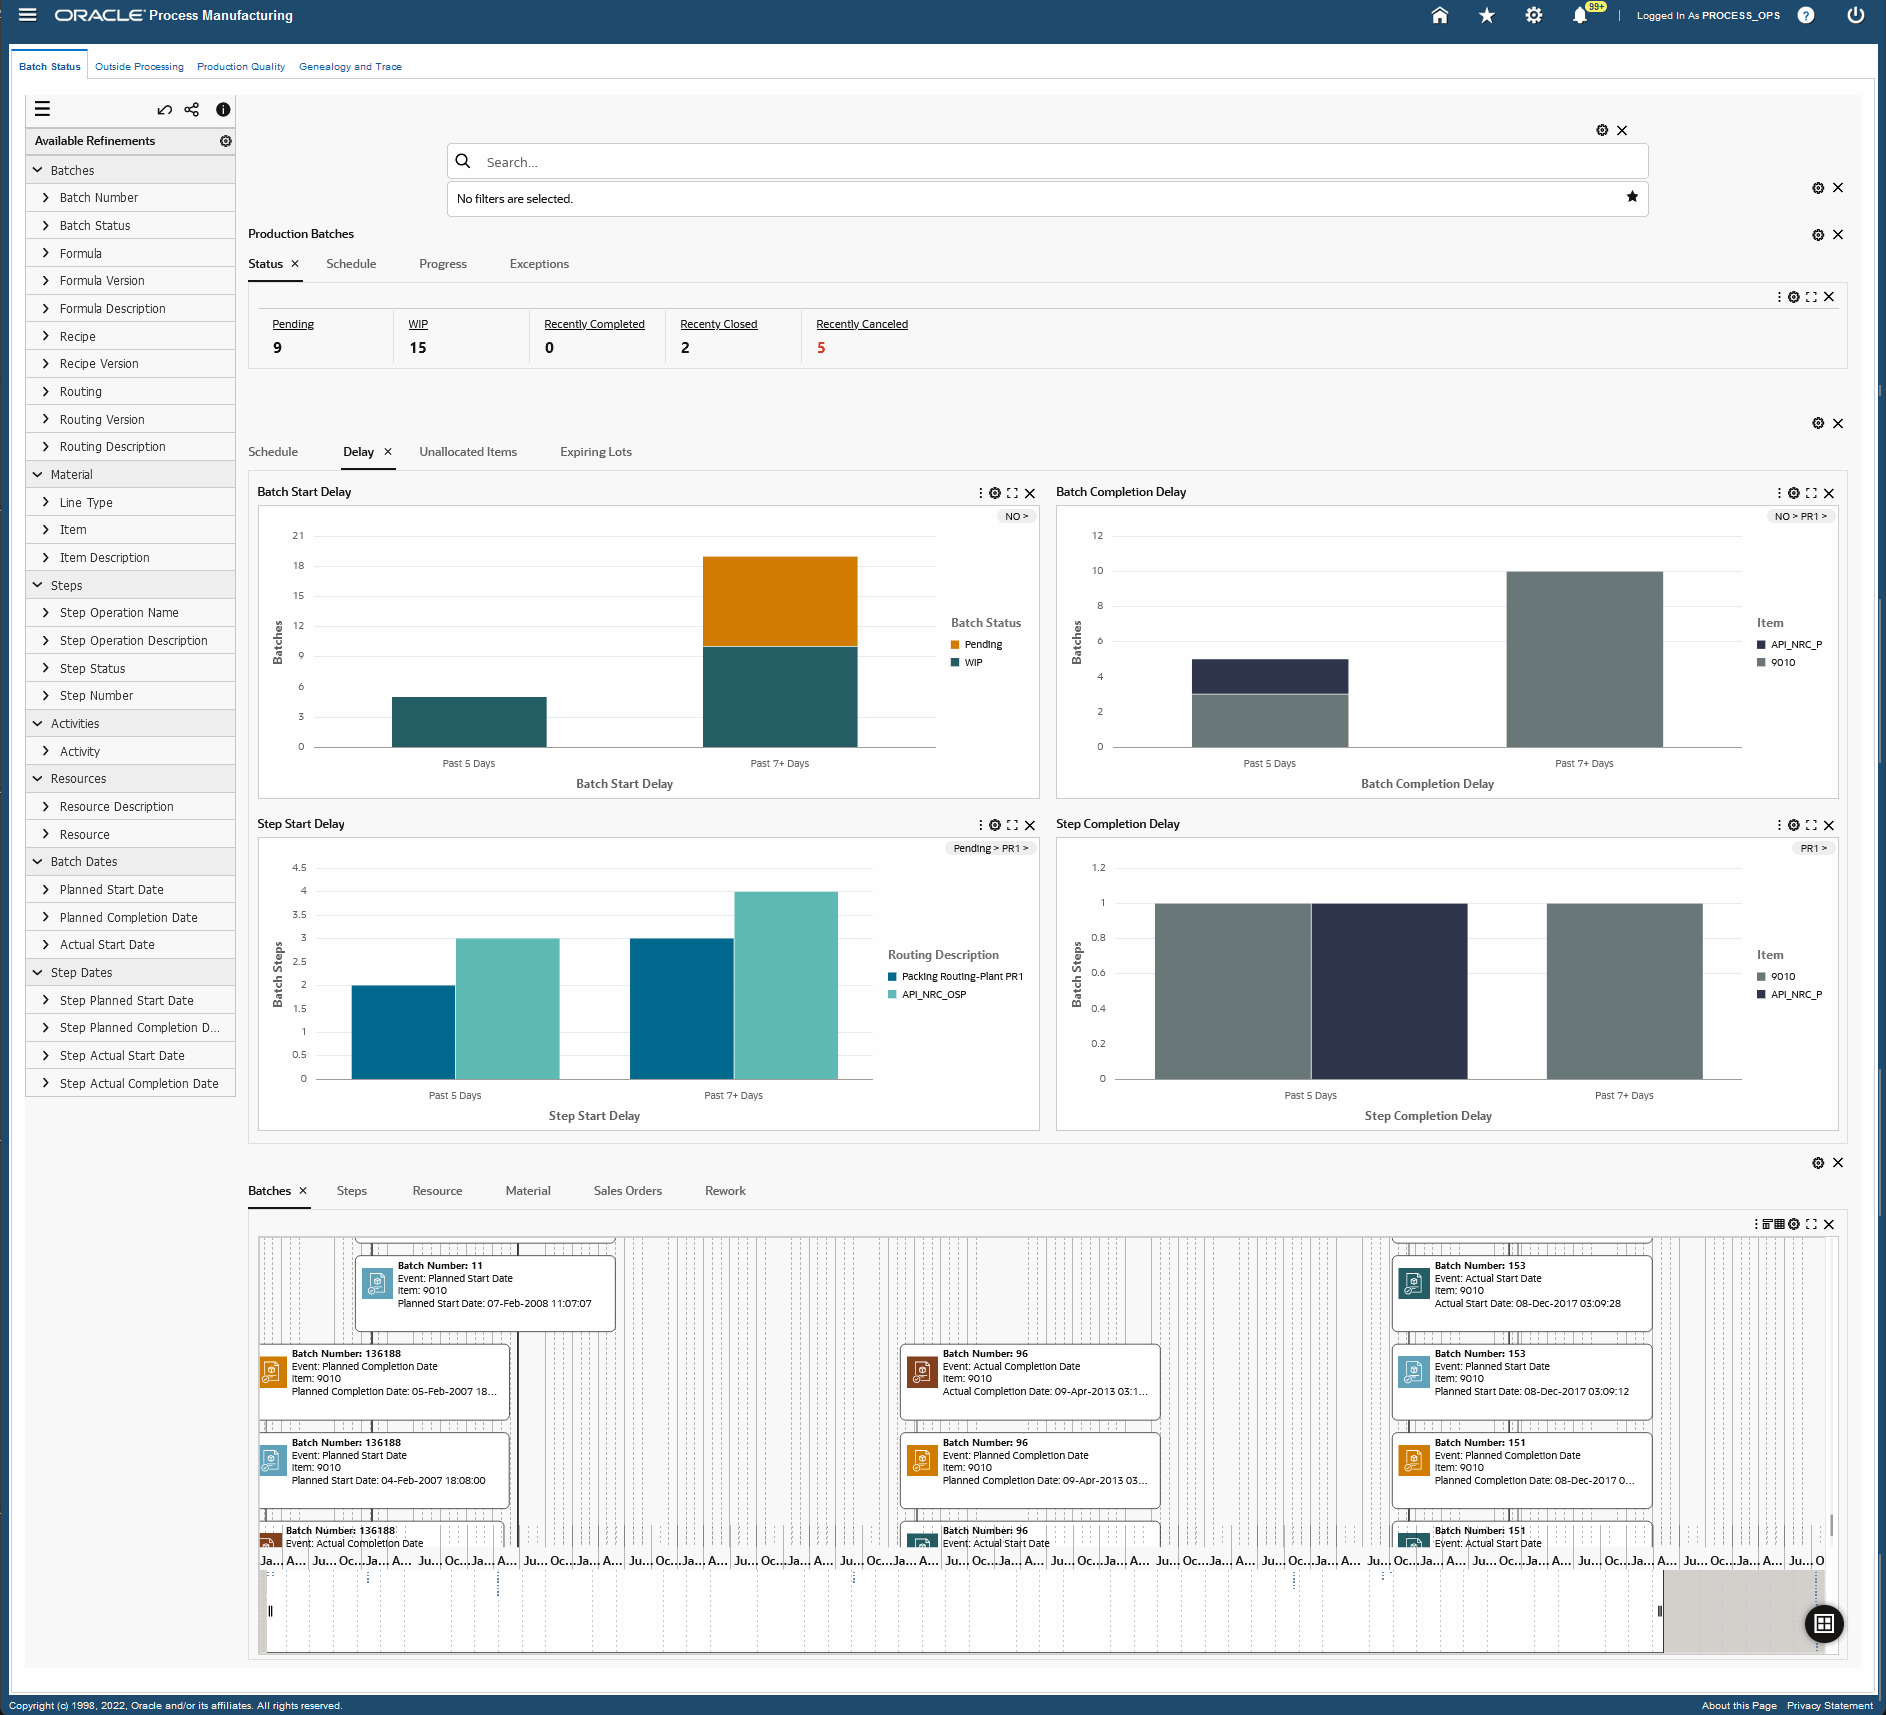
Batch Status dashboard - Use this dashboard to monitor production batch status, batch schedules, and expiring lots. You can also track and analyze production delays and unallocated items.
-
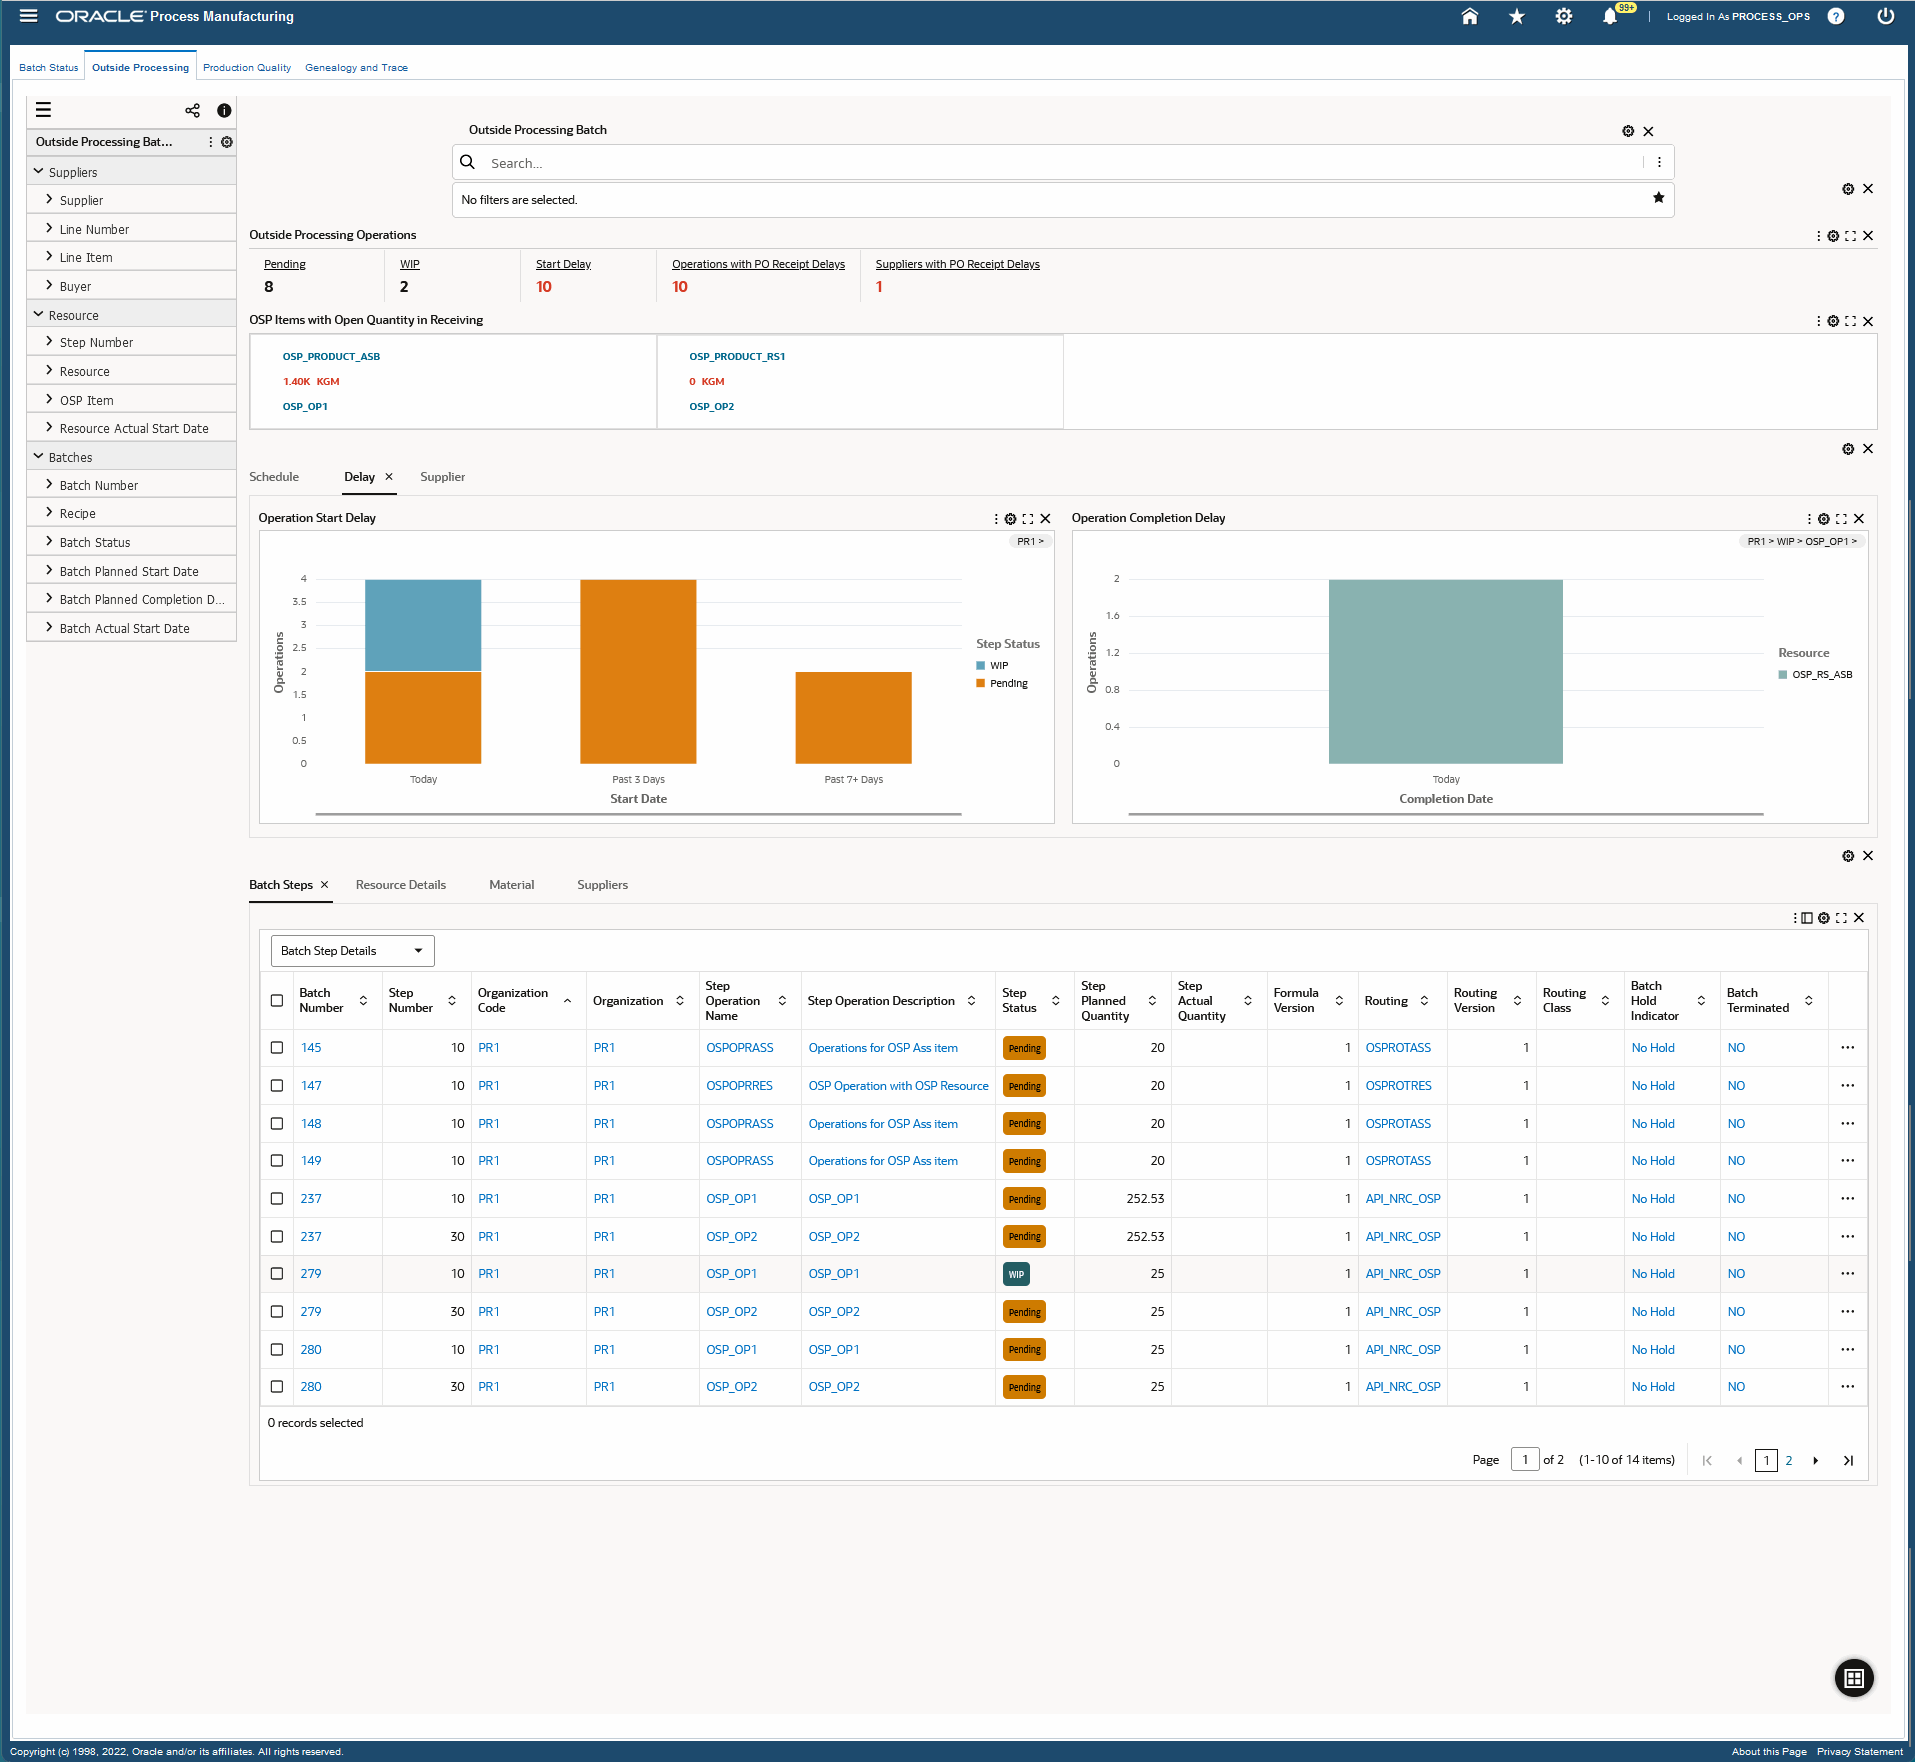
Outside Processing dashboard - Use this dashboard to monitor outside processing operations for pending and work in process (WIP) batches. You can identify delays, and schedule exceptions to ensure outside processing operations are on time.
-
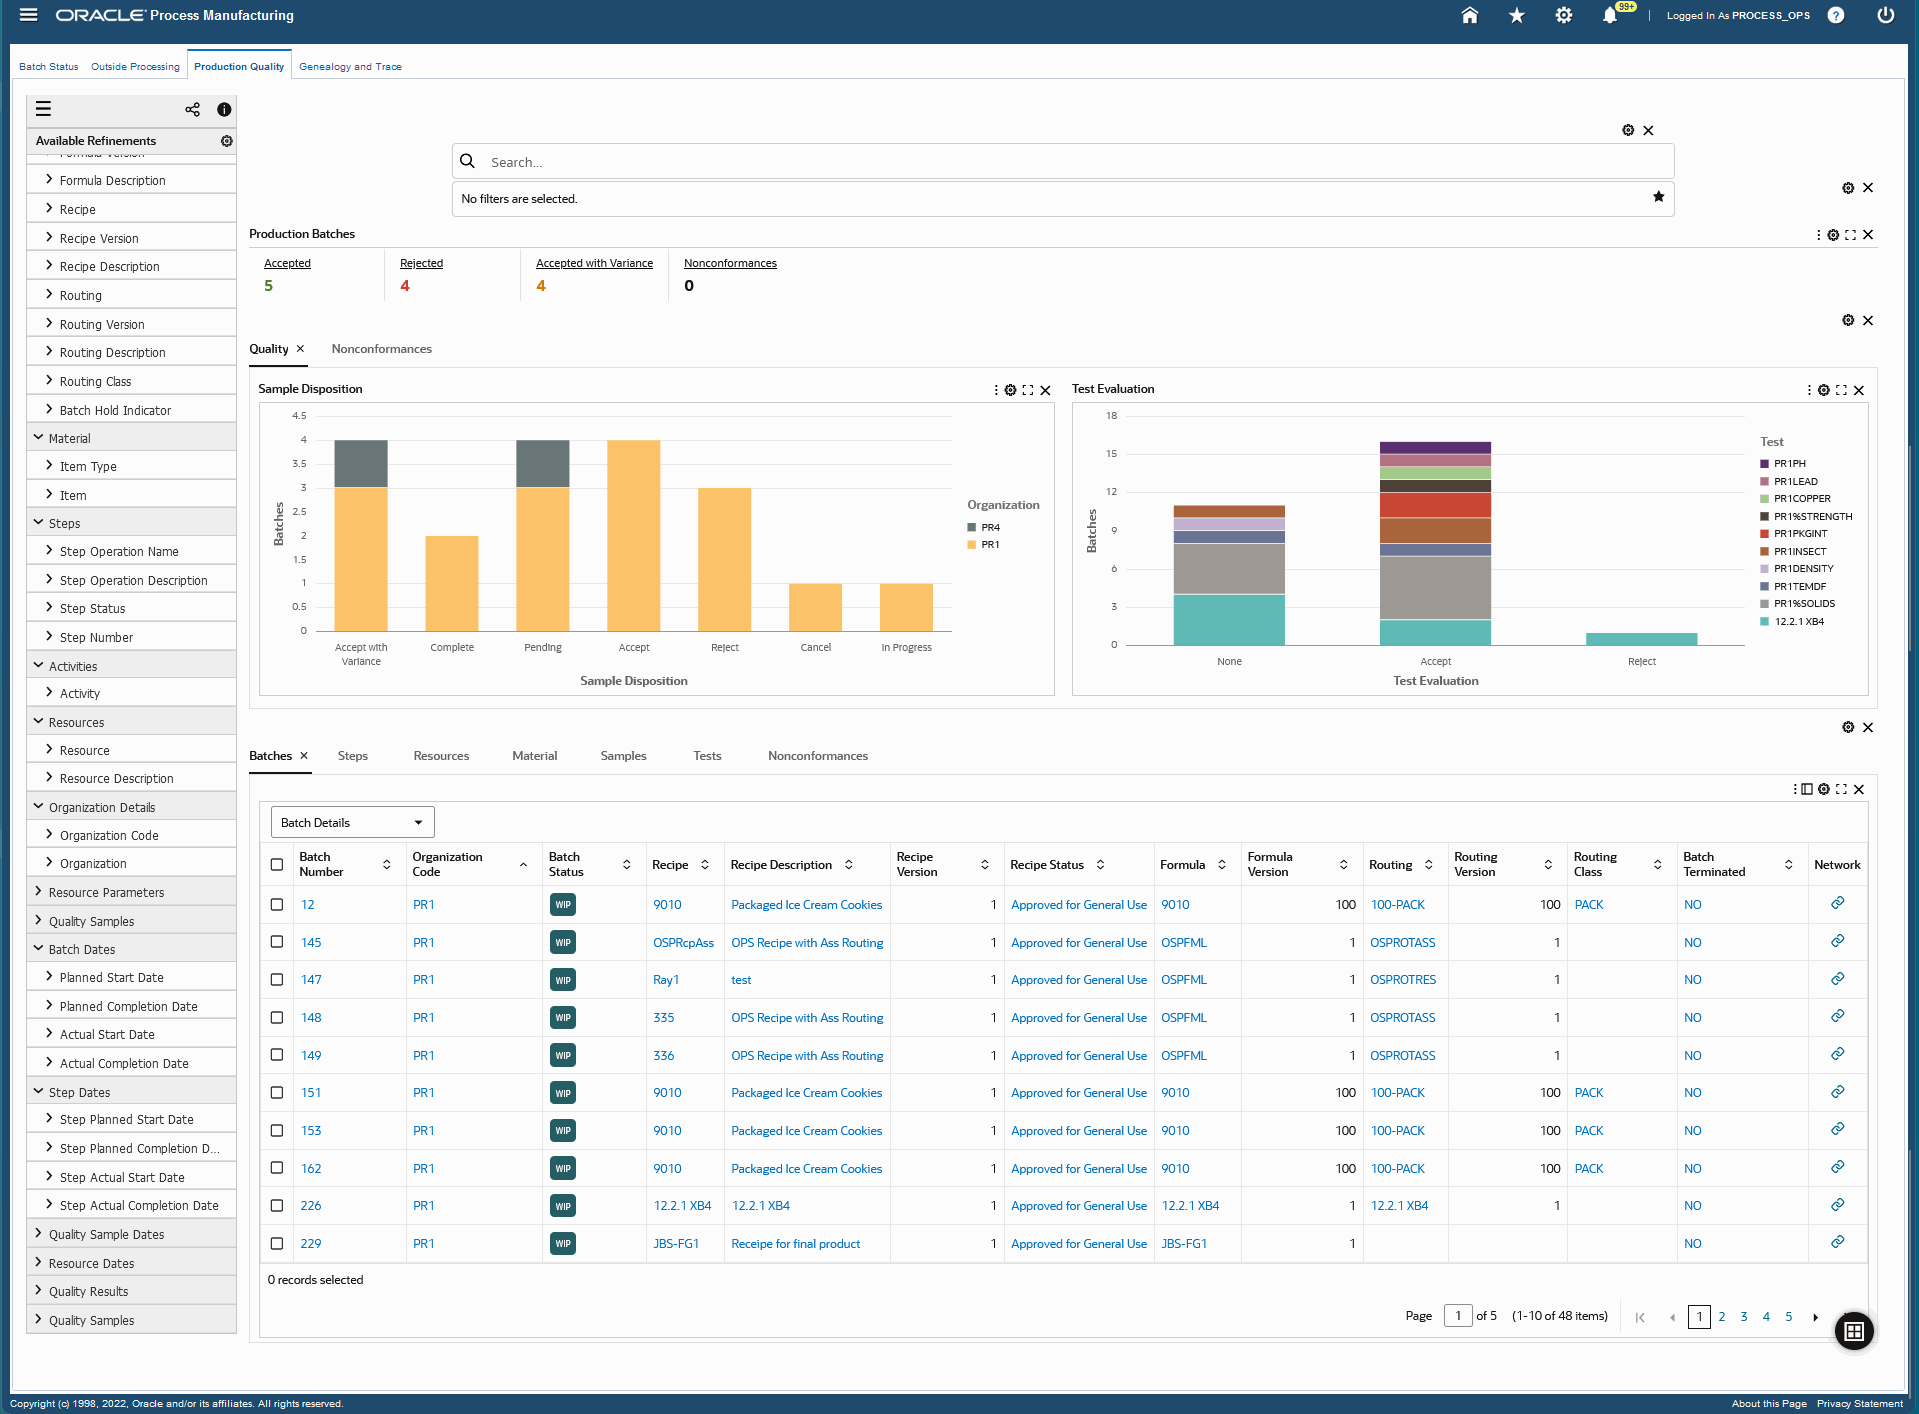
Production Quality dashboard - Use this dashboard to monitor the production quality processes. You can review quality samples, test evaluations, and nonconformances.
-
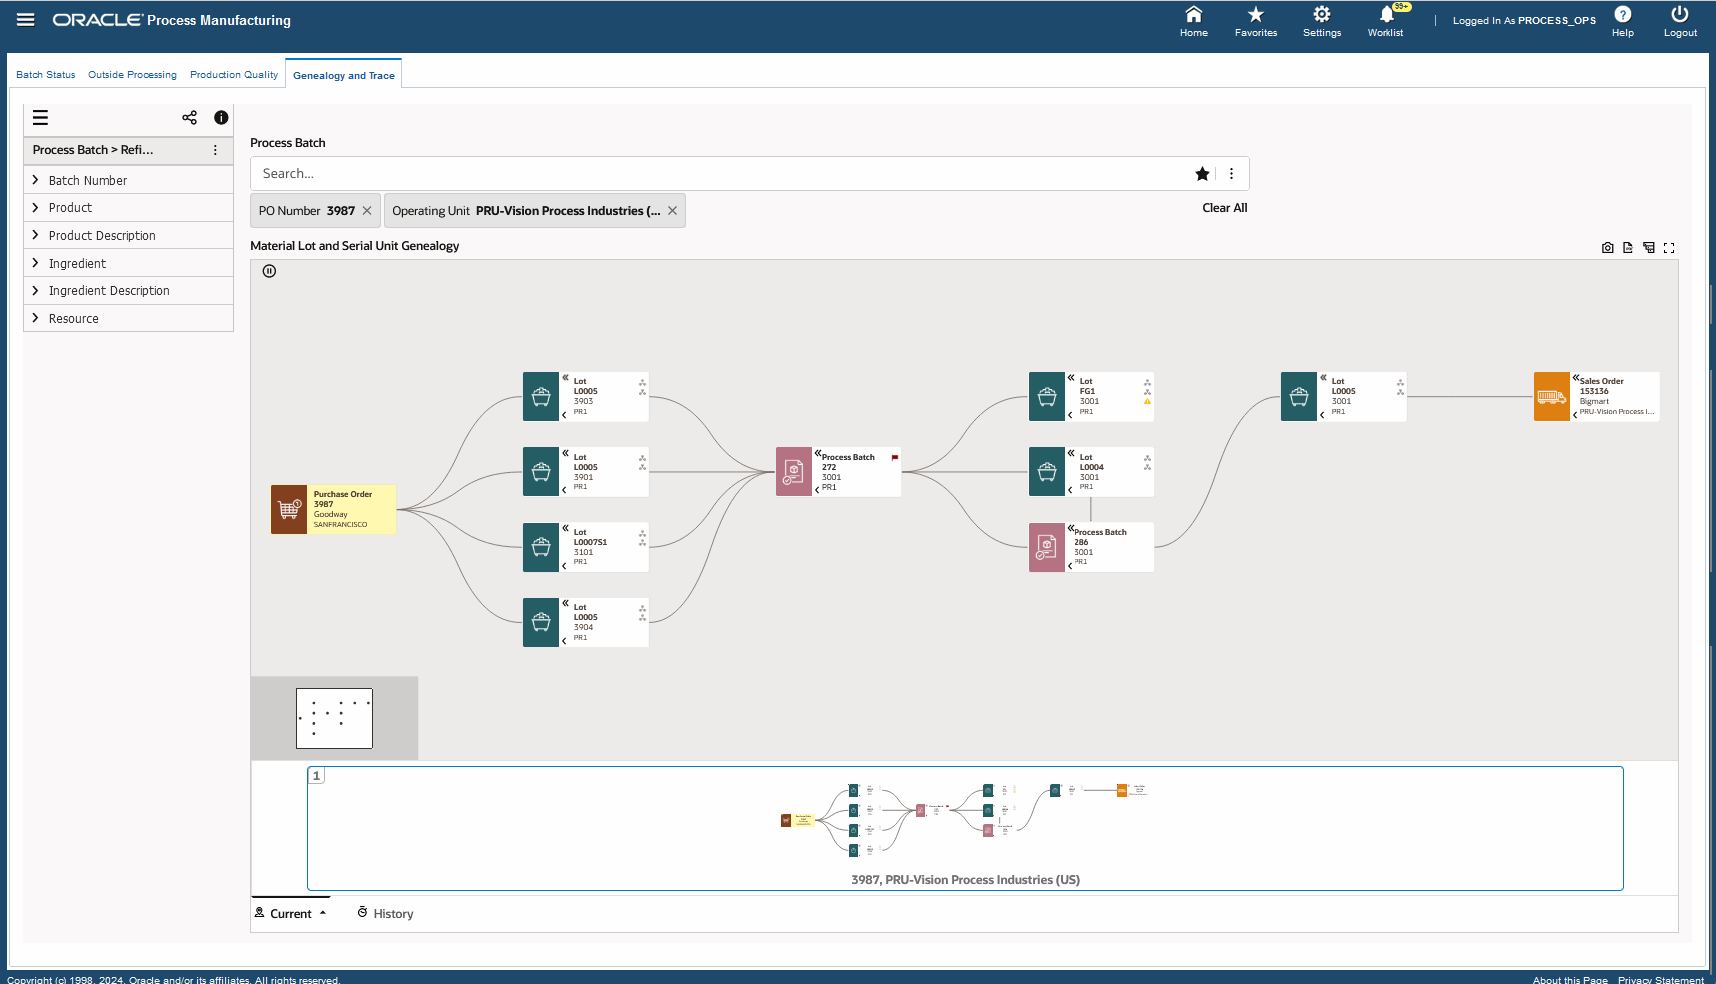
Genealogy and Trace dashboard - Use this dashboard to trace the manufacturing production network, both forward and backward, to track the source of material lots or serial units used in specific production batches, identify and isolate problems with these lots, and view the customers impacted by the production lots or serial units.
Note: The Oracle Process Manufacturing application configuration and setup must be completed after the installation and common configurations are completed as described in My Oracle Support Knowledge Document 2495053.1, Installing Oracle Enterprise Command Center Framework. For additional ECC Overview information, see Overview of Oracle Enterprise Command Center Framework, Oracle E-Business Suite User's Guide.
Searching Enterprise Command Center Dashboards
Use the dashboard sidebars to refine (filter) the data on each dashboard. You can select a value or record from the Available Refinements component, or use Search to find a keyword, a value, or a specific record. The type-ahead feature suggests matches for your entry that correspond to the available refinements. When you submit a search, the search term is added to the Selected Refinements list, and the dashboard data is refined to include only records that match the search. You can add multiple refinements and remove any of them at any time. Use Saved Search to create and save your search. You can edit, delete, or refer to this saved search. You can also search using Descriptive Flexfield (DFF) attributes. For a list of Process Manufacturing Command Center flexfields, refer to the "Configuring Descriptive Flexfields for Search" section in the chapter "Process Manufacturing Command Center Setup".
Use an asterisk (*) or percent sign (%) to perform a partial keyword or record search that matches any string of zero or more characters. You can also use a question mark (?) to perform a partial search that matches any single character.
Additional Information: For more information about searching for and refining data in enterprise command centers, see Search in Highlights of an Enterprise Command Center, Oracle E-Business Suite User's Guide.
Batch Status Dashboard
The Batch Status dashboard offers insight into production schedules, delays, unallocated items, and expiring lots and additional batch production information. As a production supervisor and production manager, you can use this dashboard to:
-
Monitor status of production batches and operations.
-
Track and manage production delays and production exceptions.
-
Manage expiration information of reserved lots for batches.
-
Identify customers and sales orders impacted by production delays.
-
Manage batch holds in case of material shortages or equipment issues.
Using refinements, you can search this dashboard for batches, material, batch steps, resources, resource parameters, sales orders, batch dates, batch step dates, sales order dates, expiring lots, and organization details. See the Process Manufacturing Command Center Overview for more information.
Navigate to the Batch Status dashboard:
(N) Production Supervisor > Process Manufacturing Command Center > Batch Status (tab)
Batch Status Dashboard

The following table describes the Batch Status dashboard components:
| Production Batches (summary bar) |
The Production Batches summary bar displays key metrics about production batch transactions in the following tabs:
-
Status
-
Pending
This metric displays the number of production batches scheduled for the future.
-
WIP
This metric displays the number of production batches that are in progress.
-
Recently Completed
This metric displays the number of production batches that were recently completed in the last two weeks.
-
Recently Closed
This metric displays the number of production batches that were recently closed in the last two weeks.
-
Recently Canceled
This metric displays the number of production batches that were canceled in the last two weeks.
-
Schedule
-
Starting Today
This metric displays the number of production batches that are starting today.
-
Finishing Today
This metric displays the number of production batches that are finishing today.
-
Start Delayed
This metric displays the number of pending production batches that have not yet started and are delayed from their scheduled planned date.
-
Started Late
This metric displays the number of in progress production batches that started late.
-
Completion Delayed
This metric displays the number of production batches that were not completed as scheduled.
-
Progress
-
Exceptions
-
Unallocated
This metric displays the number of production batches that have products with unallocated ingredients.
-
With Expiring Lots
This metric displays the number of production batches that have expiring lots.
-
Recently Terminated
This metric displays the number of production batches that were terminated in the last two weeks.
-
Recently Under Rework
This metric displays the number of production batches that have required rework in the last two weeks.
-
Original Batch Requiring Rework
This metric displays the number of original production batches that require rework.
The metrics display in color codes for warnings, alerts, or exceptions. To refine the dashboard data, click a metric link. |
| Schedule (tab) |
The Schedule tab displays the following charts:
-
Batch Start Schedule - This chart displays the number of batches started for a specific start date range. Click the Options icon to select Batch Start Date, Organization, Item, or Customer from the Group Dimensions menu.
-
Batch Completion Schedule - This chart displays the number of batches for a specific completion date range. Click the Options icon to select Batch Completion Date, Organization, Item, or Customer from the Dimension menu and the Group Dimensions menu.
-
Step Start Schedule - This chart displays the number of batch steps for a specific start date range. Click the Options icon to select Step Start Date, Organization, Routing Description, Step Operation Description, or Item from the Dimension menu and Group Dimensions menu.
-
Step Completion Schedule - This chart displays the number of batch steps for a specific completion date range. Click the Options icon to select Step Completion Date, Organization, Routing Description, Step Operation Description, or Item from the Dimension menu and the Group Dimensions menu.
The Batch Status and Step Status dimensions in the charts are color coded to show that the batches are in the following status:
|
| Delay (tab) |
The Delay tab displays the following charts:
-
Batch Start Delay - This chart displays the number of batches delayed for a specific date range. Click the Options icon to select Organization, Item, Customer, Batch Start Delay, or Batch Status from the Dimension menu. Select Batch Start Delay, Organization, Item, Customer, or Batch Status from the Group Dimensions menu.
-
Batch Completion Delay - This chart displays the number of batches with completion delays for a specific date range. Click the Options icon to select Organization, Item, Customer, or Batch Completion Delay from the Dimension menu. Select Batch Completion Delay, Organization, Item, or Customer from the Group Dimensions menu.
-
Step Start Delay - This chart displays the number of batch steps delayed for a specific date range. Click the Options icon to select Organization, Routing Description, Item, Step Operation Description, Step Start Delay, or Step Status from the Dimension menu. Select Step Start Delay, Organization, Routing Description, Item, Step Operation Description, or Step Status from the Group Dimensions menu.
-
Step Completion Delay - This chart displays the number of batch steps with completion delays for a specific date range. Click the Options icon to select Organization, Routing Description, Item, Step Operation Description, or Step Delay Completion from the Dimension menu. Select Step Completion Delay, Organization, Routing Description, Item, or Step Operation Description from the Group Dimensions menu.
The Batch Status and Step Status dimensions in the charts are color coded to show that the batches are in the following status:
|
| Unallocated Items (tab) |
The Unallocated Items tab displays the following charts:
-
Batches with Unallocated Ingredients - This chart displays the number of batches that contain unallocated ingredients, by item and organization.
-
Products with Unallocated Ingredients - This chart displays the number of batches that contain unallocated products, by item and organization. Click the Options icon to select Organization or Item from the Dimension menu.
|
| Expiring Lots (tab) |
The Expiring Lots tab displays the following chart and table:
-
Batches Reserved with Expiring Lots - This chart displays the number of batches reserved with expiring lots. Click the Options icon to select Organization. Item, or Scheduled Consumption from the Dimension menu. Select Lot Expiration Period, Organization, or Item from the Group Dimensions menu.
-
Details of Batches Reserved with Expiring Lots - This results table displays shows detailed information to identify expiration of reserved lots with reference to a batch. You can view information about item, item description, expiring lots, lot expiration dates, lot expiration periods, shelf life remaining before consumption, on-hand quantity, and so on.
You can use the Reservation Details icon in this table to navigate to the Item Reservation window.
|
| Results Tables (tab layout) |
The Batch Status dashboard results tables display production batch details under the following tabs:
-
Batches
Use this tab to select and view batch details information based on the following options available from the drop-down list:
-
Batch Details
-
Batch Dates
-
Batch Information
On the Batches tab, click the Actions icon, and select from the following:
-
Update - Click this action link to navigate to the Batch Details window.
-
Network - Click this action to view the Material Lot and Serial Unit Genealogy diagram for a batch in the Genealogy and Trace dashboard. You can also select multiple batch numbers in the Batches tabs, and then select View Network from the Actions menu.
-
Batch Quick Actions - Click this action link to perform the following for a selected batch if applicable:
-
Release - To release a batch, select Release from the Actions list of values, enter a date in the Actual Start Date field, optionally select to Bypass Material Exceptions, and then click Submit.
-
Complete - To release a batch, select Release from the Actions list of values, enter a date in the Actual Completion Date field, optionally select to Bypass Material Exceptions, and then click Submit.
-
Reschedule - To release a batch, select Release from the Actions list of values, enter a date in the Planned Completion Date field and then click Submit.
-
Cancel - To release a batch, select Cancel from the Actions list of values and click Submit.
-
Hold - To pause or stop a batch due to material shortages or equipment issues, select Hold from the Actions list of values, enter the following information, and then click Submit:
-
Hold Type - Select pause or stop.
-
Hold Reason - Select from the list of values to enter a hold reason, such as sample testing, machine damage, or material shortage.
-
Hold Comments - Enter comments if any.
Note: You can optionally enable and use e-signatures for Batch Quick Actions in the Process Manufacturing Command Center. You can set up the signing process for Batch Quick Actions to display the List of Signers page, the e-record, and the Signers page to then record signatures for a batch quick action. You can also choose to set up one-step e-signatures to capture all signatures on a single page. To enable and use e-records and e-signatures, see the following chapters in the Oracle E-Records Implementation Guide:
-
Implementing E-records
-
iSignatures
The Hold Alert column in the Batches tab displays the Hold icon for which the tooltip displays either Pause or Stop depending on the hold type of a batch number. To release the batch hold, use the following steps:
-
Click the icon in the Batch Hold column for a batch that is in the Pause or Stop status.
-
In the Release Comments field, enter comments if any.
-
In the Hold End Date field, select and enter a date.
-
Click Submit.
-
Steps
Use this tab to select and view batch step information based on the following options available from the drop-down list:
-
Step Details
-
Step Dates
-
Batch Steps Information
You can view the information in the Batches and Steps tabs in the results tables using the Timeline View or Table View options.
Click the Timeline View icon in the Batches or the Steps tab to see the following events for a batch or a batch step:
-
Planned Start Date
-
Planned Completion Date
-
Actual Start Date
-
Actual Completion Date
Right-click each event in the Timeline View to select Show Details or any applicable action.
Click the Timeline View Option icon to enable the overview display and select the optimum number of records within the maximum limit of 500 to view all the dates for each batch and batch step. You can also use the Timeline View Option icon to add and remove events.
-
Resources
Use this tab to select and view resources related information based on the following options available from the drop-down list:
-
Material
Use this tab to select and view materials related information.
On the Batches tab, click the Actions icon, and select from the following:
-
Network - Click this action to view the Material Lot and Serial Unit Genealogy diagram for a batch in the Genealogy and Trace dashboard. You can also select multiple batch numbers in the Batches tabs, and then select View Network from the Actions menu.
-
View Item Details - Click this action link to navigate to the Items dashboard.
-
Sales Orders
Use this tab to select and view sales order related information.
-
Rework
Use this tab to select and view batch rework related information based on the following options available from the drop-down list:
-
Rework Batch Details
-
Batch Dates
-
Batch Information
-
Batch Hold Details
Click the link icon in the Network column on the Batches and Material tabs to view the Material Lot and Serial Unit Genealogy diagram for a batch in the Genealogy and Trace dashboard. You can also select multiple batch numbers in the Batches and Material tabs, and then select View Network from the Actions menu.
Click the links in the table columns to refine the information available on the dashboard.
The following actions are available from the Options icon in the Batch Status dashboard tables:
|
See:
Outside Processing Dashboard
The Outside Processing dashboard offers insight into outside processing operations for pending and work in process (WIP) batches. As a production supervisor or production scheduler, you can use this dashboard to:
-
Identify delays in outside processing operations.
-
Track and notify suppliers about schedule delays.
-
Ensure outside processing operations are executed on time.
Using refinements, you can search on suppliers, resources, and batches to view and organization details. See Process Manufacturing Command Center Overview for more information.
Navigate to the Outside Processing dashboard:
(N) Production Supervisor > Process Manufacturing Command Center > Outside Processing (tab)
Outside Processing Dashboard

The following table describes the Outside Processing dashboard components:
| Outside Processing Operations (summary bar) |
The Outside Processing Operations summary bar displays the following key metrics:
-
Pending
This metric displays the number of outside processing steps that are scheduled for the future.
-
WIP
This metric displays the number of outside processing steps that are in process.
-
Start Delay
This metric displays the number of outside processing steps with start delays for pending and WIP batch steps.
-
Operations with PO Receipt Delay
This metric displays the number of outside processing operations with PO expected receipts that are past the current date.
-
Suppliers with PO Receipt Delay
This metric displays the number of suppliers with PO expected receipts that are past the current date.
The metrics display in color codes for warnings, alerts, or exceptions. Click a metric link to refine the dashboard data. |
| OSP Items with Open Quantity in Receiving (grid) |
The OSP Items with Open Quantity in Receiving grid shows information about the outside processing items that are yet to be procured from the suppliers. You can click the links in this summary bar to refine the information in the dashboard. |
| Schedule (tab) |
The Schedule tab displays the following charts:
-
The Operation Start Schedule - This chart displays the start schedule information for pending outside processing operations. Click the Options icon to select Organization Code, Status, Operation Code, or Resource in the Dimension menu. Select Start Date, Organization Code, Status, Operation Code, or Line Item from the Group Dimensions menu.
-
Operation Completion Schedule - This chart displays the completion schedule information for outside processing steps for WIP outside processing operations. Click the Options icon to select Organization Code, Status, Operation Code, or Resource in the Dimension menu. Select Completion Date, Organization Code, Status, or Line Item from the Group Dimensions menu.
|
| Delay (tab) |
The Delay tab displays the following charts:
-
Operation Start Delay - This chart displays information about the outside processing operations with start delays. Click the Options icon to select Organization Code, Step Status, or Resource in the Dimension menu. Select Start Date, Organization Code, Operation Code, or Line Item from the Group Dimensions menu.
-
Operation Completion Delay - This chart displays the information about the outside processing operations with completion delays. Click the Options icon to select Organization Code, Step Status, or Resource in the Dimension menu. Select Completion Date, Organization Code, Status, Operation Code, or Line Item from the Group Dimensions menu.
|
| Supplier (tab) |
The Supplier tab displays the following information:
-
Outside Processing Suppliers - This tag cloud displays the list of the top 10 suppliers for whom the number of outside operations are in pending and WIP status. The entities are displayed in relative sizes by frequency of occurrence. You can click an entity in the tag cloud to filter the data in the dashboard. Outside processing operations that are not associated to any supplier, are tagged as PO Not Created.
-
Outside Processing Operations - This chart displays information about the supplier outside processing operations. Click the Options icon to select Organization Code, Step Status, Operation Code, or Resource in the Dimension menu. Select Supplier, Operation Code, or Resource from the Group Dimensions menu.
|
| Results Tables (tab layout) |
The Outside Processing dashboard results tables display outside processing operation information for batches with the status Pending and WIP under the following tabs:
-
Batch Steps
Use this tab to select and view batch step information based on the following options available from the drop-down list:
-
Batch Step Details
-
Step Dates
-
Batch Steps Information
Click the link icon in the Update column on the Batch Steps tab to navigate to the Batch Steps window.
-
Resource Details
Use this tab to select and view resources related information based on the following options available from the drop-down list:
-
Material
Use this tab to select and view material related information.
Click the icon in the View Item Details column on the Material tab to navigate to the Items dashboard.
-
Suppliers
Use this tab to select and view supplier related information.
Click the link icon in the Network column on the Batches and Material tabs to view the Material Lot and Serial Unit Genealogy diagram for a batch in the Genealogy and Trace dashboard. You can also select multiple batch numbers in the Batches and Material tabs, and then select View Network from the Actions menu.
Click the links in the table columns to refine the information available on the dashboard.
The following actions are available from the Options icon in the Outside Processing dashboard tables:
|
See:
Production Quality Dashboard
The Production Quality dashboard offers insight into quality samples, test evaluations, and nonconformances. As a production supervisor, you can use this dashboard to:
-
Ensure the process and product quality.
-
Identify the issues that cause low yield.
-
Monitor and analyze product nonconformances.
Using refinements, you can search on batches, material, batch steps, resources, organization details, resource parameters, quality samples, batch dates, batch step dates, quality sample dates, resource dates, and quality results. See Process Manufacturing Command Center Overview for more information.
Navigate to the Production Quality dashboard:
(N) Production Supervisor > Process Manufacturing Command Center > Production Quality (tab)
Production Quality Dashboard

The following table describes the Production Quality dashboard components:
| Production Batches (summary bar) |
The Production Batches summary bar displays the following key metrics:
-
Accepted
This metric displays the number of production batches with samples that are accepted.
-
Rejected
This metric displays the number of production batches with samples that are rejected.
-
Accepted with Variance
This metric displays the number of production batches that are accepted with variance sample dispositions.
-
Nonconformances
This metric displays the total number of nonconformances reported.
The metrics display in color codes for warnings, alerts, or exceptions for the selected organizations. Click a metric link to refine the dashboard data. |
| Quality (tab) |
The Quality tab displays the following charts:
-
Sample Disposition - This chart displays the number of batches and their dispositions organized by the items included in the batches. Click the Options icon to Organization, Item, or Sample Disposition in the Dimension menu. Select Sample Disposition, Organization, or Item from the Group Dimensions menu.
The Sample Disposition dimension in the chart is color coded to show the following sample dispositions:
-
Accept
-
Accept with Variance
-
Reject
-
Planned
-
Pending
-
In Progress
-
Complete
-
Cancel
-
Test Evaluation - This chart displays the number of batches and their dispositions organized by the tests included in the batches. Click the Options icon to select Test, Organization, or Test Evaluation from the Dimension menu. Select Test Evaluation, Test, or Organization from the Group Dimensions menu.
The Test Evaluation dimension in the chart is color coded to show test results that you can:
-
Accept
-
Accept with Variance
-
Reject
|
| Nonconformances (tab) |
The Nonconformances tab displays the following information:
-
The Top 10 Nonconformances tag cloud displays the highest number of occurring nonconformance reasons. The entities are displayed in relative sizes by frequency of occurrence. You can click an entity in the tag cloud to filter the data in the dashboard.
-
Nonconformances - This chart displays the number of nonconformances and the nonconformance severity levels. Click the Options icon to select Nonconformance Severity or Nonconformance type from the Dimensions menu. Select Organization, Item, Routing, or Resource from the Group Dimensions menu.
|
| Results Tables (tab layout) |
The Production Quality dashboard results tables display batch production quality information under the following tabs:
-
Batches
Use this tab to select and view batch details information based on the following options available from the drop-down list:
-
Batch Details
-
Batch Dates
-
Batch Information
-
Steps
Use this tab to select and view batch step information based on the following options available from the drop-down list
-
Step Details
-
Step Dates
-
Batch Steps Information
-
Resources
Use this tab to select and view resources information based on the following options available from the drop-down list:
-
Material
Use this tab to select and view material related information.
Click the icon in the View Item Details column on the Material tab to navigate to the Items dashboard.
-
Samples
Use this tab to select and view sample related information.
Click the icon in the View Sample Details column on the Samples tab to navigate to the Sample Inspection dashboard.
-
Tests
Use this tab to select and view information about test related information.
-
Nonconformances
Use this tab to select and view nonconformances related information.
Click the link icon in the Network column on the Batches, Material, and Samples tabs to view the Material Lot and Serial Unit Genealogy diagram for a batch in the Genealogy and Trace dashboard. You can also select multiple batch numbers in the Batches, Material, and Samples tabs, and then select View Network from the Actions menu.
Click the links in the table columns to refine the information available on the dashboard.
The following actions are available from the Options icon in the Production Quality dashboard tables:
|
See:
Genealogy and Trace Dashboard
The Genealogy and Trace dashboard provides quality analysts and quality managers a quick and easy traceability solution to track the supply chain and analyze manufacturing information to isolate problems and resolve issues. For example, during quality recall scenarios, you can identify the specific production batches that produced recalled lots and trace back to the ingredient lots with quality issues. You can also view all production batches that have used similar quality lots to analyze any customer impacts. You can also identify, isolate, and put a hold on the likely defective product lots that are still in the warehouse. You can also view details about rework batches.
Use this dashboard to:
-
Visualize the end-to-end supply chain and manufacturing information comprising of purchase orders, material lots, work orders, production serial units, and sales orders.
-
Trace the network forward and backward to track the source of material lots consumed in specific production work orders along with customer information.
-
Analyze the broader impact of specific material lot from its consumption pattern.
-
View details for a node and perform actions for the specific batch, material lot, serial unit, sales order and so on.
The Material Lot and Serial Unit Genealogy diagram displays the network relationship of the entity that you query. You can use the Search field to find a batch number. You can also select from the available refinements for process batches, serial numbers, purchase orders, sales orders, and lot numbers such as batch, product, ingredient, serial number, item, PO number, supplier, operating unit, order number, lot number and so on to filter the information that displays in the diagram. See the Process Manufacturing Command Center Overview for more information.
Navigate to the Genealogy and Trace dashboard:
(N) Production Supervisor > Process Manufacturing Command Center > Genealogy and Trace (tab)
The following table describes the Genealogy and Trace dashboard components:
Genealogy and Trace Dashboard

| Component |
Description |
| Material Lot and Serial Unit Genealogy (diagram) |
This diagram displays the network details for the node you query or the refinements that you select. Right-click a node to view available Actions and to select from the following options:
-
Make Anchor Node - Select this option to make a node the main node.
-
Show Adjacent Nodes - Select this option to expand a node to see its related nodes.
-
Highlight Path - Select this option to highlight the specific path of a node. You can right-click and select Unhighlight Path to remove highlighting a path.
-
Explore Node - Select this option to explore the node further.
-
Compare - Select multiple nodes and click Compare for a side-by-side comparison of the records of each selected node.
-
Show Details - Select this for a node to view details. On the Details window that opens, select multiple filters and then click Find Similar to apply these filters to the diagram.
Based on your search and selected refinements, the network diagram displays the following nodes:
-
Purchase Order - This node displays the purchase order number, supplier name, and the operating unit. Right-click and select:
-
Show Details - Click this link to view the document type, supplier site, status, operating unit, buyer, document type, amount, and currency.
-
View Purchase Order - Click this action link to navigate to the Standard Purchase Order page.
The Purchase Order node displays the Hold icon for open and current purchase orders that are on hold.
-
Lot - This node displays the lot number, item name, and the organization code. Right-click and select:
-
Show Details - Click this link to view the document type, item, item description, organization name, status code, grade code, origination date, origination type, origination transaction, retest date, expiration date, expiration action date, hold date, supplier lot, parent lot, and if the lot is disabled or not.
-
View Item Lots - Click this action link to navigate to the Lot Number window.
-
View Lot Transactions - Click this action link to navigate to the Material Transactions window.
-
View Quality Results - Click this action link to navigate to the:
-
Quality Command Center's Sample Inspection or Sample Analysis dashboards for the lots in process manufacturing organizations.
-
Quality Command Center's Collection Results dashboard for the lots in discrete manufacturing organizations. Note that this link defaults to the Collections Results tab, and to the Discrete Manufacturing Attributes.
-
View Material Workbench - Click this action link to navigate to the Material Workbench page (for Release 12.2.9 and above) or to the Material Workbench window (if lower than Release 12.2.9).
The Lot node displays the following icons:
-
Status - This icon indicates the different status codes of a lot.
-
Expired - This icon indicates that the lot is expired and still not completely consumed.
-
Grade - This icon indicates the grade code of a lot.
-
Process Batch - This node displays the batch number, primary product item name, and the organization code. Right-click and select:
-
Show Details - Click this link to view the document type, batch, product, description, status, recipe, recipe version, plan start date, plan completion date, actual start date, actual completion date, close date, product plan quantity, product actual quantity, product UOM, and if the batch is terminated or not.
-
View Batch Details - Click this action link to navigate to Batch Details window.
-
View Batch Status - Click this action link to navigate to Batch Status dashboard.
-
View Production Quality - Click this action link to navigate to Production Quality dashboard.
The Process Batch node displays the following icons:
-
Hold - This icon indicates that a batch is actively on hold.
-
Terminated - This icon indicates that a batch is terminated.
-
Rework - This icon indicates a rework batch.
-
Process Reworked Batch - The reworked Process Batch node displays the Reworked Batch flag indicating that this is a reworked process batch. The reworked process batch node displays the batch number, product, and organization. Right-click and select:
-
Show Details - Click this link to view additional details such as product description, plan start and completion dates, recipe and recipe version, routing and routing version, rework batch number, rework batch product, rework batch UOM, and rework batch quantity for the reworked process batch.
-
View Batch Details - Click this action link to navigate to Batch Details window.
-
View Batch Status - Click this action link to navigate to Batch Status dashboard.
-
View Production Quality - Click this action link to navigate to Production Quality dashboard.
-
Serial - This node displays the serial unit, item name or assembly name, and the organization code. Right-click and select:
-
Show Details- Click this link to view the document type, serial number, item, item description, organization name, serial status, origination date, initialization date, completion date, ship date, parent lot number, parent serial number, supplier lot number, supplier serial, number, and material status.
-
View Serial Numbers - Click this action link to navigate to the Serial Number window.
-
View Serial Transactions - Click this action link to navigate to the Material Transactions window to view serial transactions.
-
View Quality Results - Click this action link to navigate to the Quality Command Center's Collection Results dashboard. Note that this link defaults to the Collections Results tab, and to the Discrete Manufacturing Attributes.
-
View Material Workbench - Click this action link to navigate to the Material Workbench page (for Release 12.2.9 and above) or to the Material Workbench window (if lower than Release 12.2.9).
-
Sales Order - This node displays the sales order number, customer name, and the operating unit. Right-click and select:
-
Show Details - Click this link to view the document type, order number, customer, operating unit, order type, ordered date, booked date, and the sales representative for the sales order.
-
View Sales Order - Click this action link to navigate to the Sales Order page.
The Sales Order node displays the Hold icon for open and current sales orders.
The following icons are available for the Material Lot and Serial Unit Genealogy diagram:
-
Export to Image - Export the Material Lot and Serial Unit Genealogy diagram information as image.
-
Export to PDF - Download and export the information in the PDF format.
-
Row Expander - View network relationship for the entity you have queried in a hierarchical row format. To go back to the diagram view, click the Network Diagram icon.
|
See:
