Oracle Channel Revenue Management Command Center
This chapter covers the following topics:
- Channel Revenue Management Command Center Overview
- Open Claims Dashboard
- Closed Claims Dashboard
- Budgets Dashboard
Channel Revenue Management Command Center
Channel Revenue Management Command Center Overview
The Oracle Channel Revenue Management Command Center presents claims analysts, claims managers and finance managers with information to help resolve claims, and gives full visibility into outstanding claims and deductions in the enterprise. The dashboard also enables managers to track funds and their related promotional activity transactions to forecast and execute various promotional activities to get maximum return on investments. Use this data to maximize productivity for a variety of end-to-end business processes. The Channel Revenue Command Center enables you to collaborate, review, analyze, and act to:
-
Eliminate revenue leakage.
-
Quickly identify and charge back invalid deductions.
-
Gain control over trade funds with comprehensive budget visualization.
-
-
Improve payment collection.
-
Prioritize high value claims for closure to maximize cash returns.
-
Quickly identify past due balance and take action to recover payments.
-
-
Increase profit margins.
-
Identify overbooked claims agents and balance workload to clear aged claims.
-
Improve operation and process efficiency with smarter analysis and effective collaboration with customers and suppliers.
-
The Channel Revenue Management Command Center contains the Claim tab and the Budget tab.
The Claim tab contains the following:
The Budget tab contains the following:
Note: You must complete the Channel Revenue Management Command Center configuration and setup after the installation and common configurations are completed as described in My Oracle Support Knowledge Document 2495053.1, Installing Oracle Enterprise Command Center Framework, Release 12.2. For additional ECC overview information, see Overview of Oracle Enterprise Command Centers, Oracle E-Business Suite User's Guide.
Searching Enterprise Command Center Dashboards
Use the sidebar to search for and refine (filter) the data on a dashboard. You can select a value or record from the Available Refinements component, or you can use the Search field to find a keyword, a value, or a specific record. When you submit a search, the search term is added to the Selected Refinements list, and the dashboard data is refined to include only records that match the search. You can add multiple refinements and remove any of them at any time. Use Saved Search to create and save your search. You can edit, delete, or refer to this saved search. You can also use data sets to further refine your search.
Use an asterisk (*) or a percent sign (%) to perform a partial keyword or record search that matches any string of zero or more characters. You can also use a question mark (?) to perform a partial search that matches any single character.
Additional Information: For more information about searching for and refining data in Oracle Enterprise Command Centers, see "Search" under Highlights of an Enterprise Command Center, Oracle E-Business Suite User's Guide.
Open Claims Dashboard
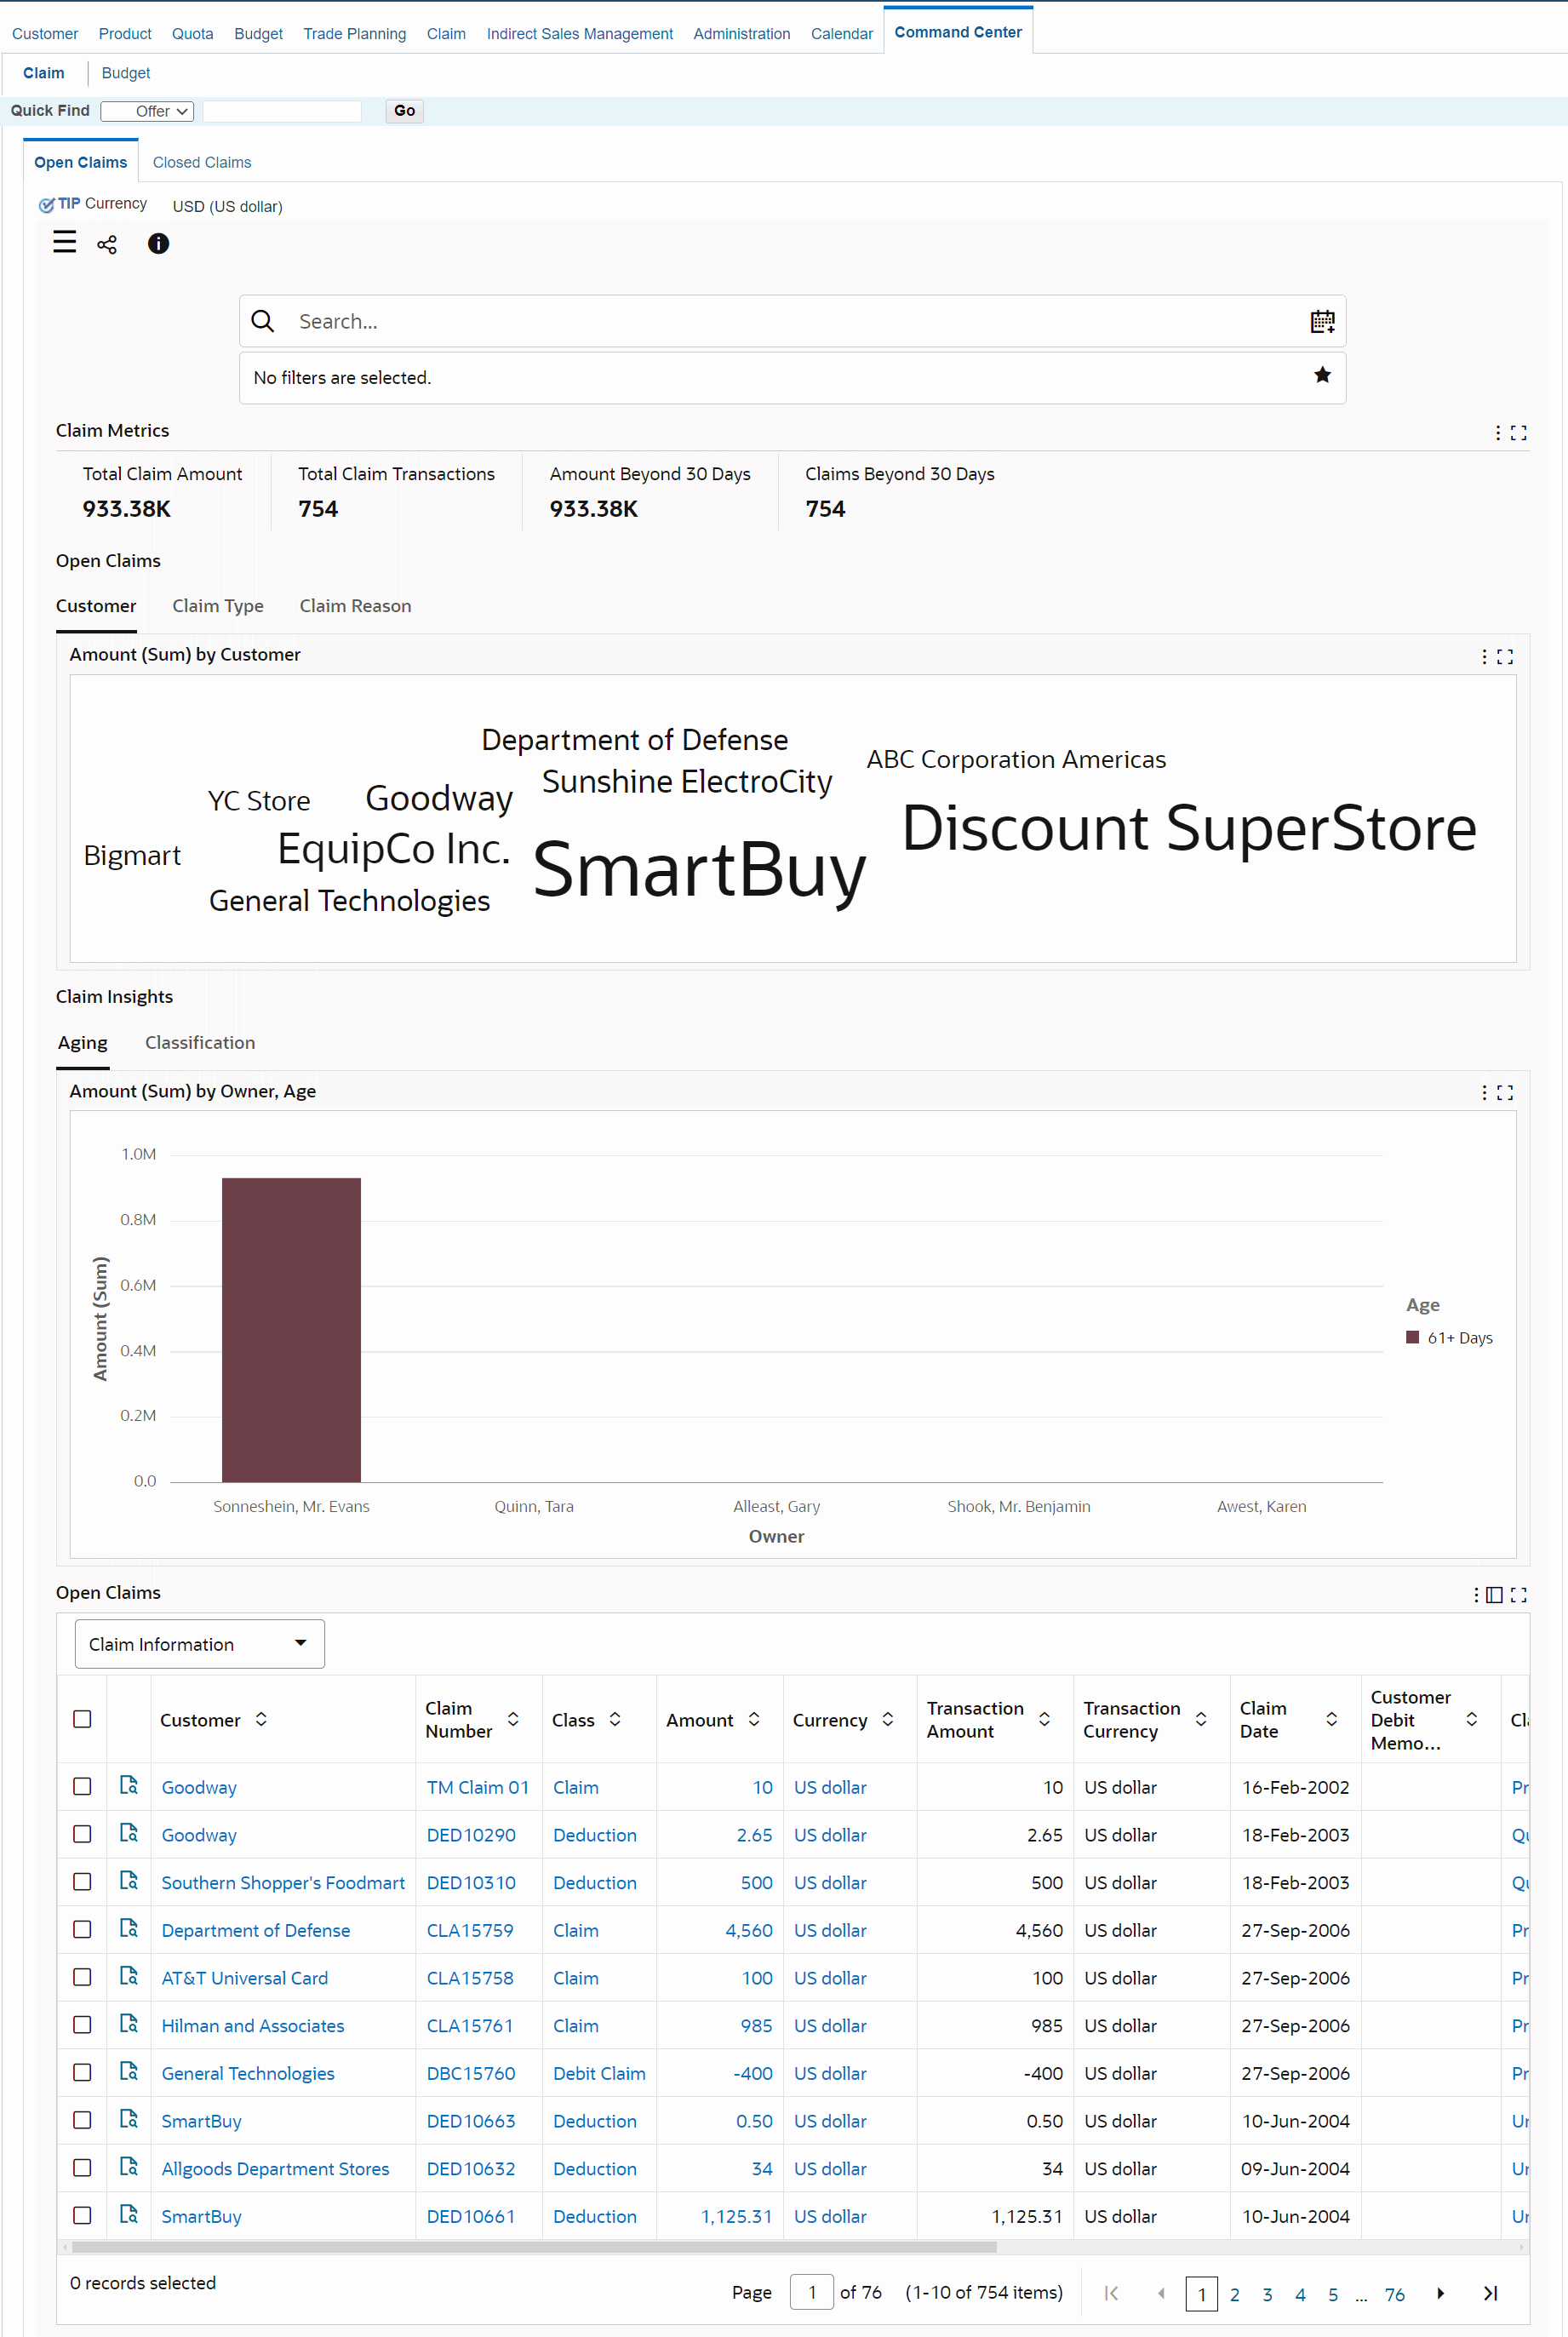
Use the Open Claims dashboard to work with open claims. Analyze data, measure claim closure workload, and readily identify amounts or transactions that need to be closed. Choose to see and to refine claim data by customer, type, reason, age, and by associated personnel. Drill down from the dashboard directly to a claim to take immediate action.
Any claim with a status New, Open, Complete, On Hold, or Pending Approval is an open claim. Analyze data and review open claims using various metrics, charts, graphs, and tables.
From the Trade Management User responsibility, navigate to the Open Claims dashboard:
(N) Channel Revenue Management > Command Center > Claims

| Components | Description |
|---|---|
| Claim Metrics (summary bar) |
|
| Open Claims (tag cloud) | The Open Claims tag clouds show:
|
| Claim Insights (chart) | The Aging tab displays information in a chart format for Amount, Transactions by Owner, and Age. You can further refine your results using the Owner, Owner by Amount, and Owner by Transactions sort options. Actions you can perform on this tab are Export, Print and Save as Image. The Classifications tab consists of the Amount by Customer and Amount by Claim Reasons charts. The Amount by Customer chart displays information that you can refine further using the Customer and Customer by Amount sort options. You can view the chart in terms of Amount or Transactions. The Amount by Claims Reasons chart displays information that you can further refine using the Claim Reason and Claim Reason by Amount sort options. |
| Open Claims (results table) | This results table displays a detailed view of open claims. |
| Options (table-level actions) |
|
Closed Claims Dashboard
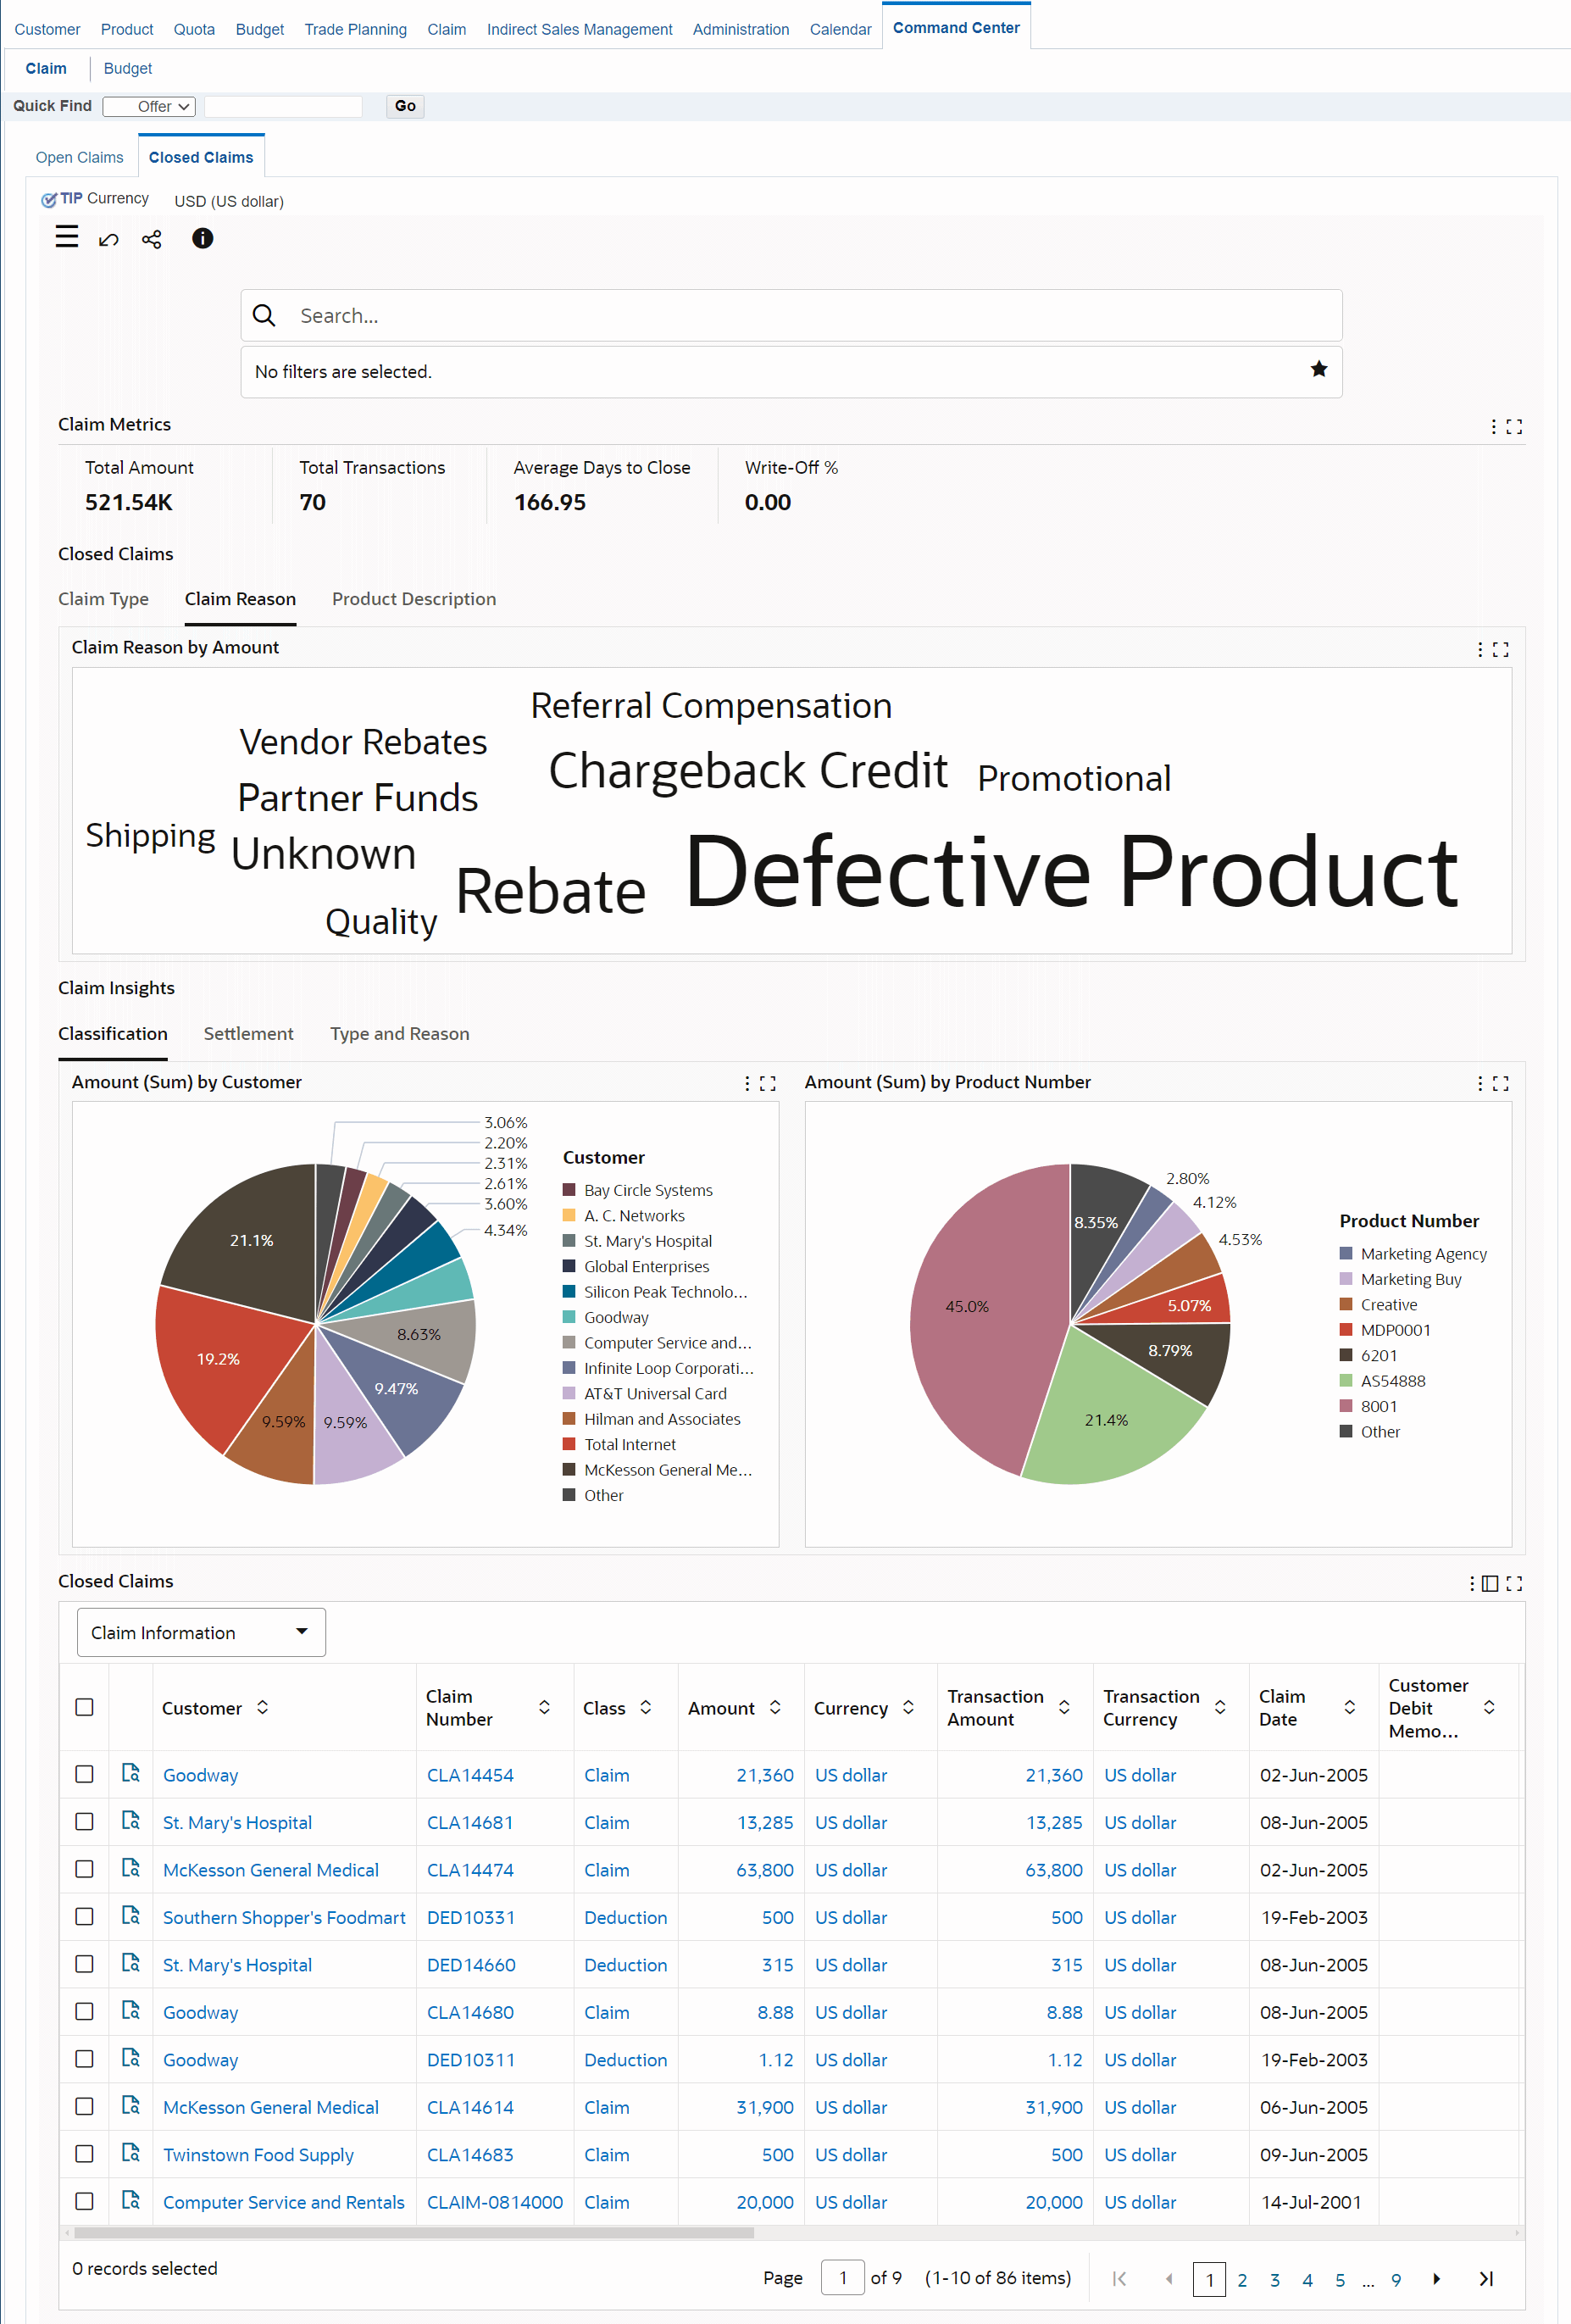
Use the Closed Claims dashboard to view closed claims. This dashboard provides a means to analyze claims after they are settled. The dashboard also displays details regarding the claim settlement. All claims with a status Approved, Pending Close, Closed or Archived are considered closed claims. Claims with a status Canceled, Duplicate, and Rejected are not extracted for reporting on this dashboard.
From the Trade Management User responsibility, navigate to the Closed Claims dashboard:
(N) Channel Revenue Management > Command Center > Claims > Closed Claims (tab)

| Components | Description |
|---|---|
| Claim Metrics (summary bar) |
|
| Closed Claims (tag cloud) | The Closed Claims tag clouds show:
|
| Claim Insights (chart) | You can view the following tabs:
|
| Closed Claims (results table) | This results table displays details for closed claims. |
| Options (table-level actions) |
|
Budgets Dashboard
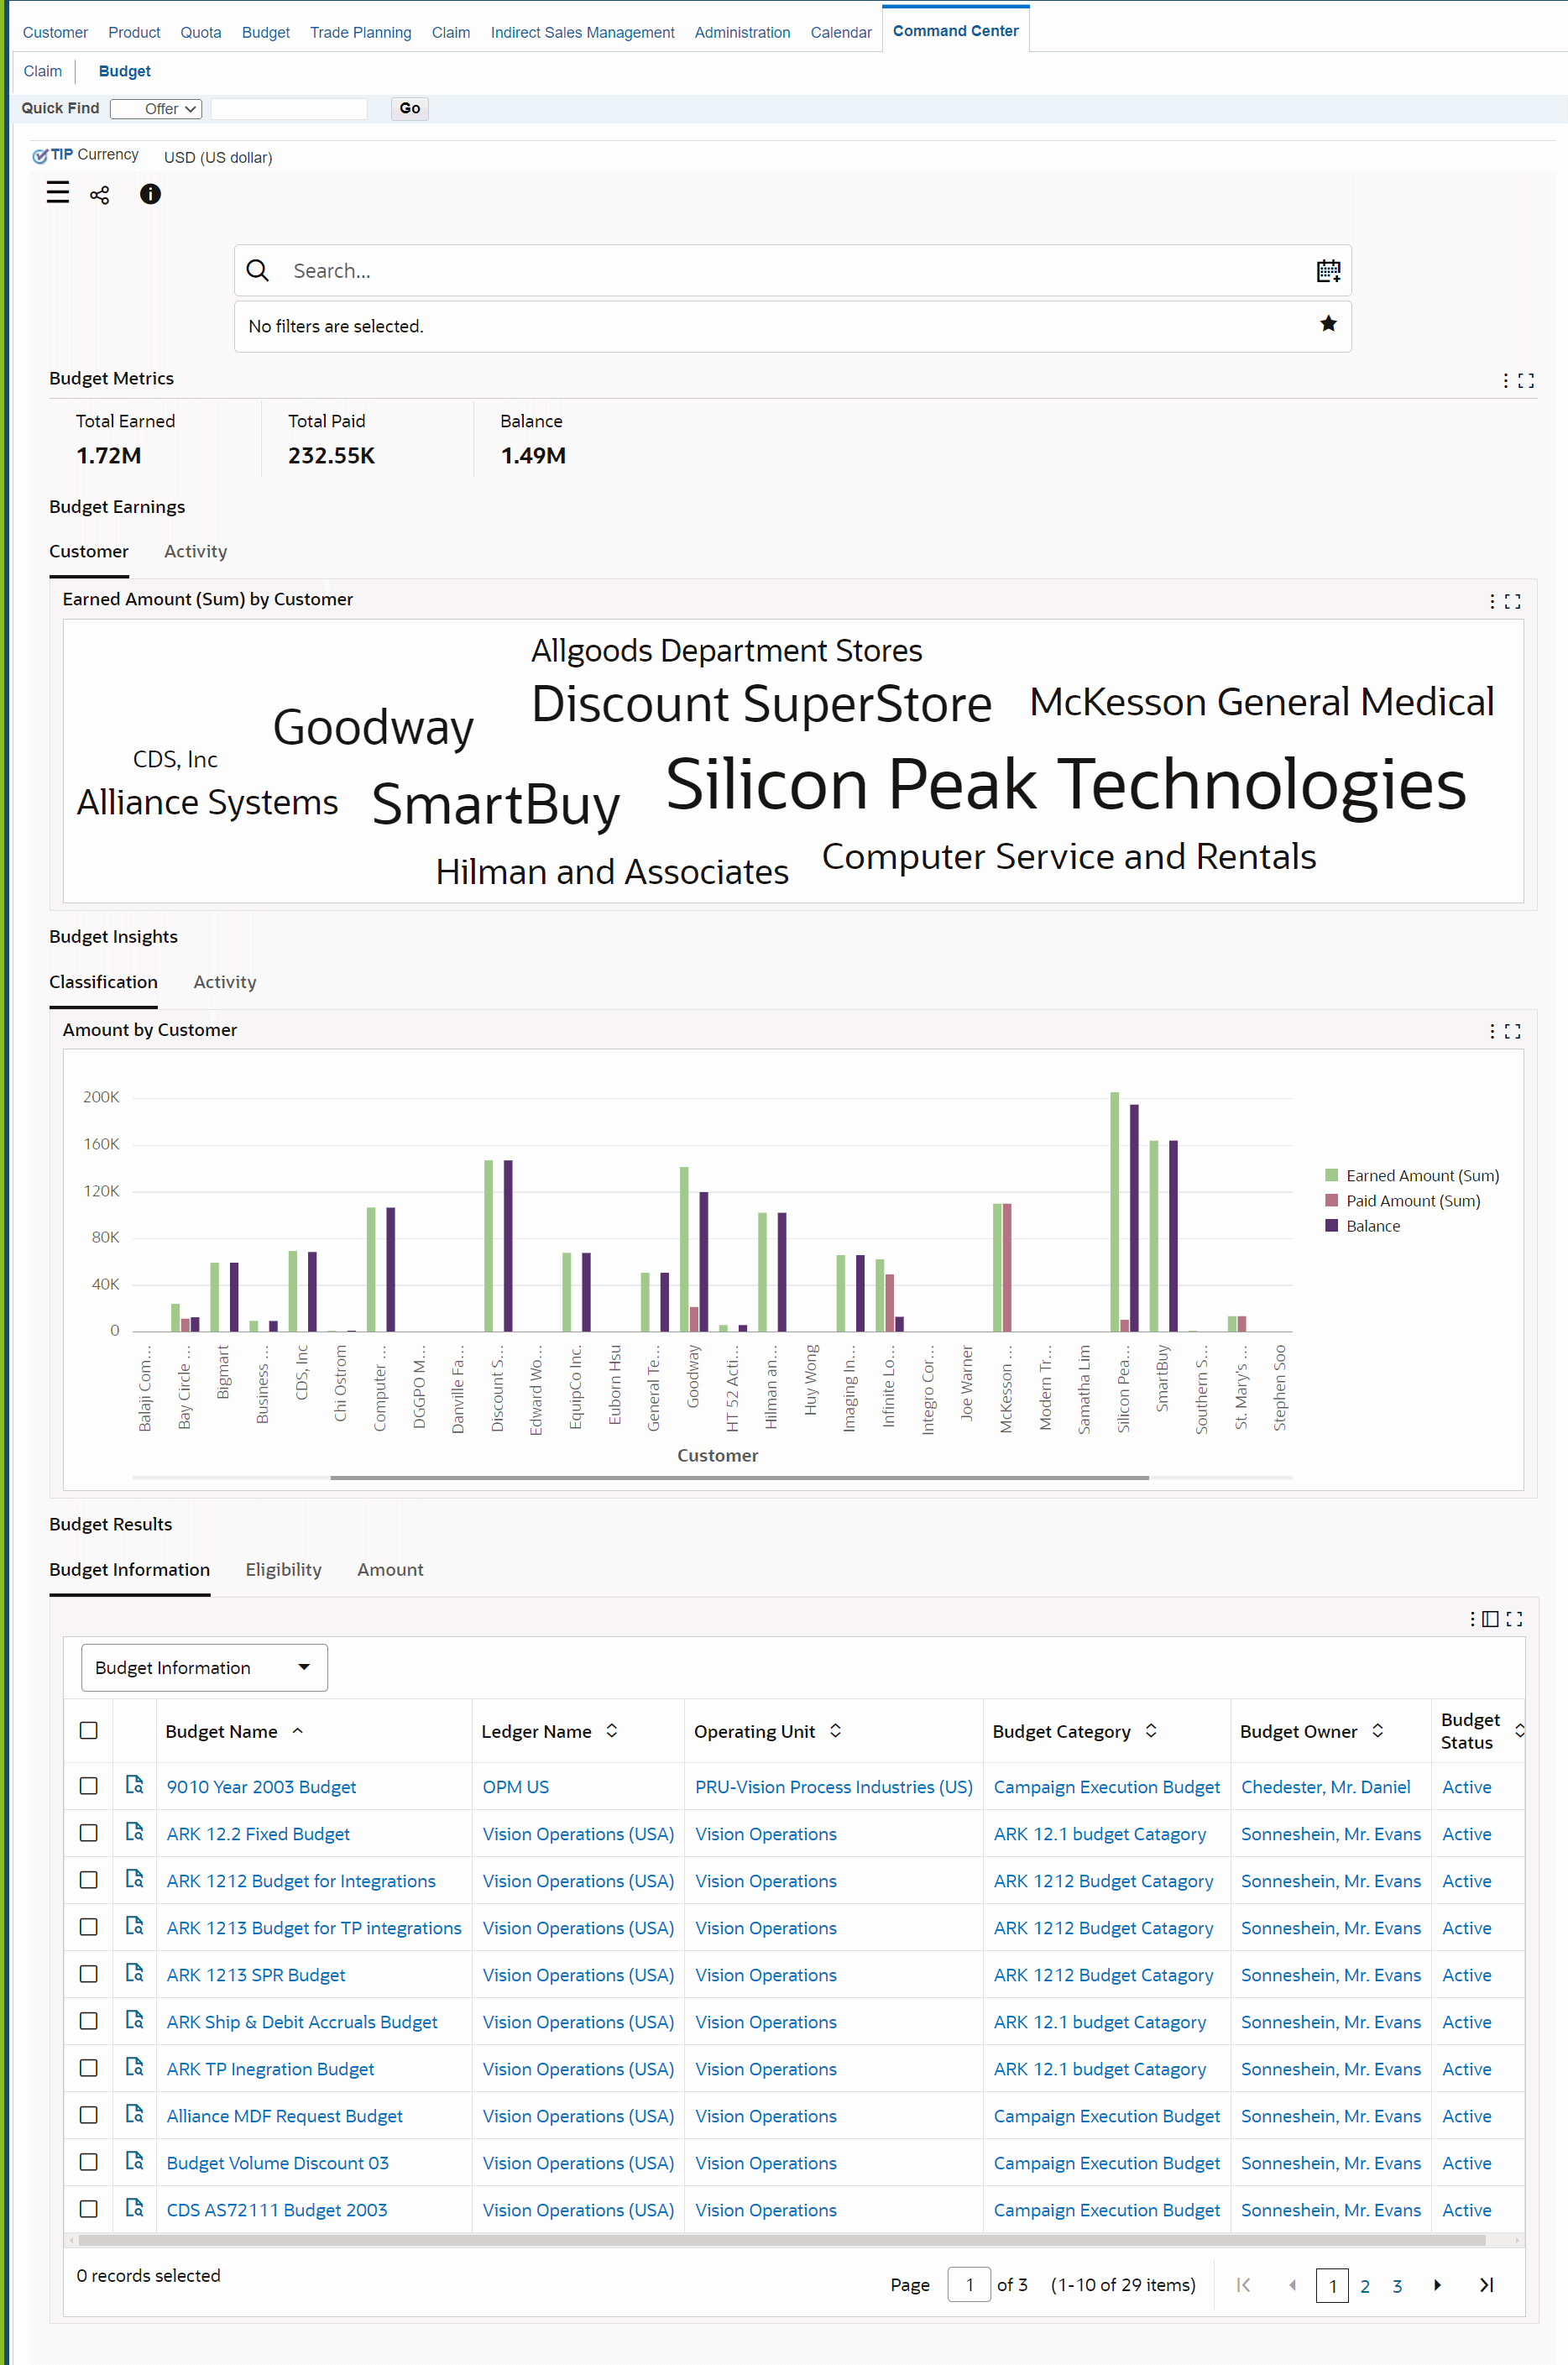
Use the Budget dashboard page to track funds and their related promotional activity transactions to forecast and execute various promotional activities to get maximum return on investments. The dashboard helps you to get insights into vendor funds and assets and effectively track customer liabilities. This dashboard provides complete visibility to funds, budgets, and promotional activities. Additionally, the dashboard provides the ability to search for ledgers, operating units, activity dates, activity, customer information, product information, and other information by selecting refinements. You can also apply refinements by selecting the metrics and alerts and portions of the graphs.
From the Trade Management User responsibility, navigate to the Budget dashboard:
(N) Channel Revenue Management > Command Center > Budget

The following table describes the various regions and components on the dashboard:
| Component | Description |
|---|---|
| Budget Metrics (summary bar) | The Budget Metrics summary bar contains the following key metrics. You can refine the dashboard data by clicking a metric value.
|
| Budget Earnings (tag cloud) | The following tag clouds displays the distribution of values for customers
|
| Budget Insights (chart) | You can view the following tabs:
|
| Budget Results (results table) | This results table contains the following tabs:
Use the Compare action to compare date for multiple rows. Use the Export action to export the search results in a comma-separated values (CSV) file format. |