Oracle Field Service Command Center
This chapter covers the following topics:
- Overview
- Field Service Tasks Summary Dashboard
- Charges Dashboard
- Setting Up Field Service Command Center
- Setup and Configuration Steps
- Setting Profile Options for Field Service Command Center
- Configuring Descriptive Flexfields for Search
- Loading Field Service Command Center Data
Field Service Command Center User Interface
Overview
Oracle Field Service Command Center enables you to search and filter Field Service Task Summary data. Field Service managers can use the Tasks Summary Dashboard to view and analyze performance data using metrics, charts, graphs, and tables. Field Service managers can use the Charges Dashboard to ensure that your customers are billed as soon as a service is provided.
Using the Tasks Summary Dashboard, the Field Service manager can:
-
View the status and state of service execution including total tasks, work-in-progress tasks, delayed tasks, and tasks at risk of missing SLA dates.
-
Gain insight into the quality of the work performed by technicians. Examples include first time fix rate, tasks started on time, tasks finished on time, and rescheduled task percentage.
-
View the nature of tasks such as task constraints, parts required, skills required, and enforcement of access hours.
-
Search, filter, and view critical metrics and data attributes to identify tasks that require attention.
-
Navigate to tasks and parts transaction pages to perform required operations.
Note: You can use the Field Service Command Center only after the installation and common configurations are completed as described in My Oracle Support Knowledge Document 2495053.1, Installing Oracle Enterprise Command Center Framework, Release 12.2. For additional ECC Overview information, see Overview of Oracle Enterprise Command Center Framework, Oracle E-Business Suite User's Guide.
Searching Enterprise Command Center Dashboards
Use the dashboard sidebar to refine (filter) the data on each dashboard. You can also Search using a keyword, value, or a specific record. The type-ahead feature suggests matches for your entry that correspond to the selected data set. When you submit a search, the search term is added to the Selected Refinements list, and the dashboard data is refined to include only records that match the search. You can add multiple refinements and remove any of them at any time. Using Saved Searches, you can create and save your searches and refer to them later. You can also edit and delete saved searches.
Use an asterisk (*) or percent sign (%) to perform a partial keyword or record search that matches any string of zero or more characters. You can also use a question mark (?) to perform a partial search that matches any single character.
Additional Information: For more information about searching for and refining data in enterprise command centers, see Search in Highlights of an Enterprise Command Center, Oracle E-Business Suite User's Guide.
Field Service Tasks Summary Dashboard
Use the Field Service Tasks Summary dashboard to view Key Performance Indicators (KPIs) and metrics for evaluating the efficiency of field operations. You can drill down into task alerts and technician performance information using guided navigation, tag cloud, charts, and a results table that displays attributes and various dimensions. You can also compare and export selected results table data.
The following is a partial display of the Field Service Tasks Summary dashboard.
From the Field Service Manager responsibility, navigate to the Field Service Tasks Summary dashboard:
(N) Field Service Manager > Tasks Summary Dashboard
Tasks Summary Dashboard


The following describes the Field Service Tasks Summary dashboard regions and components:
| Component | Description |
|---|---|
| Tasks Summary (tab layout) Task Alerts (tab) |
The Task Alerts summary bar displays the following metrics:
Note: Click a metric to refine dashboard results by that metric. The metric is then displayed as a filter in the selected refinements region. |
| Tasks Summary (tab layout) Technician Performance (tab) |
The Technician Performance summary bar displays the following metrics:
|
| Task Number (Count Distinct) by Customer (tag cloud) | The Task Number (Count Distinct) by Customer tag cloud displays the most active customers. Customers appear in relative sizes based on the least active (smallest) to most active (largest). Click on a customer in the tag cloud to refine and filter information for that customer. |
| Charts (tab layout) Open Task Timeline (tab) |
The Expected Resolution Timeline chart displays the number of open tasks by service request resolution due dates. Click the Options icon to select dimensions to filter and display open task information. You can hover over each bar in the chart to view details for that metric. You can also click on each bar and metric in the chart to filter and refine the dashboard data. The Task Number (Count Distinct) by (Group Dimension) and (Dimension) chart displays the number of tasks by selected group dimensions. Click the Options icon and select dimensions. This filters and displays open task information for these selected dimensions. You can hover over each bar in the chart to view details for that metric. You can also click on each bar and metric in the chart to filter and refine the dashboard data. |
| Charts (tab layout) Task Distribution (tab) |
The Task Distribution charts display the number of open tasks and the distribution of these tasks across selected dimension attributes. Click the options icon for each chart to select dimension attributes to filter and display open task information. You can hover over each bar in the chart to view details for that metric. You can also click on a bar or metric in the chart to filter and refine the dashboard data. |
| Charts (tab layout) Task Contraints (tab) |
The Task Constraints summary bar displays the following metrics:
Note: Click on any of the above summary bar metrics to filter and refine the data on the Field Service Tasks Summary dashboard. The Task Number chart displays the number of tasks by selected task constraints (dimensions). The Number of Required Parts or Skills (Sum) chart displays the number of required parts or skills by the selected metric attribute. Click the Options icon for each chart to select dimensions to filter and display open task information. You can hover over each bar in the chart to view details for that metric. You can also click on each bar and metric in the chart to filter and refine the dashboard data. |
| Charts (tab layout) On Time (tab) |
The Task Number by Country, Started On Time chart displays the number of tasks started on time by the selected dimensions. Click the Options icon to select dimensions to filter and display started on time task information. |
| Charts (tab layout) First Time Fix (tab) |
The Service Request Number by Country, First-Time-Fix chart displays the number of tasks fixed by the first attempt for the selected dimension attribute. Click the Options icon to select dimension attributes to filter and display first time fix task information. |
| Charts (tab layout) Rescheduled Tasks (tab) |
The Times Rescheduled (Sum) by Country chart displays the number of tasks that were rescheduled a minimum of one time for the selected dimensions. This chart also displays the distribution of these tasks based on selected dimensions. Click the Options icon to select dimension attributes to filter and display rescheduled task information. |
| Results Table | The results table displays open task detail information. You can view task detail information by selecting attribute groups from the drop-down list. Attribute groups include Task, Service Request, Customer, Date, Time, and Product. Click the Record Details icon to open the Task Details dialog box to view task details for the selected record. Click the following action links to perform the following:
Click the Update icon for a selected record to update important task attributes. The Update Task dialog box appears where you can perform immediate updates. When you click Apply, a confirmation message appears and the record is immediately updated in the dashboard. Click the Options icon to Compare selected records, or Export the data set. |
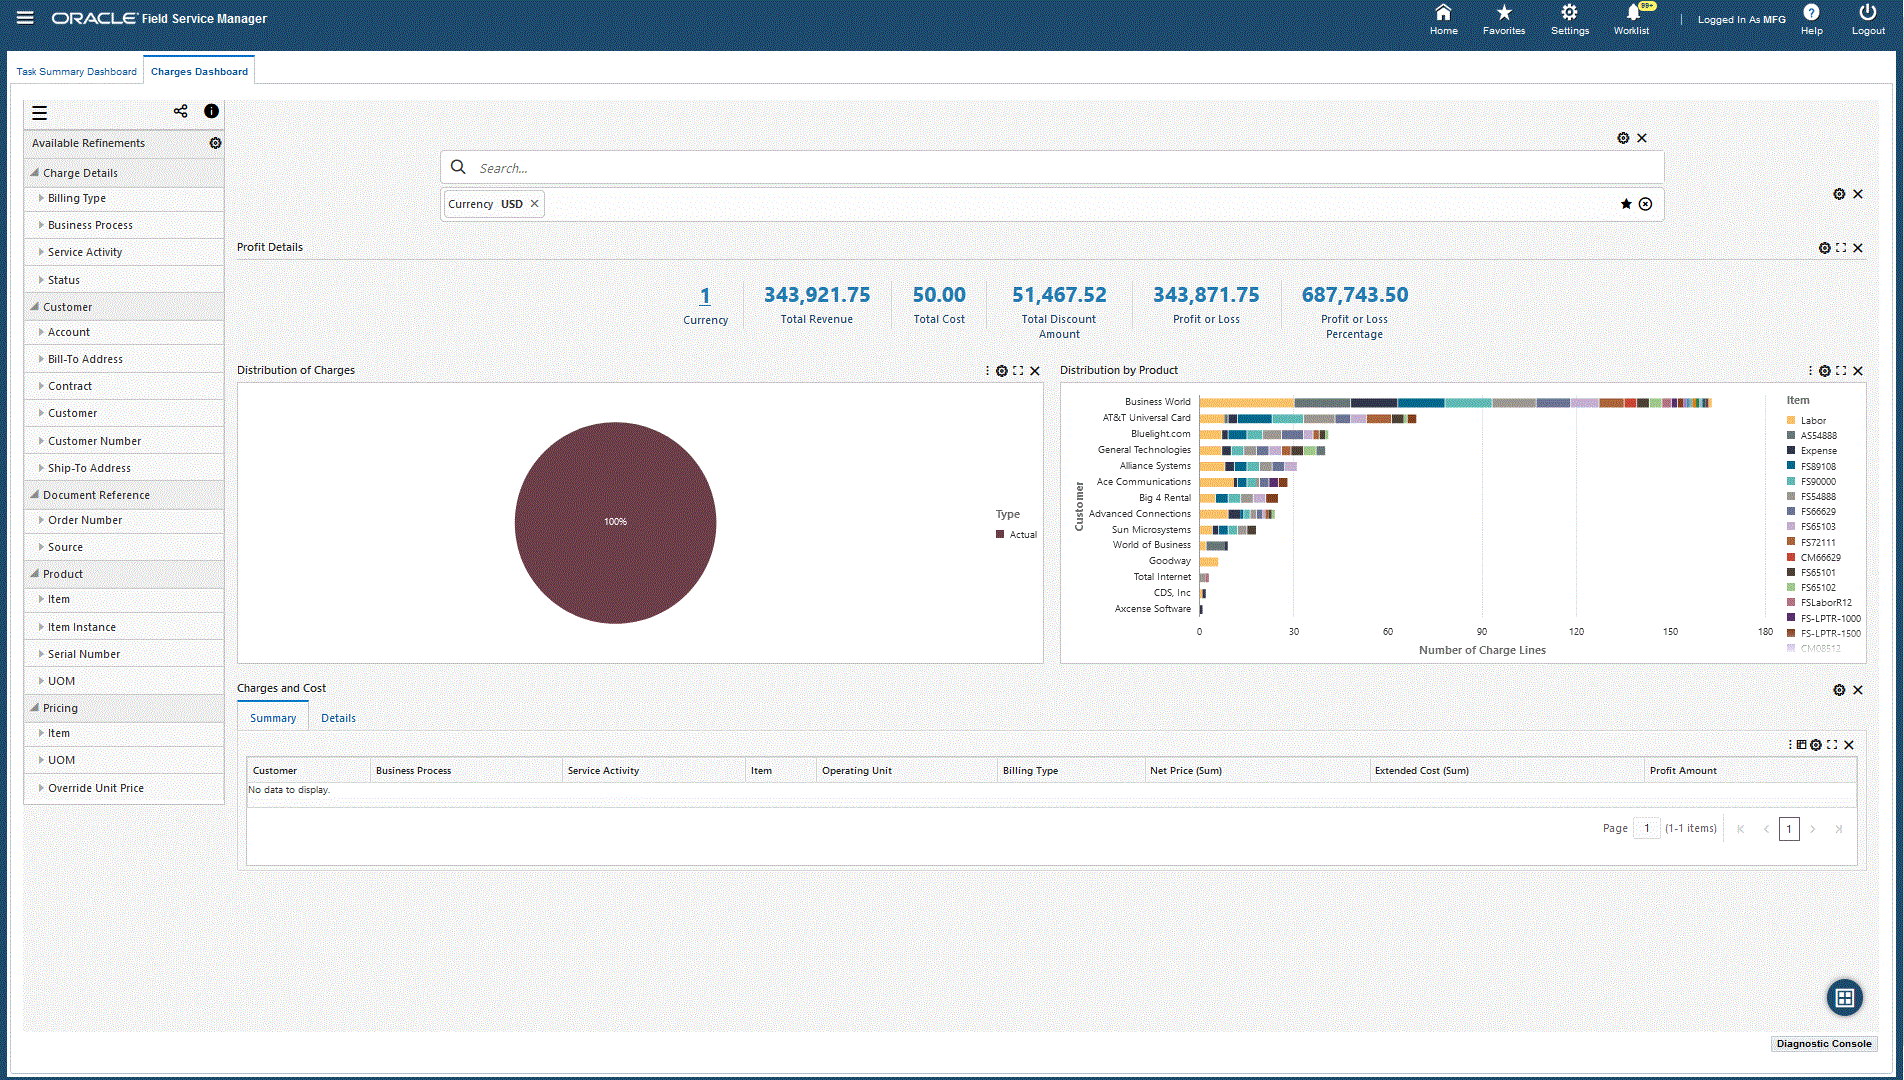
Charges Dashboard
As a field service manager, use the Charges Dashboard to ensure that your customers are billed as soon as a service is provided.
Use the dashboard to:
-
Search for service requests using notes keywords.
-
Review charges.
-
Review charge lines by status and find charge lines that are in For Review status.
-
Filter charge lines and review reasons that these lines have not automatically progressed to invoicing.
-
-
Identify stalled charge lines for review and to progress the service billing process.
From the Field Service Manager responsibility, navigate to the Charges Dashboard:
(N) Field Service Manager > Charges Dashboard
Charges Dashboard
Update Charge Dialog Box

The following table describes the dashboard:
| Component | Description |
|---|---|
| Service Request (search box) | Users can enter notes keywords in the Service Request Search box. You can search using keywords in both service request notes and task notes that return a list of service requests that match the criteria. |
| Profit Details (summary bar) | This summary bar contains the following key metrics:
|
| Distribution of Charges (chart) | This chart shows the charge lines that require urgent attention. This chart displays the number of charge lines for different statuses (new, submitted, failed, needs review, and so on.) You can select dimensions to view the distribution of types and source of charge lines. To export the chart as an image or a comma-separated values (CSV) file format, click the Options icon and select the Export action. |
| Distribution by Product (chart) | This chart shows the number of charge lines. You can click the Options icon and select group dimensions to see the number of charge lines by attributes such as customer, billing type, service activity, and the source. To export the chart as an image or a comma-separated values (CSV) file format, click the Options icon, and select the Export action. |
| Charges and Cost (tabbed component) Summary (tab) |
The Charges and Cost Summary table shows a summary view of charges, cost, and profit based on attributes that include Customer, Business Process, Service Activity, Item, Operating Unit, and Billing Type. The following actions are available from the Options icon in this results table:
|
| Charges and Cost (tabbed component) Details (tab) |
The Charges and Cost Details results table shows attributes pertaining to charges. From the drop-down list, you can select views to display charges by:
You can perform the following row-level actions:
The following actions are available from the Options icon in this results table:
|
Field Service Command Center ConfigurationField Service Command Center Configuration
Setting Up Field Service Command Center
Setup and Configuration Steps
Setup and Configuration Steps
To complete setup of the Oracle Field Service Command Center, you must perform the following steps:
Setting Profile Options for Field Service Command Center
Set the following Field Service profile options to specify how the Field Service Command Center controls access to and processes data:
| Profile Option Name | Description | Default Value |
|---|---|---|
| Service: Command Center - Load service requests updated within last 'n' days. | The ECC data load program loads all service requests and associated tasks that were updated within the last 'n' days as defined by this profile. | Null |
| Service: Jeopardy - Reaction Date Buffer (in Days) | This profile defines the threshold to define At Risk service requests or tasks. If the service request Respond By Date falls within the threshold set, then the service request is considered 'At Risk.' | Null |
| Service: Jeopardy: Resolution Date Buffer (in Days) | This profile defines the threshold to define At Risk service requests or tasks. If the service request Expected Resolution Date falls within the threshold set, then the service request is considered 'At Risk.' | Null |
Configuring Descriptive Flexfields for Search
Enterprise command centers support Descriptive Flexfields (DFFs) that enable you to search on DFF attributes. After you configure DFFs, you must run the data load process, which ensures that the DFF attributes are available in the command center.
For additional information on configuring and customizing flexfields, see the Oracle E-Business Suite Flexfields Guide and My Oracle Support Knowledge Document 2495053.1, Installing Oracle Enterprise Command Center Framework, Release 12.2.
The following table describes the DFFs available in the Tasks Summary Dashboard:
| Dashboard | Data Set | DFF Title | DFF Name | DFF Attribute Group Name |
|---|---|---|---|---|
| Tasks Summary | csf-tasks | Tasks Additional Information | JTF_TASKS_B | Tasks Additional Information |
Loading Field Service Command Center Data
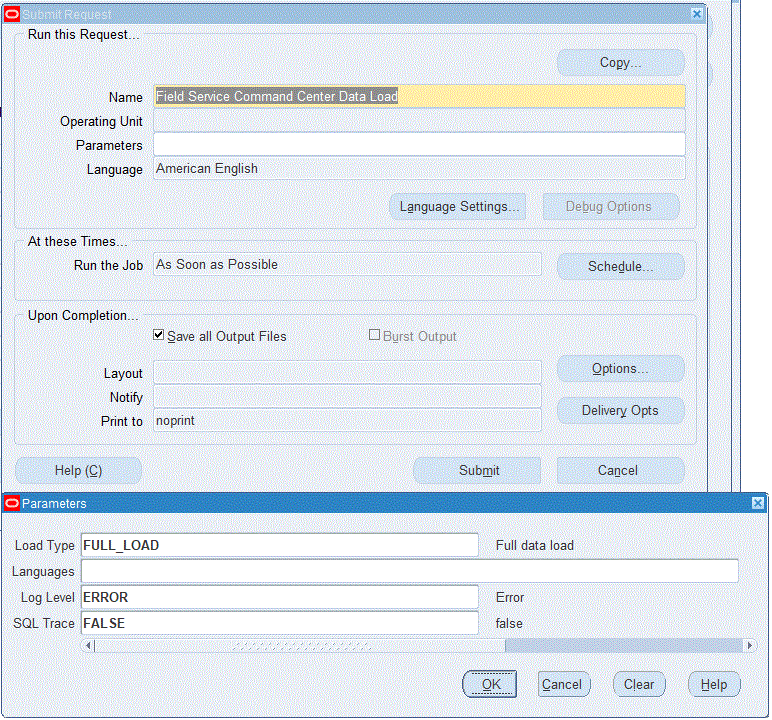
Run the concurrent program Field Service Command Center Data Load to load Oracle E-Business Suite data into the Field Service Command Center. You can find this concurrent program from the Submit Request window.
Note: Before you load data from Oracle E-Business Suite into the Field Service Command Center, ensure that your EBS data is accurate and current by running any concurrent programs that impact attributes used in the command center.
Run the concurrent program from the Submit Request window.
To load Landed Cost Data into the Field Service Command Center
-
Navigate to the Field Service Command Center Data Load concurrent program. The Parameters window appears.
-
In the Name field, enter a data load concurrent program. For example, enter Field Service Command Center Data Load.
-
Select the appropriate load type:
-
Full Load: Loads all Field Service data and is required to be run for the first data load. If you select and run full load for subsequent requests, then this program clears all Field Service data from ECC and loads fresh data.
-
Incremental Load: Loads the data modified and updated from the previous load only. Incremental load should be scheduled to run as often as required to keep the ECC dashboard current.
-
-
Enter one or more language codes in the Languages field for the output. For multiple language codes, use the format AA,BB,NN. For example, enter US,AR,KO. If the field is blank, then the data will be loaded for the base language only (usually US).
-
Select the Log Level that you want the program to report. The default value is Error.
-
Select True to enable SQL trace. Otherwise, select False.
-
Submit the concurrent request.
-
Review your request using the Requests page.
-
Monitor data loading using the Data Load Tracking page of the ECC Developer responsibility.
To review request details
-
From the menu, click Requests. The Find Requests window appears.
-
Highlight the All My Requests radio button and click Find. The Requests window appears and displays all of your requests.
-
In the Requests window, select the row that contains your request and then click View Details. The Request Detail window appears and displays the ECC- Run Data Load information.
-
Click OK to exit and close the window.