Oracle Incentive Compensation Command Center
This chapter covers the following topics:
- Incentive Compensation Command Center Overview
- Recent Jobs Dashboard
- Quality by Phase Dashboard
- Paysheet Console Dashboard
- Jeopardy by Phase Dashboard
- Performance Evaluation Dashboard
- Compensation Plan Visualizer
Incentive Compensation Command Center
Incentive Compensation Command Center Overview
Oracle Incentive Compensation Center is built on the Enterprise Command Center Framework. With it, sales plan administrators and sales compensation managers can gain strategic insight through facilitated analysis of large amounts of transaction data. With the command center metrics, you can make better decisions to unlock strategic benefits to the sales force. You can navigate directly to the underlying application to take quick corrective action.
Use the Oracle Incentive Compensation Command Center to:
-
Improve sales alignment.
-
Proactive identification of sales attainment and performance across roles, plans and periods.
-
Identify plan communication issues.
-
Drive desired selling behavior.
-
-
Minimize overpayment.
-
Gain insight into the lifecycle of a transaction.
-
Perform quality assurance across all phases of compensation processing.
-
Identify and resolve quality issues.
-
-
Better sales morale for increased sales.
-
Review compensation plans for a specific product and revenue class using a compensation plan visualizer.
-
Research and resolve commission and payment concerns.
-
Remove pay obstacles and delays.
-
Investigate at risk or unpaid commissions.
-
Resolve compensation disputes.
-
Compare quotas versus achievement.
-
Using Incentive Command Center Dashboards
A typical process flow includes the following steps in Oracle Incentive Compensation (OIC) processing:
-
Collect, load, and calculate transactions
-
Review outcome of recent jobs
-
Review quality of calculated earnings
-
Process payments
-
Validate payments
-
Assess readiness to pay
Use the following dashboards to manage process flows:
-
Recent Jobs: Compensation analysts and managers use this dashboard to review job outcomes and to manage and assess batch and online jobs. See Recent Jobs Dashboard.
-
Quality by Phase: Compensation administrators use this dashboard to review calculated earnings, to validate payments, and to identify total commissions and percentage of sales. See Quality by Phase Dashboard.
-
Paysheet Console: This dashboard provides visibility across payruns and supports a flexible approval process. Financial directors and compensation analysts use this dashboard to assess and review paysheets. You can see how paysheet processing is progressing for current periods, review paysheets, and measure how outstanding paysheets are assigned to analysts. Also use this dashboard to identify and drill into unpaid commissions and examine unpaid transactions. See Paysheet Console Dashboard.
-
Jeopardy by Phase: Finance directors and compensation managers use this dashboard to assess whether incentives processing is on schedule and to take corrective action if needed to ensure that incentives are paid on time. See Jeopardy by Phase Dashboard.
-
Performance Evaluation: Sales plan administrators and compensation managers use this dashboard to identify compensation attainment and performance trends. See Performance Evaluation.
-
Compensation Plan Visualizer: Compensation managers and sales compensation analysts use this dashboard to analyze total compensation trends and payments across plans and periods for sales representatives. See Compensation Plan Visualizer.
Note: You must complete the Incentive Compensation Command Center configuration and setup after the installation and common configurations are completed as described in My Oracle Support Knowledge Document 2495053.1, Installing Oracle Enterprise Command Center Framework, Release 12.2. For additional ECC Overview information, see Overview of Enterprise Command Centers, Oracle E-Business Suite User's Guide.
Searching Enterprise Command Center Dashboards
Use the sidebar to search for and refine (filter) the data on a dashboard. You can select a value or record from the Available Refinements component, or you can use the Search field to find a keyword, a value, or a specific record. When you submit a search, or select an available refinement, the search term or refinement is added to the Selected Refinements list, and all of the dashboard data is refined. You can add multiple refinements and remove any of them at any time. Use Saved Search to create and save your search. You can edit, delete, or refer to this saved search. You can also use data sets to further refine your search.
Use an asterisk (*) or a percent sign (%) to perform a partial keyword or record search that matches any string of zero or more characters. You can also use a question mark (?) to perform a partial search that matches any single character.
Additional Information: For more information about searching for and refining data in enterprise command centers, see Search in Highlights of an Enterprise Command Center, Oracle E-Business Suite User's Guide.
Recent Jobs Dashboard
See Incentive Compensation Command Center Overview.
Incentive compensation is accomplished through a series of jobs. You kick off jobs for collection, for load, for calculation, and for creating paysheets. The Recent Jobs dashboard brings together information from the concurrent manager and from jobs across all phases in a single dashboard.
As a compensation analysts or manager, use the Recent Jobs dashboard to:
-
Assess the outcome of job processing.
-
Refine results using recent refinements, failed job alerts, job clouds, or charts.
-
Review job status charts to identify failed jobs, subsequent jobs affected, and the context in the processing cycle.
-
Drill down to logs.
-
Drill down to related transactions in the Quality by Phase dashboard.
You can analyze data using various metrics, charts, graphs, and tables.
Access the Recent Jobs dashboard using the following navigation:
(N): Compensation Manager (responsibility) > Quality Management > Recent Jobs
The following table describes the dashboard:
Recent Jobs Dashboard
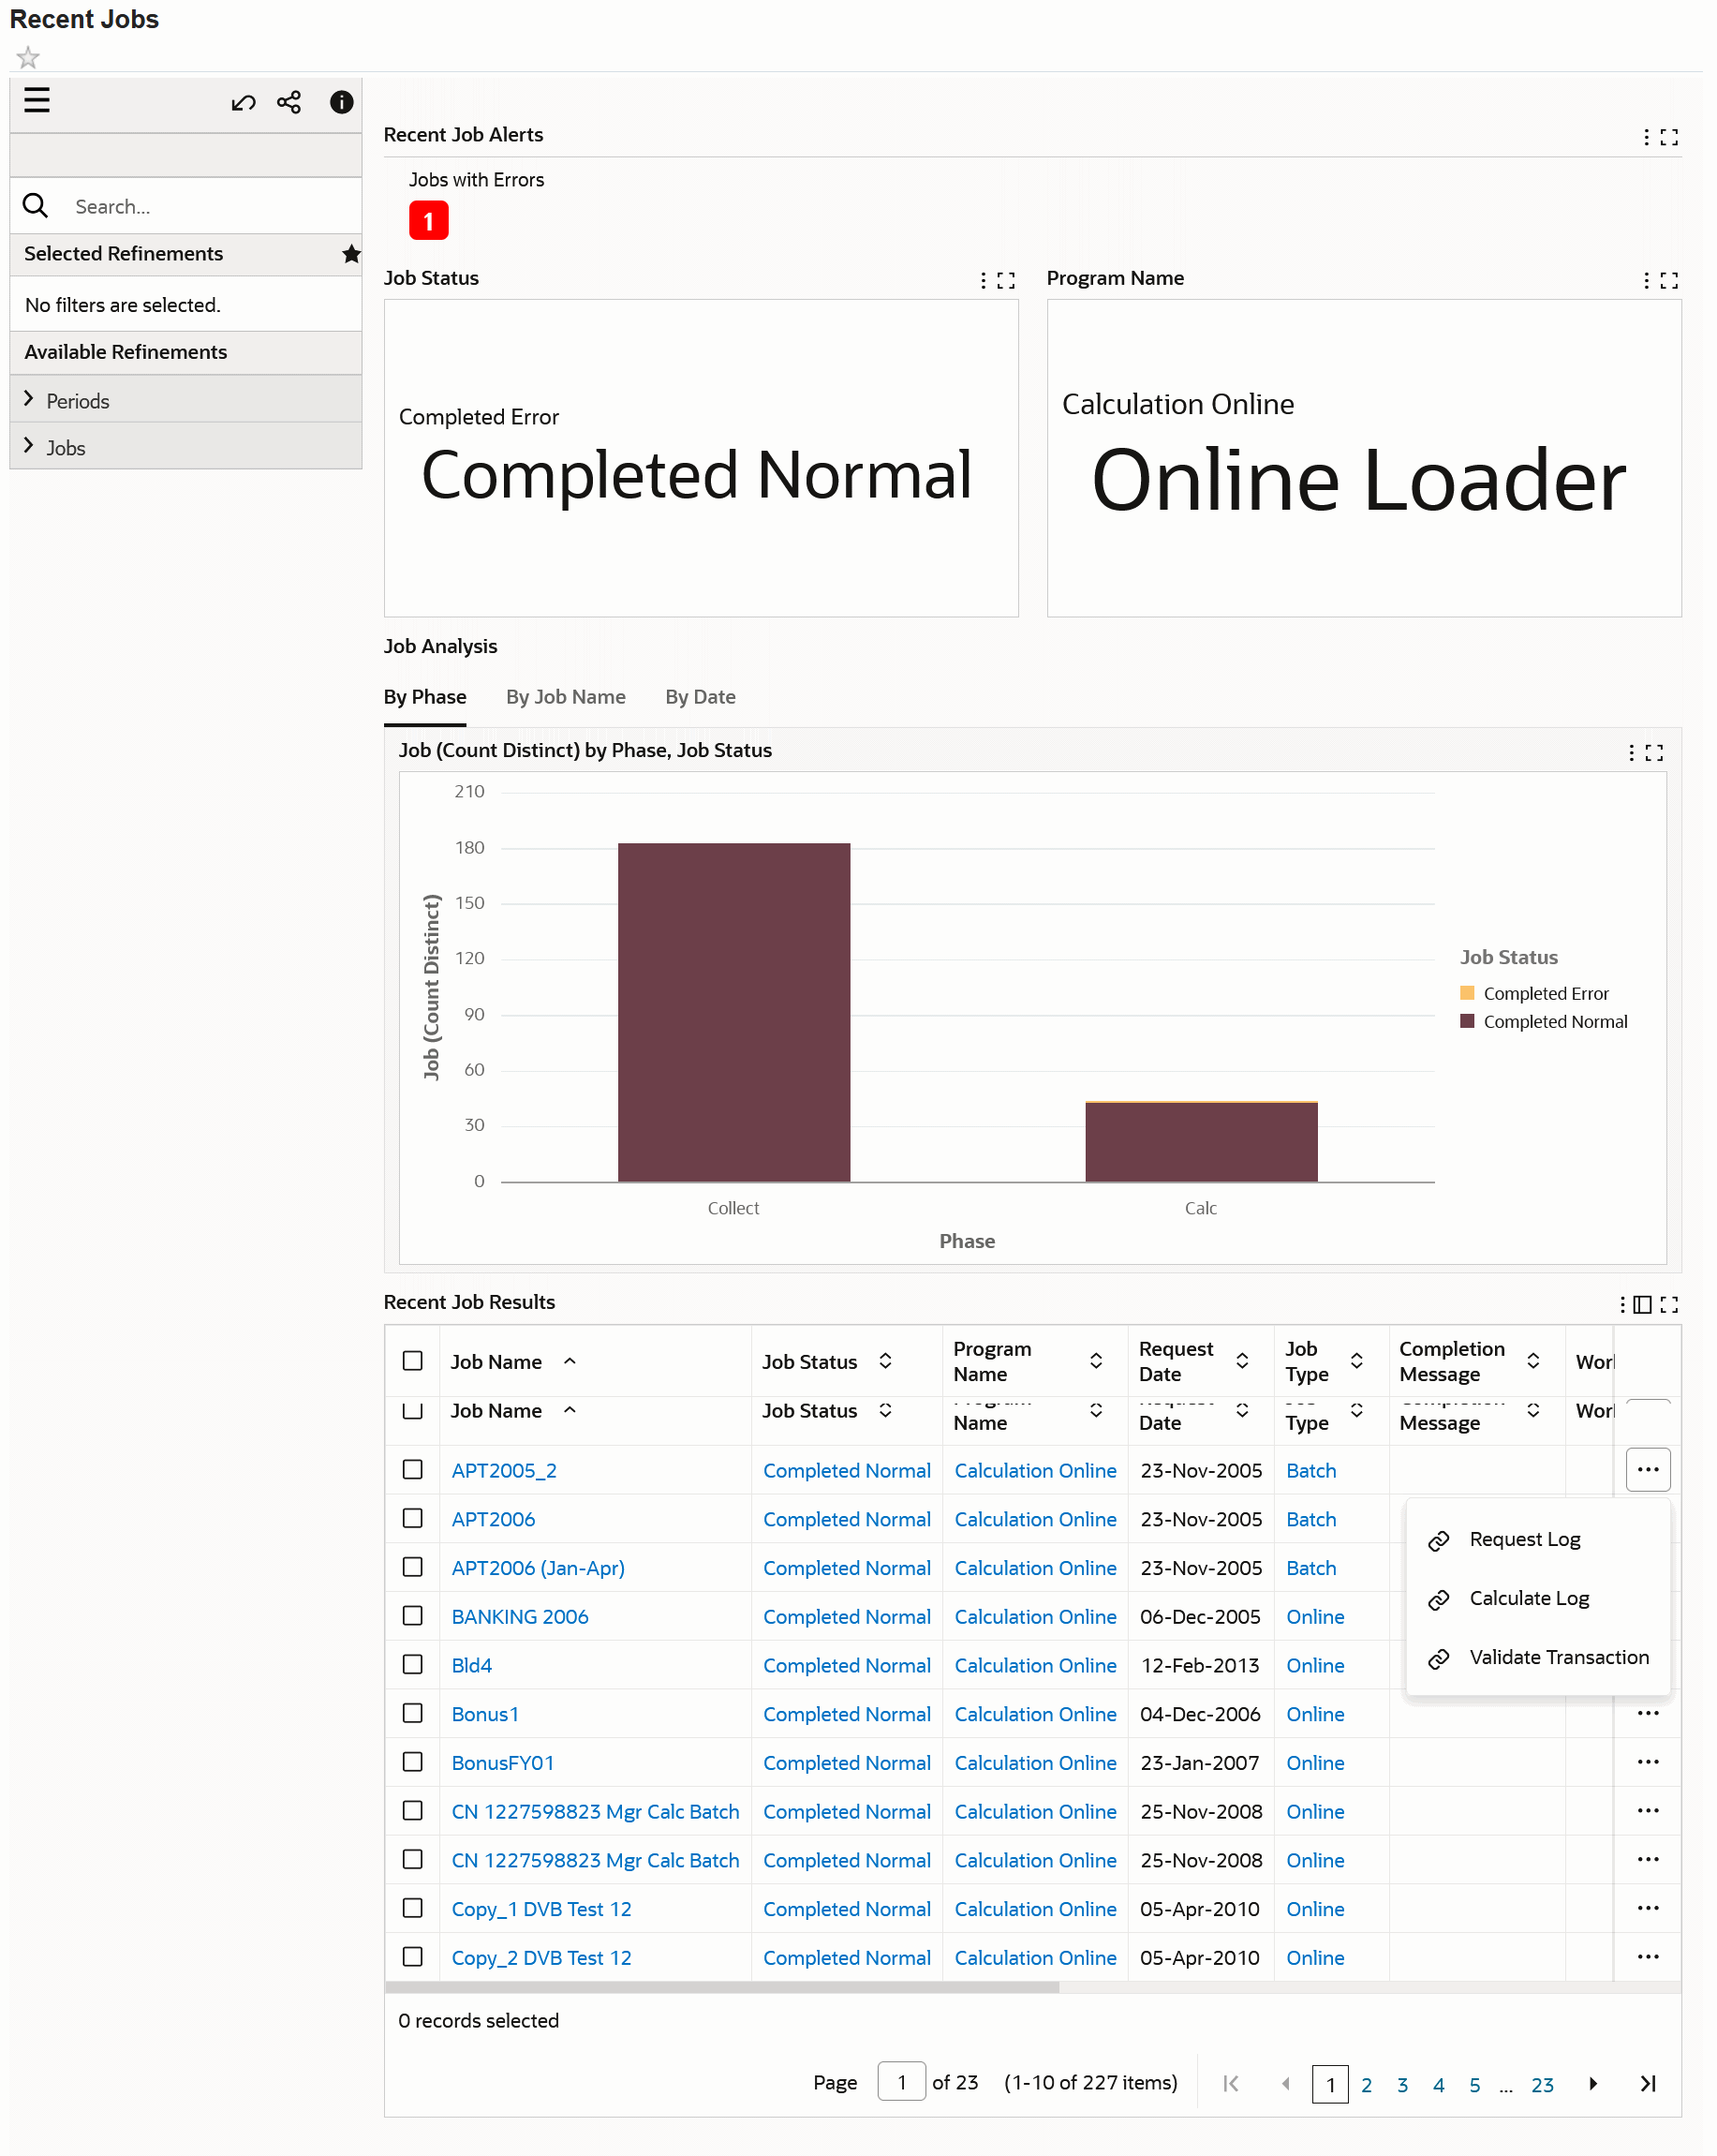
| Component | Description |
|---|---|
| Recent Job Alerts (summary bar) | The Jobs with Errors metric displays the number of jobs that failed. Click the metric to view details of jobs and programs. |
| Job Status (tag cloud) | This tag cloud displays the job status by number of records. |
| Program Name (tag cloud) | This tag cloud displays the program name by number of records. |
| Job Analysis (charts) | This tab displays the following charts.
|
| Recent Job Results (table) | This results table displays details of recent jobs such as the job name, the job status, and the job type. To perform the following actions, click the row-level Actions icon and select an action.
|
Quality by Phase Dashboard
See Incentive Compensation Command Center Overview.
Incentive Compensation processing is sequential. In assessing the completeness and accuracy of calculated earnings, collection must be validated prior to load and load must be validated prior to calculation. In other words, the quality of each phase is based on the success of its prior phases. The Quality by Phase dashboard links together transactional information from all phases of processing (collect, calculate, and pay) into a single dashboard so that quality of the processing can be assessed.
As a compensation analyst or manager, use the Quality by Phase dashboard to:
-
Refine results by current period or drill down from the Recent Jobs dashboard.
-
Review conversion metrics and results by phase.
-
Collection: Validate transaction count and values from all sources (incoming and explosion of credited transactions).
-
Load: Validate transaction count and value of load.
-
Calculation: Validate transaction count and value of calculated transactions or unposted earnings.
-
Pay: Validate completeness and accuracy of posted earnings, payments, and paysheets.
-
-
Drill down and take action in Oracle Incentive Compensation.
-
Drill down to fix transactions, resubmit calculations, and refresh paysheets.
-
Research disputes, understand the depth and breadth of the root causes and provide appropriate resolution.
Lifecycle Phases
To determine how a transaction is processed in Incentive Compensation and to show its status in a single glance, the Incentive Compensation Command Center uses lifecycle phases. In the Available Refinements list, select Interface Processing and then the Lifecycle Status refinement to know the status of transactions.
Lifecycle Phases
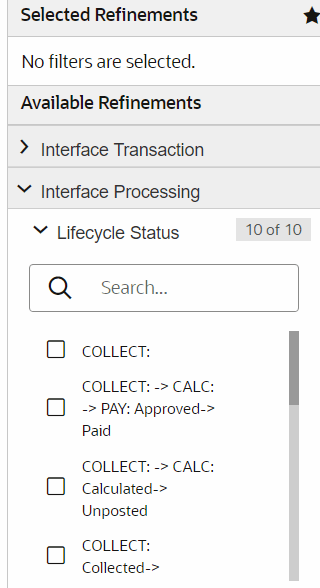
The lifecycle phases include:
-
Collect
-
Calculate
-
Pay
-
The fourth phase is the single lifecycle status, which is the sum of all the three phases (Collect + Calculate + Pay).
The following examples explain the various statuses of transactions.
-
A Paid transaction has the following lifecycle phases:
-
Collect phase: The transaction is collected and loaded (COLLECT: Collected > Loaded).
-
Calculate phase: The transaction is calculated and posted (CALC: Calculated > Posted).
-
Pay phase: The transaction is approved and paid (PAY: Approved > Paid).
A Paid transaction is expressed as COLLECT: Collected > Loaded > CALC: Calculated > Posted > PAY: Approved > Paid
-
-
A Paid Manual transaction has the following lifecycle phases:
-
There is no processing in the Collect phase as the transaction is not collected.
-
Calculate phase: The transaction is calculated and posted (CALC: > Calculated > Posted).
-
Pay phase: The transaction is approved and paid (PAY: Approved > Paid).
This transaction is expressed as COLLECT: > CALC: > Calculated > Posted > PAY: Approved > Paid
-
-
An Unpaid commission earning has the following lifecycle phases:
-
Collect phase: The transaction is collected and loaded (COLLECT: Collected > Loaded).
-
Calculate Phase: The transaction is calculated but not posted (CALC: -> Calculated > Unposted).
This transaction is expressed as COLLECT: Collected > Loaded > CALC: Calculated > Unposted
-
Note: Implementers can use the information provided in How Lifecycle Statuses and Phases are Derived, Oracle Incentive Compensation Implementation Guide to understand transaction processing.
You can analyze data using various metrics, charts, graphs, and tables.
Access the Quality by Phase dashboard using the following navigation:
(N): Compensation Manager (responsibility) > Quality Management > Quality by Phase
Quality by Phase Dashboard
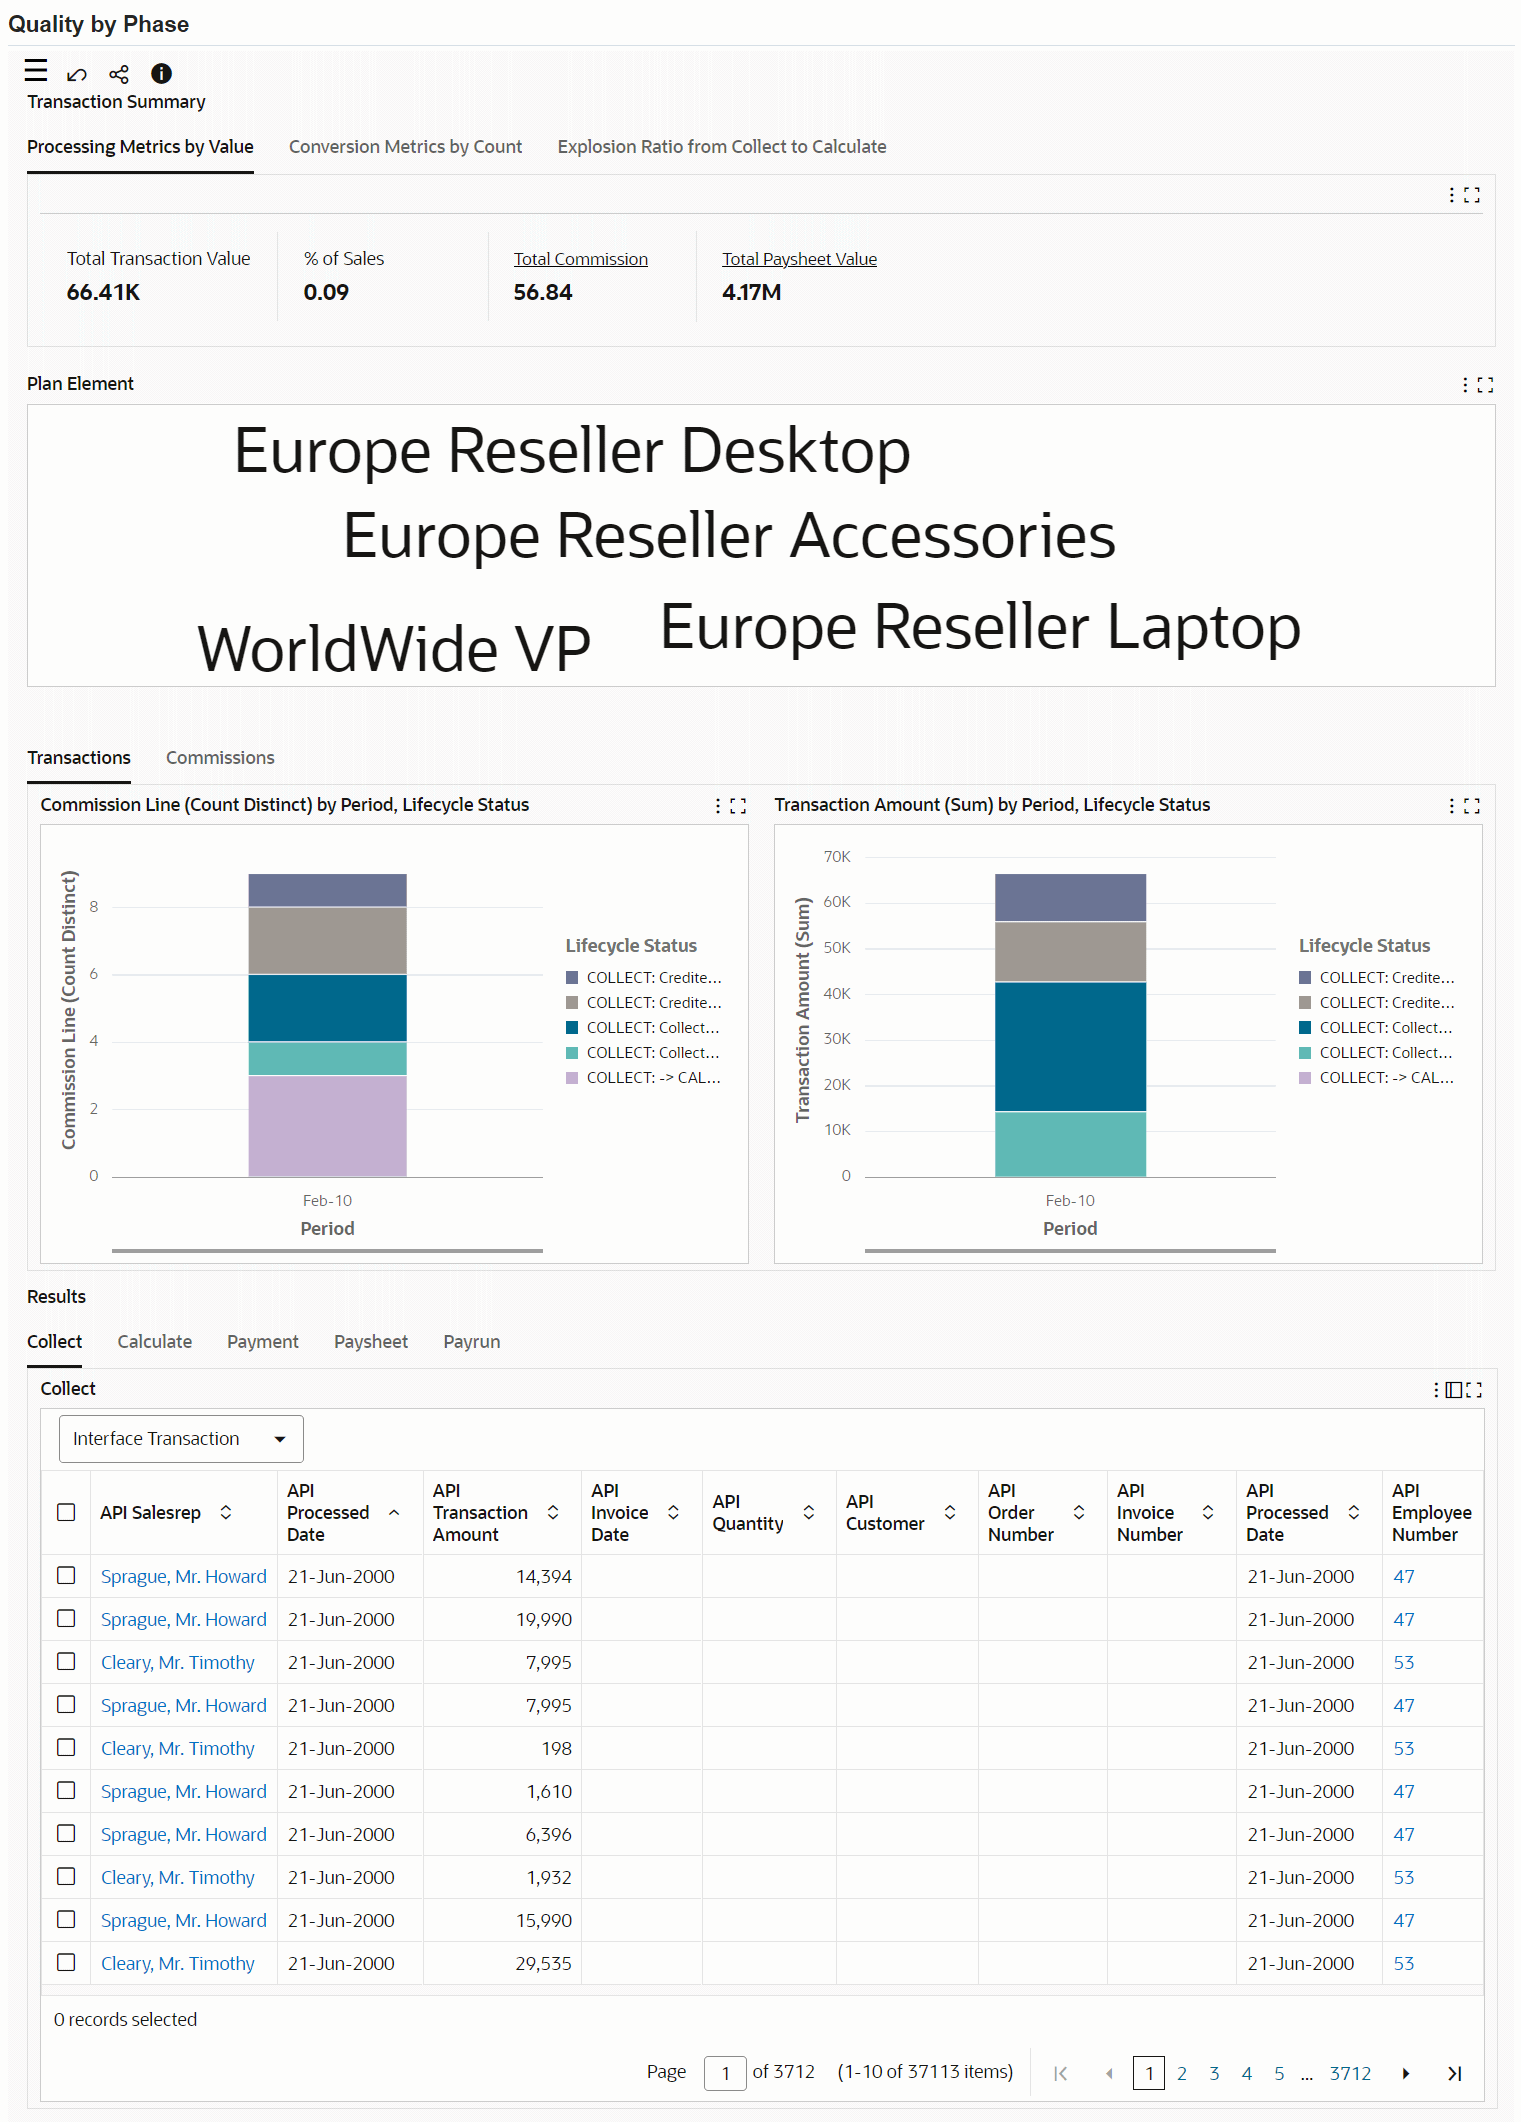
The following table describes the dashboard:
| Component | Description |
|---|---|
| Processing Metrics by Value (summary bar) | This summary bar provides metrics on the value of commissions, transactions, and paysheets.
|
| Conversion Metrics by Count (summary bar) | This summary bar provides conversion percentages and the number of transactions for key stages of processing. The conversion metrics are:
|
| Explosion Ratio from Collect to Calculate (summary bar) | This summary bar shows the following metrics:
Several processes, including crediting, rollup, and data population, create additional transactions. For example, you roll up sales representative transactions to their sales management. You can use sales crediting rules to give credit to your overlay specialists. You can also create additional transactions using overlapping plan elements. Therefore, a sale can go towards a commission and also towards a monthly bonus. Use explosion ratio metrics to validate your sales hierarchies and sales credit rules. |
| Plan Element (tag cloud) | This tag cloud shows the plan element names according to the number of commission line records for each plan element. |
| Transactions (tab) | This tab displays the following charts:
|
| Commissions (tab) | This tab displays the following charts:
|
Results Tables
The Quality by Phase results tables show information about collecting and calculating transactions. These tables also provide detailed information about payments, paysheets, and payruns. In the Collect tab, the Interface Transaction option shows attributes of a transaction as it enters a specific phase. The Interface Processing option displays processing attributes of the Collect phase and help to understand how a transaction is processed in a phase. This information enables you to validate each phase.
Use links in the following tabs to performs actions:
-
Calculate: To update the transaction, click the Edit Transaction link to navigate to the Update Transaction page.
-
Paysheet: To view paysheet details, click the Paysheet Detail link to navigate to the Paysheet page in Incentive Compensation.
-
Payrun: To view payment summary, click the Payrun Summary link to navigate to the Payment Batch Summary page in Incentive Compensation.
Paysheet Console Dashboard
See Incentive Compensation Command Center Overview.
The Paysheet Console dashboard provides visibility across payruns and supports a flexible approval process. As a compensation analyst or a finance director responsible for payment processing, you need to review how the paysheet processing is progressing for current periods, and review paysheets to see how many outstanding paysheets are assigned to which analysts. This dashboard provides the ability to see across different payruns. Use the dashboard to review submitted paysheets prior to approval in Oracle Incentive Compensation.
You can analyze data using various metrics, charts, graphs, and tables.
Access the Paysheet Console dashboard using the following navigation:
(N): Compensation Manager (responsibility) > Quality Management > Paysheet Console
Paysheet Console Dashboard
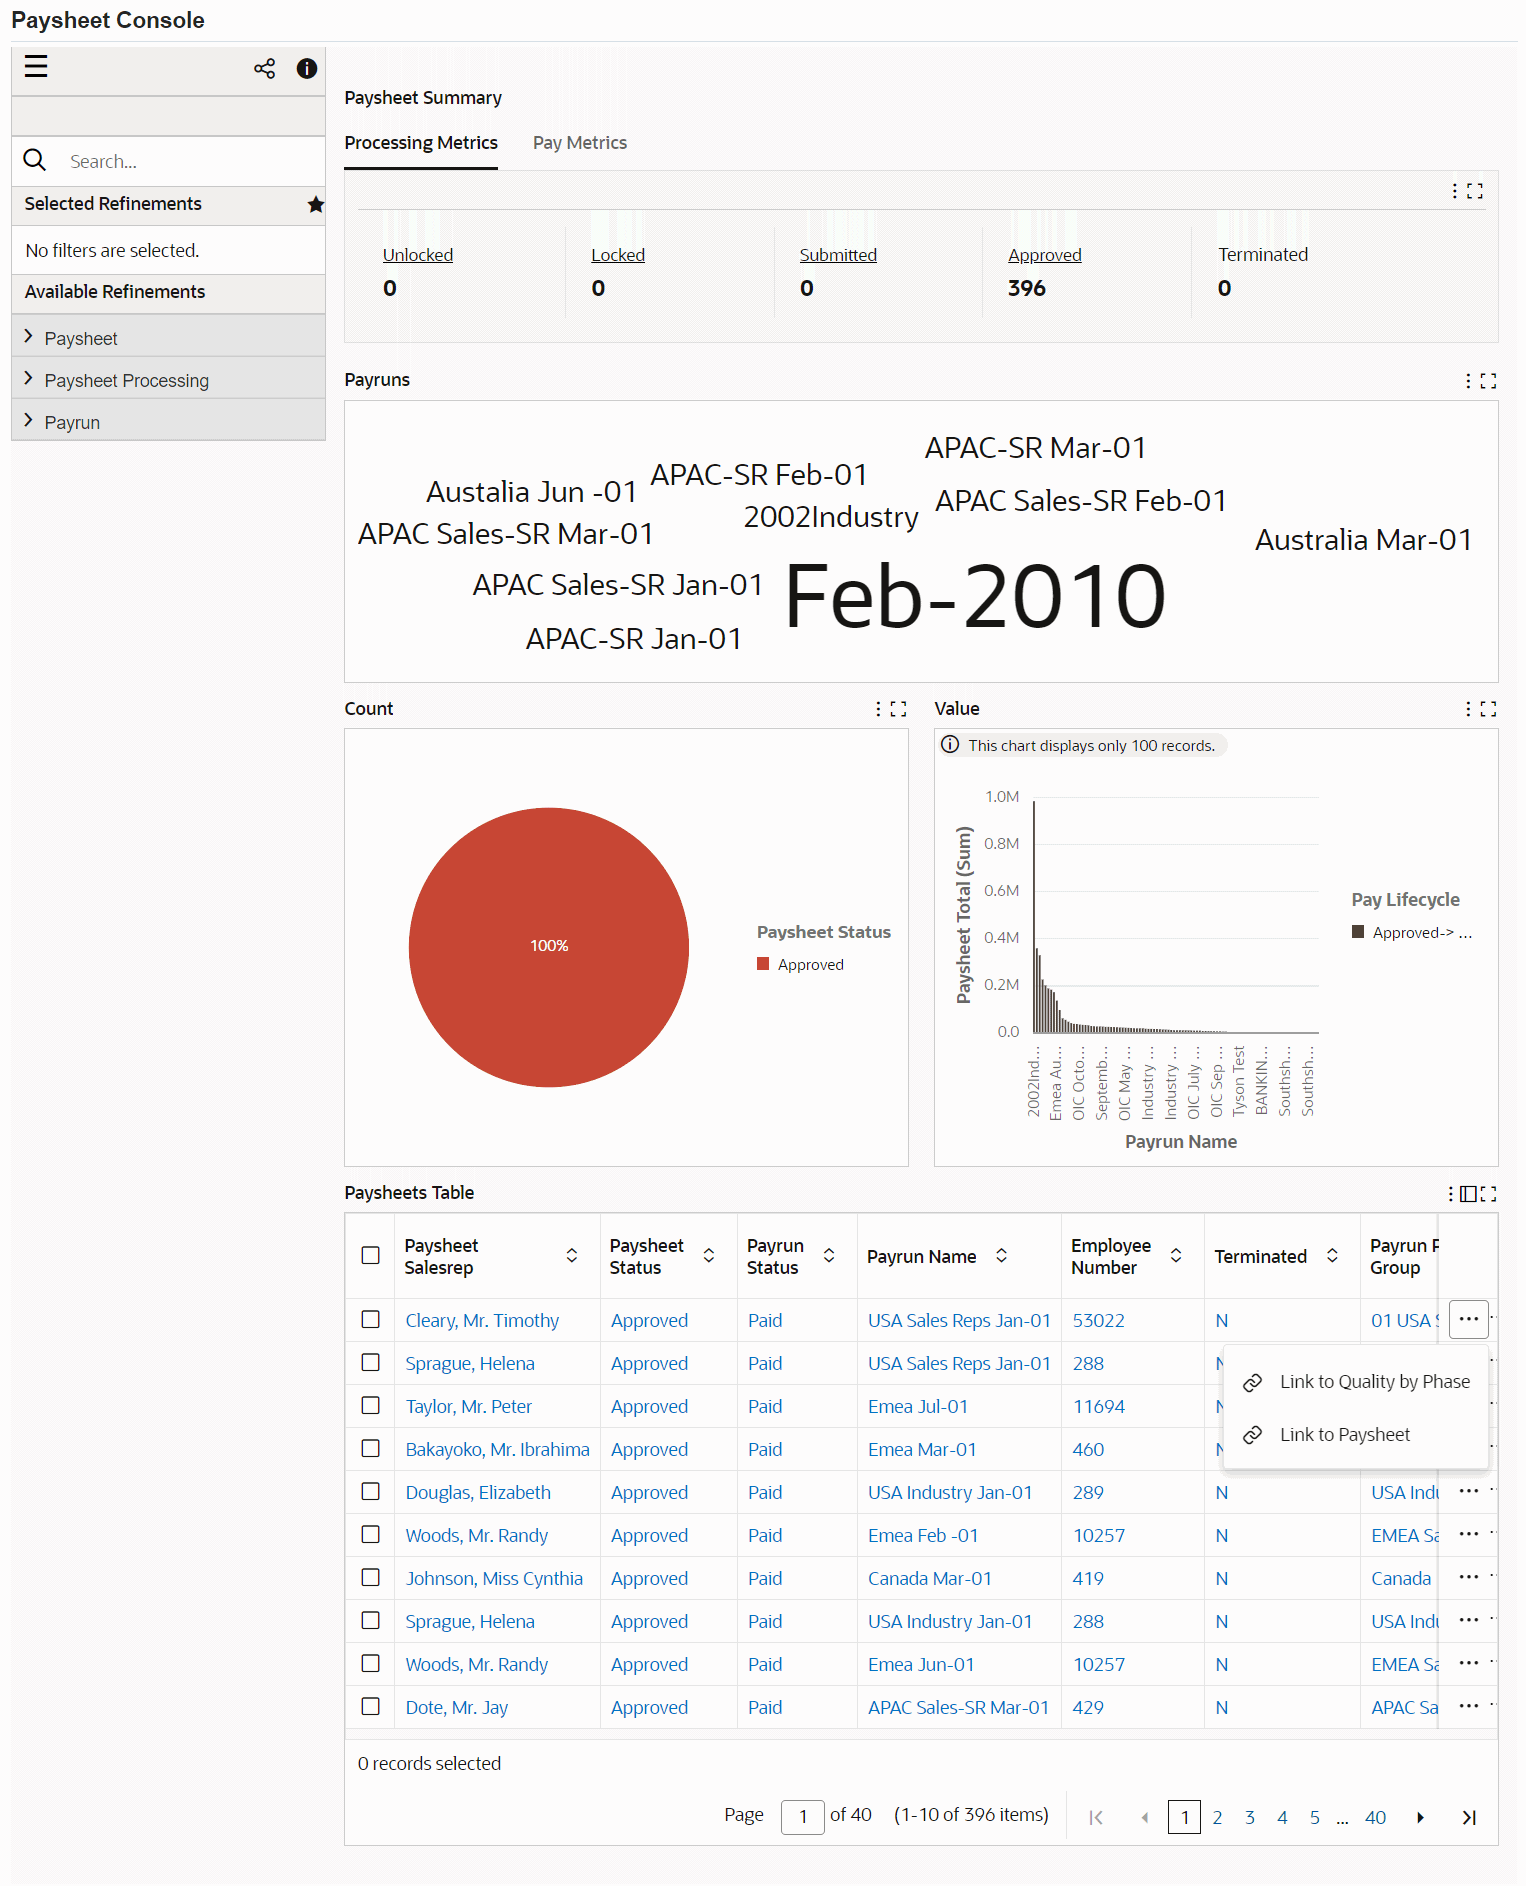
The following table describes the dashboard:
| Component | Description |
|---|---|
| Processing Metrics (summary bar) | The following metrics are based on the status of paysheets:
|
| Pay Metrics (summary bar) | These metrics are based on the sum, average, or maximum of paysheet amounts.
|
| Payruns (tag cloud) | This tag cloud displays the payrun name by the number of records. |
| Count (chart) | This pie chart displays the paysheet distribution percentage per paysheet status. The hover text for each segment on the chart displays the number of paysheets in that paysheet status. |
| Value (chart) | This stacked bar chart displays the sum of paysheet amounts for each payrun, stacked by the phase of the pay lifecycle. |
| Paysheets Table (results table) | This results table displays information such as the paysheet status, the payrun name, the employee number, and the paysheet total. To perform the following actions, click the row-level Actions icon and select an action:
|
Jeopardy by Phase Dashboard
See Incentive Compensation Command Center Overview.
The Jeopardy by Phase dashboard is for finance directors and compensation managers who are typically responsible for ensuring incentives are paid on time. Use this dashboard to assess whether incentives processing is on schedule and to take corrective action if necessary. While the Quality by Phase dashboard focuses on conversion between phases, the Jeopardy by Phase dashboard focuses on readiness to pay. These details help ensure that incentive payments are timely by equipping you to make remedial decisions. The insights include:
-
Number of payees and payee communities in jeopardy
-
Monies in jeopardy
-
Pay components in jeopardy
You can analyze data using various metrics, charts, graphs, and tables.
Access the Jeopardy by Phase dashboard using the following navigation:
(N): Compensation Manager (responsibility) > Quality Management > Jeopardy by Phase
Jeopardy by Phase Dashboard
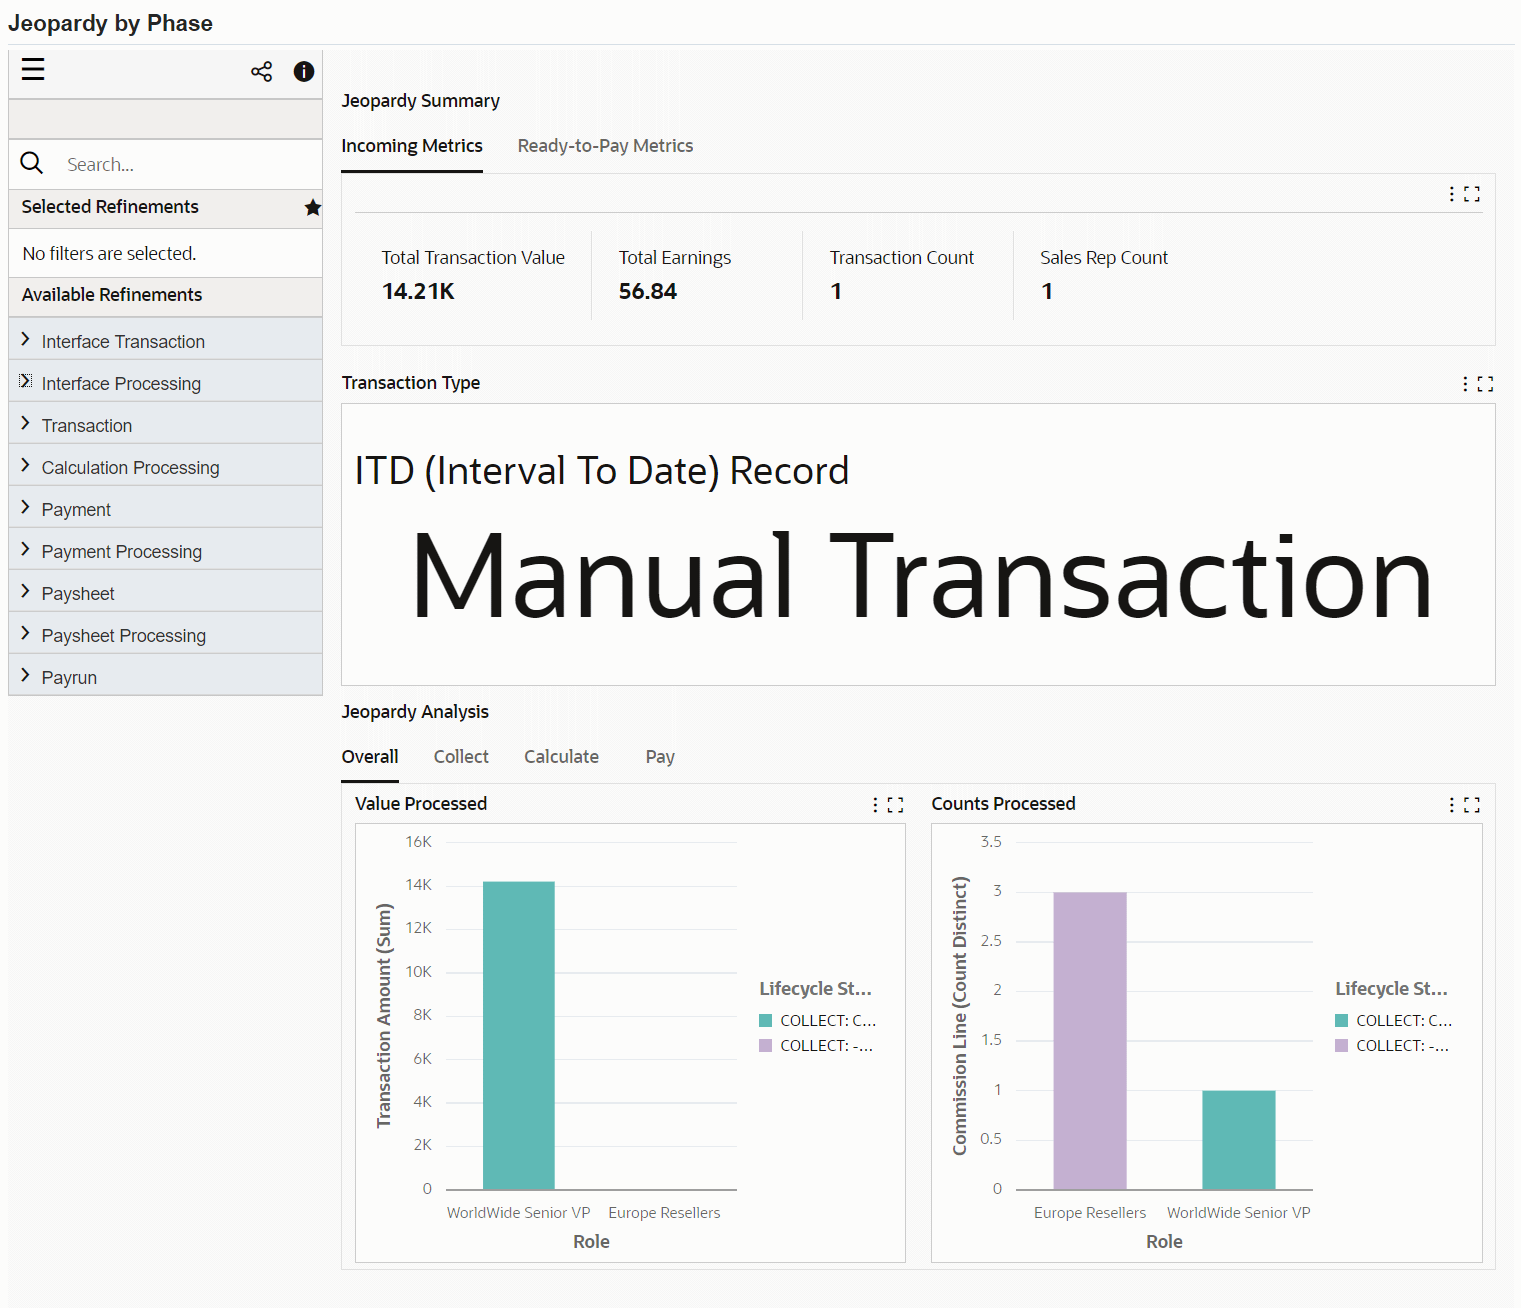
The following table describes the dashboard:
| Component | Description |
|---|---|
| Incoming Metrics (summary bar) | These metrics summarize incoming earnings that need to be processed for payment.
|
| Ready-to-Pay Metrics (summary bar) | The Payments Paid metric displays the total payments belonging to a paid payrun. |
| Transaction Type (tag cloud) | This tag cloud displays transaction types by the number of records for each type. |
| Jeopardy Analysis (charts) | The following charts help you to investigate which of the phases is responsible for jeopardy:
The charts in these tabs are based on the following dimensions:
|
Performance Evaluation Dashboard
See Incentive Compensation Command Center Overview.
The Performance Evaluation dashboard provides sales plan administrators and compensation managers visibility about the compensation attainment and performance trends. The dashboard highlights achievements of sales reps and earnings based on period-to-date, interval-to-date quota, and annual quota. This dashboard also provides details about quota attainment information such as targets, goals, attainment, and attainment to target percent for sales reps at plan elements and eligible products level.
Use the dashboard to:
-
Analyze compensation attainment and performance trends across roles, plans and periods.
-
Compare quotas versus actual achievement across periods by compensation plans and plan elements.
You can analyze data using various metrics, charts, graphs, and tables.
Access the Performance Evaluation dashboard using the following navigation:
(N): Compensation Manager (responsibility) > Quality Management > Performance Evaluation
Performance Evaluation Dashboard
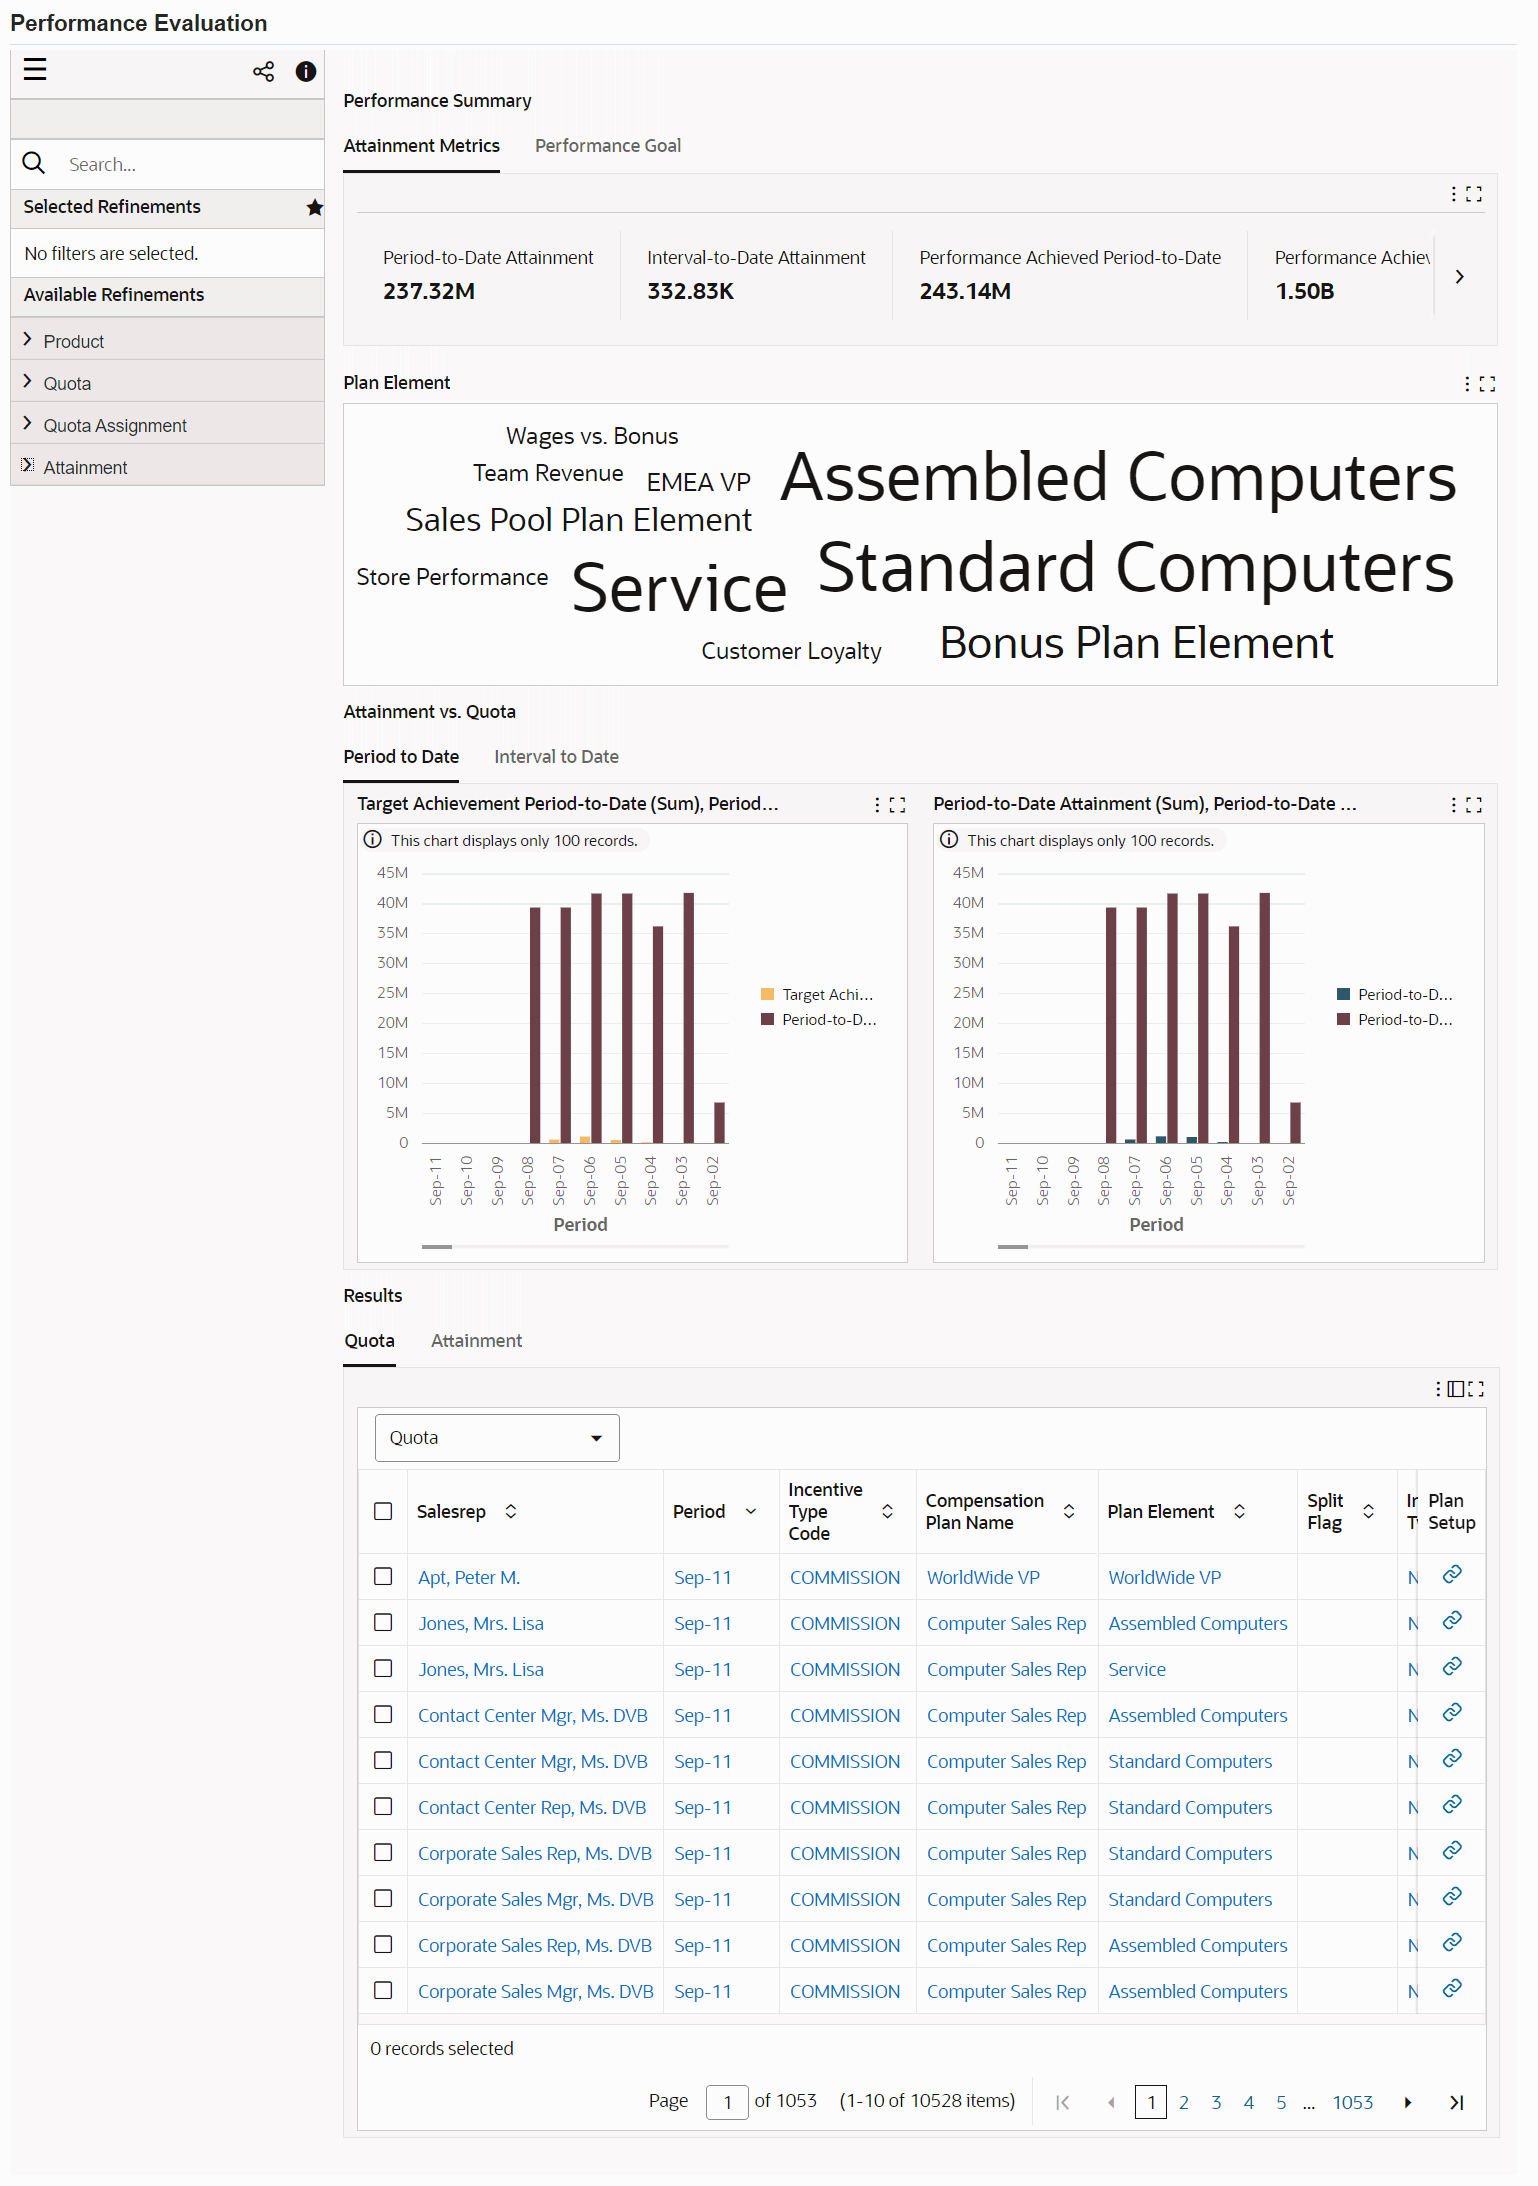
The following table describes the dashboard:
| Component | Description |
|---|---|
| Performance Summary (tabbed layout) | The Performance Summary (tabbed layout) contains the following tabs, each of which contains a summary bar containing the following key metrics:
|
| Plan Element (tag cloud) | This tag cloud displays the top ten plan element names according to the number of sales representative period quota records for each plan element. |
| Attainment vs. Quota (tabbed layout): Period to Date (tab) |
The Period to Date tab contains the following charts:
|
| Attainment vs. Quota (tabbed layout): Interval to Date (tab) |
The Interval to Date tab contains the Interval-to-Date Attainment (Sum), Interval-to-Date Target Amount (Sum) by Period, Plan Element, Compensation Plan, and Role graph, which shows all the attainment for the interval-to-date and the target amount for the interval-to-date. |
| Results (tabbed layout) | The Results tabbed layout contains the following tabs:
|
| Options (table-level actions) |
|
Compensation Plan Visualizer
See Incentive Compensation Command Center Overview.
The Compensation Plan Visualizer offers insight into all the compensation plans in your organization for effective incentive compensation management and dispute resolution.
Use the dashboard to:
-
Monitor compensation plans and plan components for your sales representatives.
-
Get a 360-degree view of relevant plan and participant information.
-
Review compensation details such as transactions, payments, and year-to-date statements.
-
Track incentive details for a sales representative for a specific period or multiple periods.
-
Examine transactions that have been processed for commission.
-
-
Use the visualizer data for more comprehensive planning and optimization of enterprise compensation.
-
Research and resolve commission and payment concerns.
-
Identify and resolve load, calculation, and payment batch processing issues.
-
Investigate at-risk or unpaid commissions.
-
-
Inspect compensation plans and plan elements.
-
Investigate specific components of a compensation plan to identify the root cause of compensation issues.
-
Drill down to Oracle Incentive Compensation pages to get additional information and to perform further processing.
-
Access the Compensation Plan Visualizer dashboard using the following navigation:
(N): Compensation Manager (responsibility) > Quality Management > Compensation Plan Visualizer
Compensation Plan Visualizer
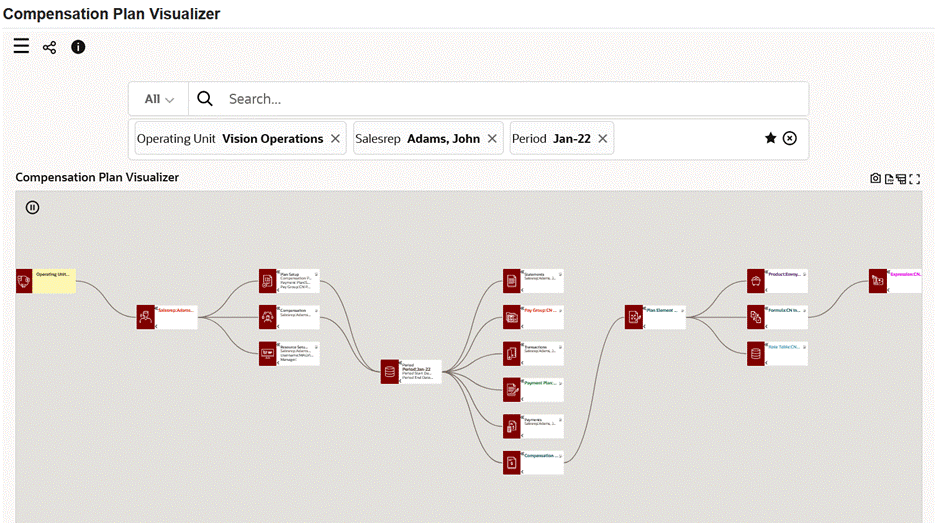
Using Search Attributes
You can select attributes from the following Available Refinements:
-
Operating Unit
-
Salesrep
-
Period
-
Compensation Plan Name
-
Plan Element
-
Payment Plan
-
Pay Group
To search for a sales representative with disputed transactions, use the following search sequence:
-
Select an operating unit.
-
Select the sales representative.
-
Select the specific period to focus on the incentive data for that period. You can also select multiple periods to compare compensation details.
Compensation Plan Visualizer Network Diagram
The compensation plan visualizer network diagram displays nodes for a compensation plan. To navigate to the relevant page in Oracle Incentive Compensation, click the More Details indicator icon on a node.
The following table lists the nodes that the Compensation Plan Visualizer displays with the node information and the pages that you can navigate to from the visualizer nodes.
| Node | Node Information | Oracle Incentive Compensation Page |
|---|---|---|
| Operating Unit | Operating unit name | Not applicable |
| Salesrep | Sales representative name | Not applicable |
| Resource Setup | Sales rep, username, manager | Resource |
| Plan Setup | Compensation plan, payment plan, paygroup | Compensation Plans |
| Compensation | Compensation plan, sales rep | Commission Statement |
| Period | Period, period start date, period end date | Not applicable |
| Pay Group | Paygroup | Pay Groups |
| Payments | Sales rep | Payment |
| Compensation Plan Details | Compensation plan details | Compensation Plans |
| Transactions | Sales rep | Transactions |
| Statements | Sales rep | Year to Date Summary |
| Plan Element | Plan element name | Plan Elements |
| Product | Product name | Products |
| Formula | Formula name | Formulas |
| Rate Table | Rate table name | Rate Tables |
| Expression | Expression name | Expressions |
Performing Actions from a Compensation Plan Visualizer Node
Compensation Plan Visualizer Node Actions
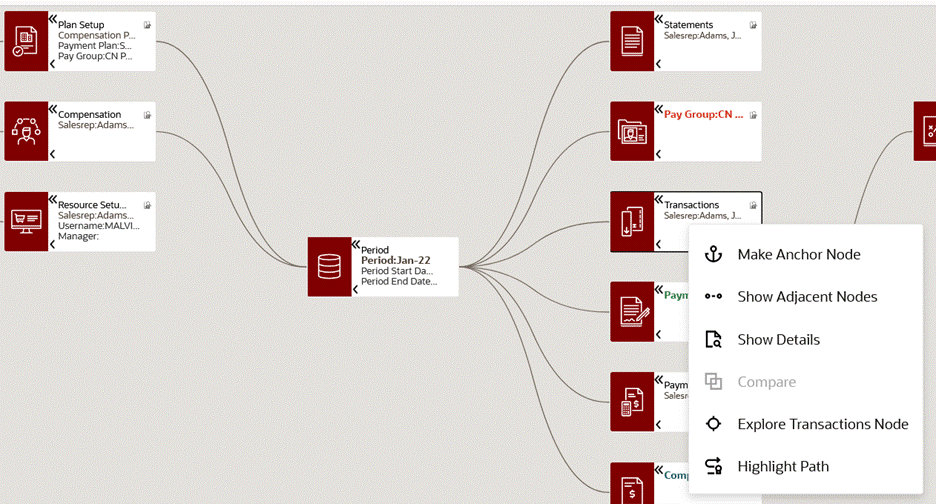
Right-click a node to select the following options that are available for a node:
-
Make Anchor Node: Select this option to set the selected entity as the primary display node with adjacent nodes only.
-
Show Adjacent Nodes: Select this option to narrow the viewer to adjacent nodes only.
-
Show Details: Select this to view details for a node. On the Details window that opens, you can select multiple filters and then perform the following actions:
-
Click Find Similar to apply selected filters to the diagram.
-
Click Search Within to search within the network diagram using the selected attribute in the Details dialog box. Displays only those child nodes that meet the search conditions.
-
-
Explore Node: Depending on the node that you select, click this option to explore that specific node.
-
Highlight Path: Select this option to highlight the complete path for a clear visual.
Additional actions include:
-
Export to Image: Export the network diagram as a svg or png image file.
-
Export to CSV: Export the network diagram in a Comma-Separated Values (CSV) file.
-
Export to PDF: Export the full network diagram in PDF format.
-
Row Expander: Converts the network diagram to text format with action icons that display details within a dialog box.
Examples of Using the Compensation Plan Visualizer
The following examples explain how you can use the Compensation Plan Visualizer to investigate compensation disputes.
Example 1: Investigate Nonpayment of Commission for a Specific Product
In this example, the sales compensation analyst investigates the nonpayment of sales commission to a sales rep for a specific product.
The steps that the analyst performs are as follows:
-
Searches for the operating unit that the sales rep belongs to.
-
Searches for the sales representative and the period in which the sales rep has not been paid commission. The Compensation Plan Visualizer displays the entire compensation plan structure as a network diagram.
-
On the network diagram, the analyst right-clicks the Transactions node and selects the Highlight Path action. This action traces the transactions to the Plan Setup, Compensation, and Period nodes.
-
Clicks the indicator icon on the Transactions node to navigate to the Transactions page in Oracle Incentive Compensation.
-
Reviews transactions for the products that have been processed in the selected period.
-
For the selected period, looks at the list of product types for which commissions are calculated.
-
Finds that the product for which the sales rep is not paid the commission has not been processed for the selected period and therefore the commission calculation has missed the scheduled payment date.
-
Informs the sales representative about the analysis results.
-
Puts in place a mechanism to ensure that the commission for the specific product is calculated in the next period.
Example 2: Investigate Lower Commission Payment
In this example, the compensation analyst is investigating the payment of lower commission to a sales rep.
The steps that the analyst performs are as follows:
-
Searches for the sales rep and the period in which the dispute is reported.
-
Clicks the indicator icon on the Statements node to navigate to the Year to Date Summary page in Oracle Incentive Compensation.
-
Reviews the compensation plan elements to understand the plan rules and revenue classifications associated with the plan.
-
Returns to the network diagram and clicks the indicator icon on the Compensation Plan node.
-
Reviews the earnings rules for the compensation plan.
-
Reviews the eligible products for which the sales rep has reported the issue.
-
Reviews the rate table structure associated with the compensation plan to see why the sales rep has not received enough commission.
-
As part of the investigation, the analyst also reviews:
-
Rate tiers
-
Rate dimensions
-
Formulas
-
Expressions
-