Oracle Payroll Command Center
This chapter covers the following topics:
Payroll Command Center
Payroll Command Center Overview
The Oracle Payroll Command Center presents payroll administrators, payroll managers, and the payroll team with an integrated view of the payroll data. Use key metrics, drill-down graphs, tag clouds, and aggregated tables to gain insight into the payroll, payments, and tax balance data to manage payroll efficiently and to improve your operational and process efficiency.
The Payroll Command Center is available to the following localizations:
-
Australia (AU)
-
Canada (CA)
-
China (CN)
-
Hong Kong (HK)
-
India (IN)
-
International Payroll (ZZ)
-
Ireland (IE)
-
Japan (JP)
-
Korea (KR)
-
Kuwait (KW)
-
Mexico (MX)
-
Netherlands (NL)
-
Saudi Arabia (SA)
-
Singapore (SG)
-
South Africa (ZA)
-
United Arab Emirates (AE)
-
United Kingdom (UK)
-
United States (US)
Note: The Payroll Command Center - "Payroll Dashboard" is supported for all Payroll localizations. Anything that is localization-specific can be enhanced by adding new tabs to the existing "Payroll Dashboard" tab in the Payroll Command Center.
Additional Information: The US Payroll Command Center offers a US localization-specific "US Tax Dashboard" to provide insight into the employee tax balance data. This dashboard is not currently available to other Payroll localizations.
As a payroll administrator or a payroll manager, use the Payroll Command Center to:
-
Proactively complete preprocessing data checks.
-
Ensure data completeness for new employees.
-
Resolve data exceptions before running payrolls.
-
-
Streamline quality checks and reconciliation of payroll results.
-
Compare and identify discrepancies in payrolls and periods, with drill-down to element and assignment details.
-
Reconcile payroll and payments data.
-
As a US payroll administrator, use the command center to:
-
Simplify tax statutory reporting.
-
Identify tax balance exceptions and resolve them using Oracle HRMS and Oracle Payroll applications.
-
Analyze and report tax balances at all levels including geographical distributions.
-
The Payroll Command Center includes the following dashboards:
-
Payroll Dashboard: Use this dashboard to review, analyze, and act on the current period payroll and payments. See Payroll Dashboard.
-
US Tax Dashboard: Use this dashboard to gain insight into the employee tax balance data at jurisdictional (federal, state, county, and city) levels and for multiple reporting period frequencies. See US Tax Dashboard.
Note: You can use the Payroll Command Center only after the installation and common configurations are completed as described in My Oracle Support Knowledge Document 2495053.1, Installing Oracle Enterprise Command Center Framework, Release 12.2. For additional ECC overview information, see Overview of Enterprise Command Centers, Oracle E-Business Suite User's Guide.
Searching Enterprise Command Center Dashboards
Use the sidebar to search for and refine (filter) the data on a dashboard. You can select a value or record from the Available Refinements component, or you can use the Search field to find a keyword, a value, or a specific record. You can also search using keywords. When you submit a search, or select an available refinement, the search term or refinement is added to the Selected Refinements list, and all of the dashboard data will be filtered based on these refinements. You can add multiple refinements and remove any of them at any time. Use Saved Search to create and save your search. You can edit, delete, or refer to this saved search. Use an asterisk (*) or a percent sign (%) to perform a partial keyword or record search that matches any string of zero or more characters. You can also use a question mark (?) to perform a partial search that matches any single character.
Additional Information: For more information about searching for and refining data in enterprise command centers, see Search in Highlights of an Enterprise Command Center, Oracle E-Business Suite User's Guide.
Payroll Dashboard
See Payroll Command Center Overview.
The Payroll Dashboard is a generic dashboard applicable to all Oracle HRMS and Oracle Payroll legislations including Oracle International HR and Payroll.
Important: The payroll data that you can see on the dashboard depends on the security setup of your enterprise. The fiscal year that is set up for your legislation defines the payroll data that you view on the Current Year - Payroll and Current Year - Payments tabs of this dashboard.
Use the Payroll Dashboard to:
-
Review details of pay distributions across payrolls, pay periods, and organizations for timely and correct reporting.
-
Review payments using the Paid or Unpaid payment status.
-
Review international payments.
-
Analyze year-to-date amount distribution by payroll to report overall payroll cost by organization.
-
Gain granular insight into payroll data through attributes such as pay periods, element classifications, categories, and reporting names. Use this data for payroll reconciliation and budgeting.
-
Detect payroll discrepancies.
-
Investigate alerts for new assignments, inactive assignments, and missing payment methods.
-
Ensure smooth payroll processing by reviewing alerts to correct missing or incomplete assignment data.
-
Perform prerequisite steps before running the payroll processes.
-
Reduce costs by expediting payroll processing.
-
To access the Payroll Dashboard, use the predefined Payroll Professional responsibility and the Payroll Command Center menu, or the responsibility and navigation that your enterprise has set up.
Legislation-Specific Refinements
The following table lists the legislation-specific attributes that are available in the Payroll Dashboard (data set), Available Refinements component.
| Legislation | Attributes |
|---|---|
| US | GRE |
| UK | PAYE Reference |
Payroll Dashboard
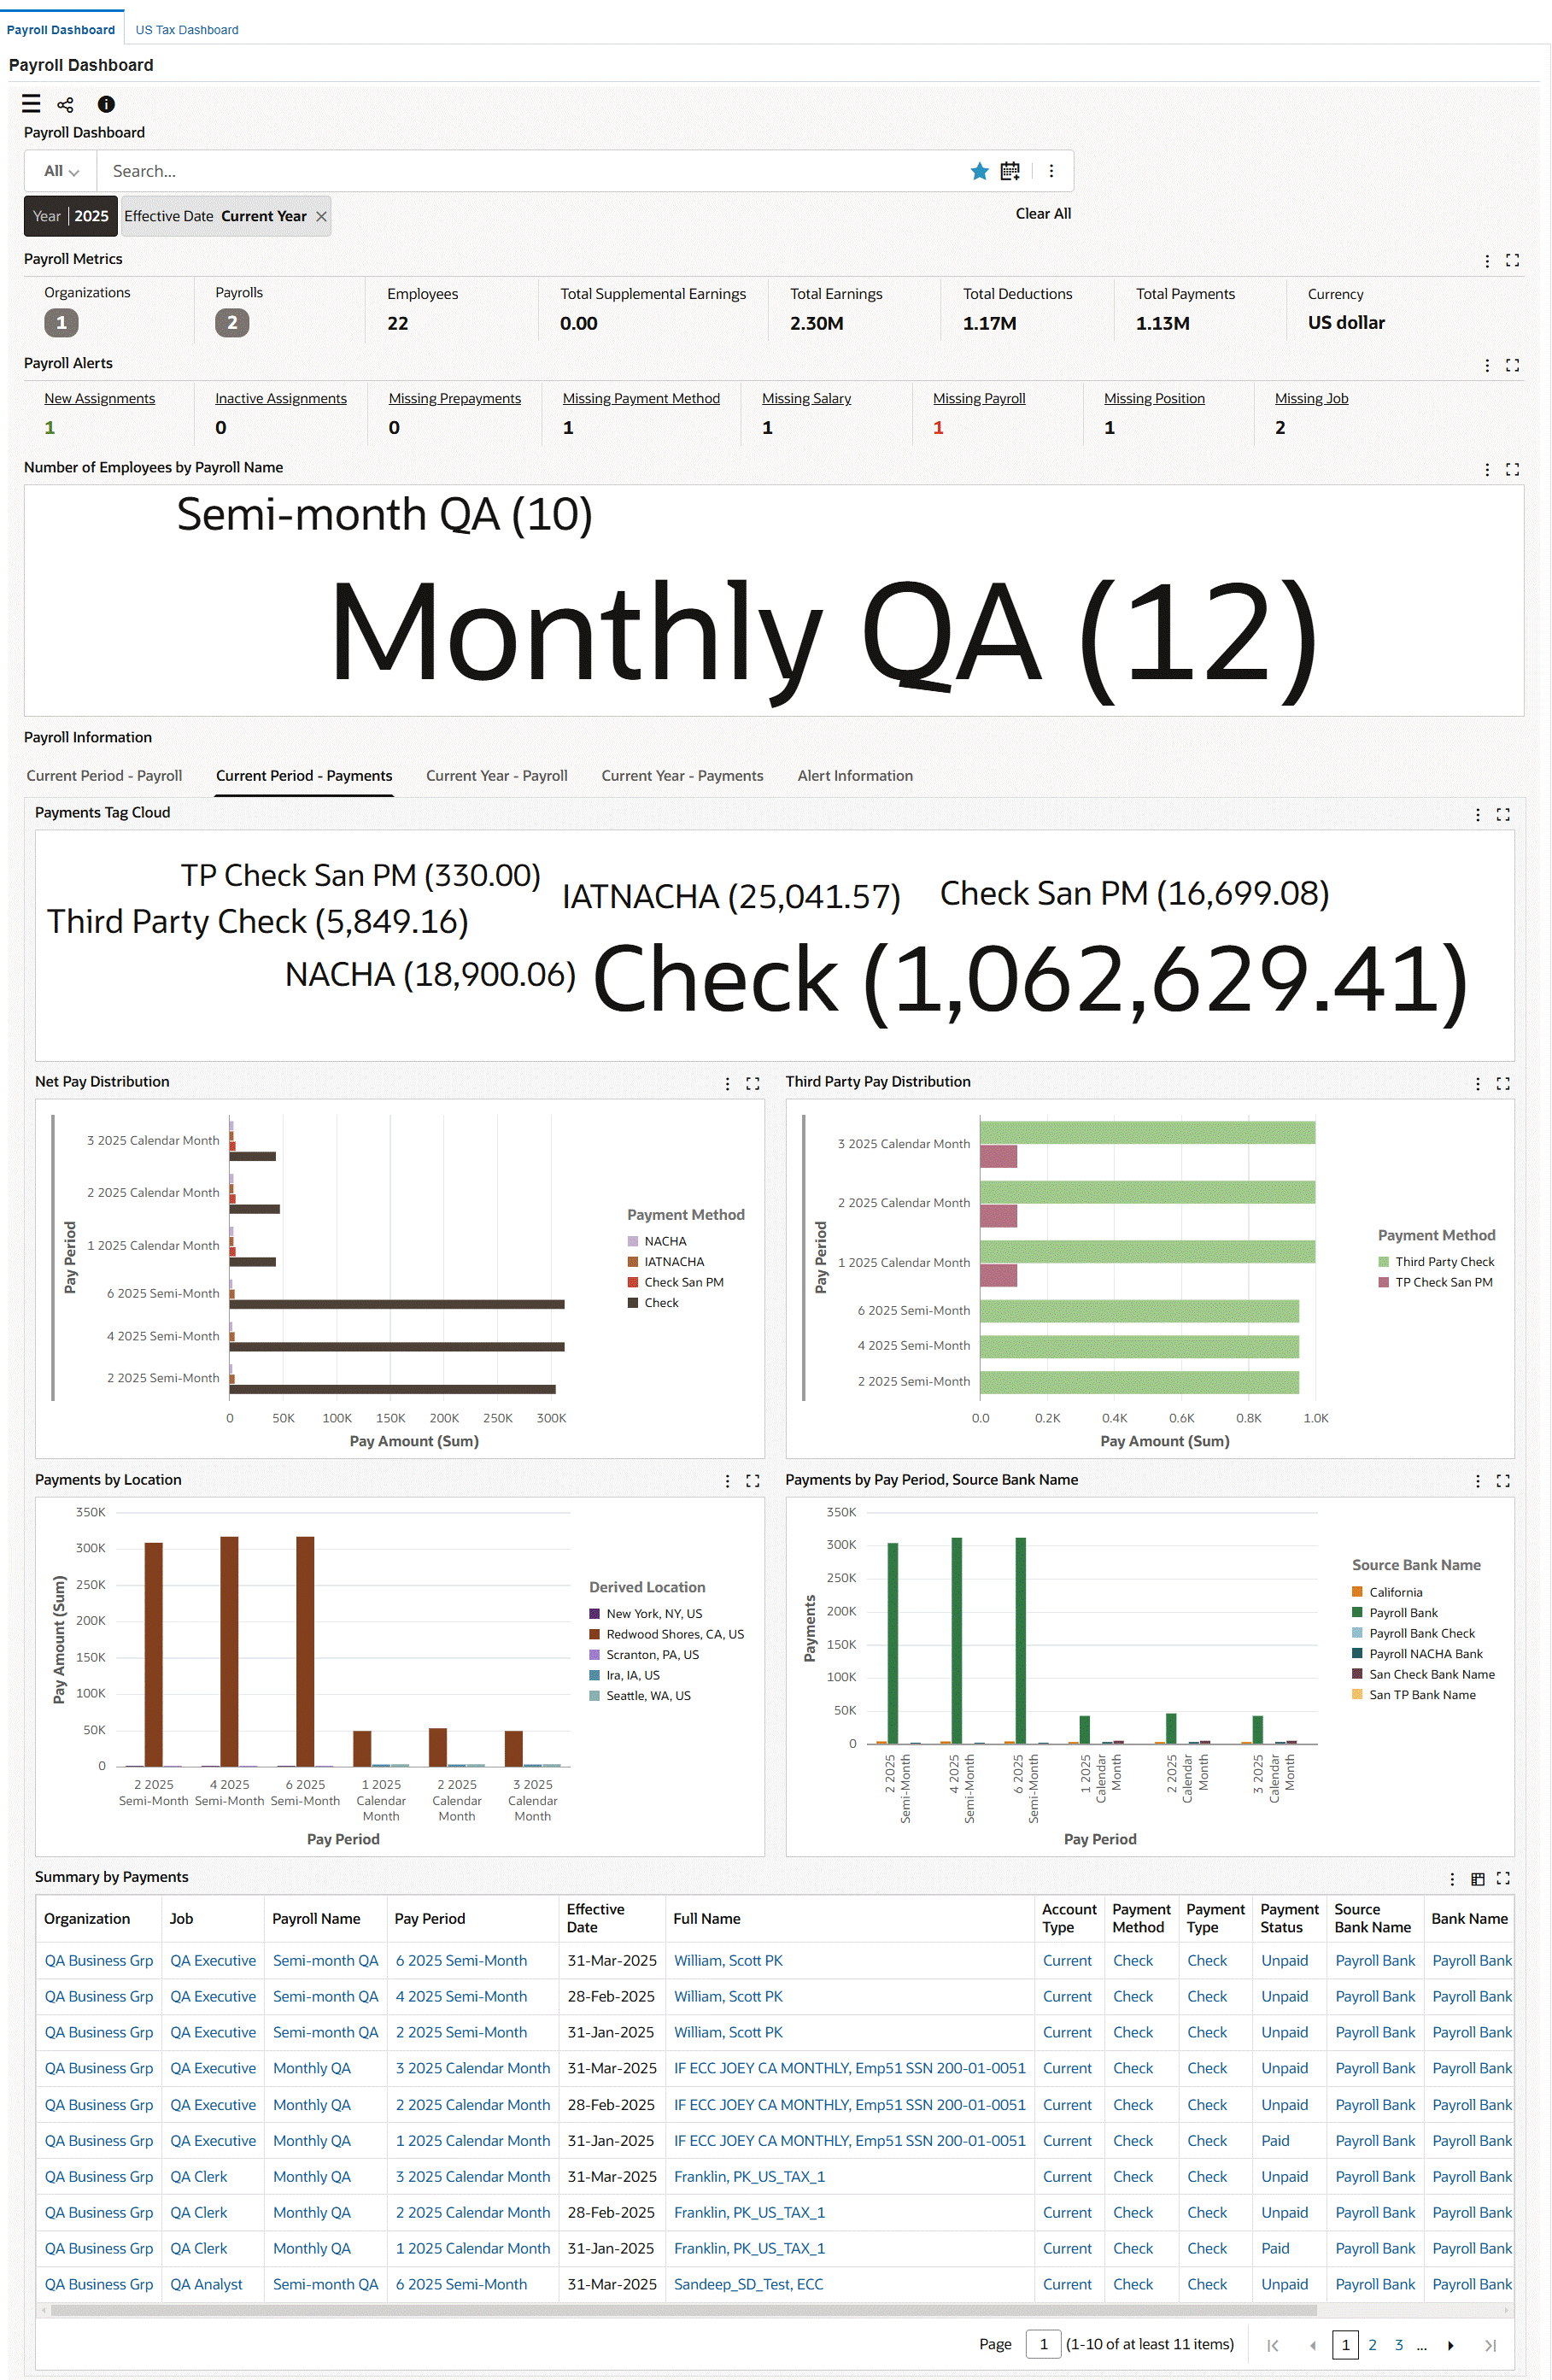
The following table describes the dashboard:
Important: In the metrics summary bars, you can display only those metrics that are applicable to your legislation. Click the Options icon and select the applicable metrics in the Hide/Show Summary Items personalization component.
| Component | Description |
|---|---|
| Year (filter chip) | The current year as the effective date defaults from the "Current Year" seeded search. You must select a year to view data in all charts on the dashboard. You can select only a single year and cannot select multiple years. If the Year filter is cleared, then data will not be displayed in most of the charts as the charts show only a single year data at a time. Clearing the year filter means that all years are selected and therefore no data will be displayed in the charts. You can view data for the current year or from the Year list, select the year for which you want to view data on the dashboard. The year that you select applies to all the components on the dashboard. When you select a historical year, then the Current Period - Payroll and Current Period - Payments tabs show data of the last four (4) periods in a fiscal year. |
| Payroll Metrics (summary bar) | This summary bar contains the following key metrics:
|
| Payroll Alerts (summary bar) | This summary bar provides the following alerts. When you click an alert, the Alert Information tab displays information related to the alert. Use these details to focus on missing or incomplete assignment data and to take corrective actions prior to launching the payroll process cycle.
|
| Number of Employees by Payroll Name (tag cloud) | This tag cloud shows payroll names with the total number of employees processed for each payroll. Click a tag cloud to filter the information on the dashboard. |
| Payroll Information (tabbed component): Current Period - Payroll (tab) |
The Current Period - Payroll tab displays the payroll data based on the most current payroll period. You can compare the latest payroll values with the previous three periods and also drill down to individual payroll or period dates.
Important: The payroll data is dependent on when your payroll administrator runs the data load during the payroll cycle. For example, if your payroll administrator has just completed the payroll process, then the information in this tab may not match the data that the Current Period - Payments tab presents. However, if the Prepayments process is also completed by the time the data load is run, then the Current Period - Payroll data will match the data in the Current Period - Payments.
|
| Payroll Information (tabbed component): Current Period - Payments (tab) |
The Current Period - Payments tab shows employee payments for the current pay period in the following components:
|
| Payroll Information (tabbed component): Current Year - Payroll (tab) |
The Current Year - Payroll tab shows the fiscal year-to-date payroll total amounts as of the latest data load date in the following charts:
|
| Payroll Information (tabbed component): Current Year - Payments (tab) |
The Current Year - Payments tab presents the fiscal year-to-date payments data (that is from the beginning of the current year through the latest data load date) in the following charts:
|
| Payroll Information (tabbed component): Alerts Information (tab) |
This tab shows the details for the metric that you select in Payroll Alerts. You can export the results in a comma-separated values (CSV) file format. |
US Tax Dashboard
See Payroll Command Center Overview.
The US Tax Dashboard presents the tax-related information that is specific to the US legislation.
Important: The payroll data that you can see on the dashboard depends on the security setup of your enterprise.
Use the US Tax Dashboard to:
-
Review and identify employee assignments with negative or out of balance tax conditions.
-
Review federal wages and tax withheld data and compare across quarters for a GRE or a payroll.
-
Gain insight into state and locality tax balance information across state and local (county and city) jurisdictions.
-
Drill down to employee wages and withheld tax balance for month and period.
-
Compare and analyze the State Disability Insurance (SDI) and the State Unemployment Insurance (SUI) payments.
-
Use the state level tax information for statutory reporting reconciliation.
To access the US Tax Dashboard, use the predefined Payroll Professional responsibility and the Payroll Command Center menu, or the responsibility and navigation that your enterprise has set up.
US Tax Dashboard

The following table describes the dashboard:
| Component | Description |
|---|---|
| Year (filter chip) | The current year as the effective date defaults from the "Current Year" seeded search. You must select a year to view data in all charts on the dashboard. You can select only a single year and cannot select multiple years. If the Year filter is cleared, then data will not be displayed in most of the charts as the charts show only a single year data at a time. Clearing the year filter means that all years are selected and therefore no data will be displayed in the charts. You can view data for the current year or from the Year list, select the year for which you want to view data on the dashboard. The year that you select applies to all the components on the dashboard. |
| Unacceptable Balances - Federal, Unacceptable Balances - State (summary bar) | Use the following metrics to review employee assignments with exceptions. The dashboard displays these alerts as of the latest payroll period. Click an alert to refine and filter data on the dashboard.
|
| Wages vs. Withheld Overview (chart) | By default, this comparative chart shows the total wage payments made to employees and the total tax withheld from them, in each quarter along with the total number of employees. You can drill down to view the balance data for each month within the selected quarter. The dimensions are quarter, month, and pay period. |
| Number of People by GRE Name (tag cloud) | By default, this tag cloud displays the total number of employees in each GRE. Select a different dimension to generate tag clouds by payroll name, jurisdiction name, county jurisdiction, city jurisdiction, primary assignment, or work at home. |
| Balance Information (tabbed component): Federal (tab) |
Use this tab to review federal wages, withheld amounts, and tax balances. The balance information applies to the current reporting year. The charts display total amounts for various balances.
|
| Balance Information (tabbed component): State or Locality (tab) |
Use this tab to analyze state, county, and city tax payments. The balance information applies to the current reporting year. The charts display total amounts for various balances.
Use SDI Total Amounts and SUI Total Amounts charts to monitor the insurance costs and to generate reports for the quarterly SDI and SUI reconciliation. |
| State Tax Balances, County Tax Balances, City Tax Balances, School District Balances (tables) | These tables provide an aggregated view of all key state, county, city tax, and school district balances. You can export the tax balance data to generate reports for reconciliation purposes. |