Oracle Field Service Information Discovery Plus
This chapter covers the following topics:
- Overview
- Field Service Tasks Summary Page
- Field Service Parts Summary Page
- Field Service Information Discovery Plus Administrator Portal
- Setting Up Oracle Field Service Information Discovery Plus
- Setup and Configuration Steps
- Access Control: Hide and Show EID Dashboards (User Interfaces) for Oracle Field Service
- Scheduling Setup for Full Endeca Upload or Refresh
- ETL Parameters for Oracle Field Service
- Views and Joins for Oracle Field Service Information Discovery Plus
- Menus for Oracle Field Service Information Discovery Plus
Overview
Oracle Field Service Information Discovery Plus enables you to search and filter Field Service Execution data and Spares Supply Chain data. You can use the Oracle Field Service Tasks Summary and Field Service Parts Summary pages to view and analyze the data using key Performance Indicators (KPIs), performance evaluation metrics, charts, graphs, and tables for Field Technicians, Field Service Tasks, and Spares Management.
This chapter provides product-specific details required to integrate Information Discovery with Oracle E-Business Suite Release 12.2 V8 for the Oracle Field Service Information Discovery Plus application. This supplements the information provided in Installing Oracle E-Business Suite Information Discovery, Release 12.2 V8 (Doc ID: 2214431.1). You must read this document and make note of the requirements before you begin your installation.
Oracle Field Service Information Discovery Plus User Interfaces
Field Service Tasks Summary Page
You can use the Field Service Tasks Summary page to view Key Performance Indicators (KPIs) and Metrics for measuring the efficiency of field operations. You can drill down into Field Service Tasks and Technician information using guided navigation, tag cloud, charts, and a results table that displays attributes and various dimensions. You can also export results table data to an Excel spreadsheet.
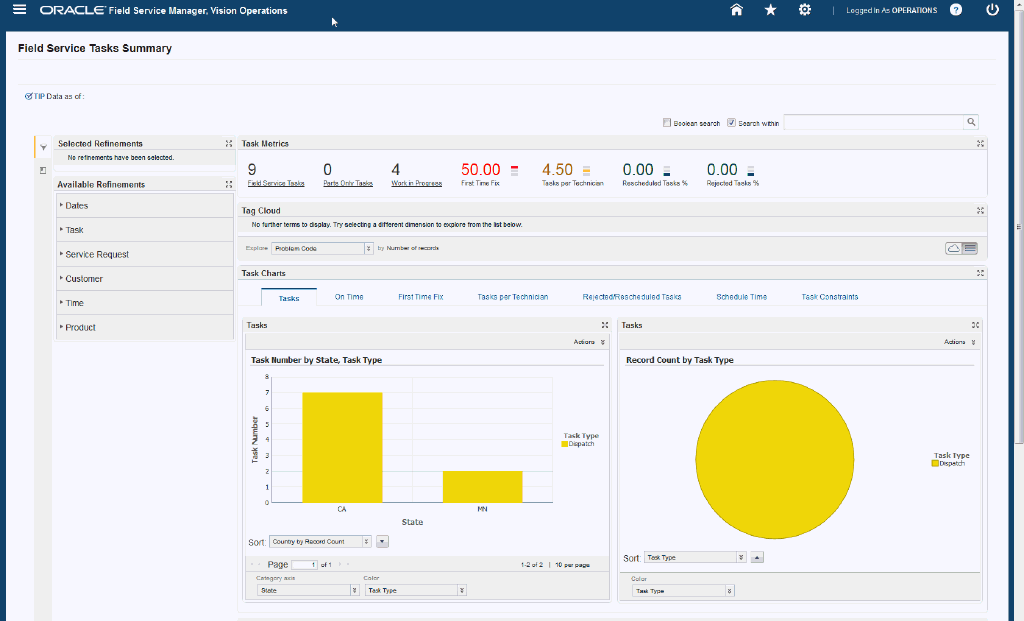
The following is a display of the Field Service Tasks Summary page.
From the Field Service Manager responsibility, navigate to the Field Service Tasks Summary page:
(N) Field Service Manager > Field Service Tasks Summary


Within the Field Service Tasks Summary page, you can view and analyze field performance data using display tools that include metrics, charts, graphs, and tables. The following describes the Endeca Field Service Tasks Summary page regions and components:
| Region | Components |
|---|---|
Advanced Search
|
The Advanced Search component includes value search, record search, Boolean search, and partial search capabilities. You can submit keyword searches and the application provides type-ahead suggestions and displays attribute values that match the typed text. When you perform a search, the search term is added to the Selected Refinements component. As you type, you may be prompted to select a matching attribute value, or simply search for the entered text.
Additional Information: See the Advanced Search Capabilities appendix in this guide for details. |
| Selected Refinements | The Selected Refinements component displays all values that you have selected to filter data, and allows you to quickly make adjustments to the current refinement by removing items or clearing all filters from the list. |
| Bookmarks | The Bookmarks component allows you to save a given navigation and component state and return to it at a later time. |
| Available Refinements | The Available Refinements component allows you to filter data based on the currently available values or value ranges for selected attributes that are displayed within attribute groups. Expand the following attribute groups to view and select attribute names: Dates
Task
Service Request
Customer
Product
|
| Task Metrics (summarization bar) Note: The Metric Components are color coded to highlight warnings and health: - Red: Critical warning state - Yellow: Warning - Grey: Normal - Green: Good |
|
| Tag Cloud | Top Ten Problem Codes Tag Cloud Component
Note: The Problem Code tag cloud component displays the top ten tasks by frequency of occurrence for the following:
|
| Tasks Charts (tabbed component container) Tasks (tab) |
Tasks (bar chart)
Tasks (pie chart)
|
| Tasks Charts (tabbed component container) On Time (tab) |
On Time (bar chart)
On Time, Effort, Duration (trend chart)
|
| Tasks Charts (tabbed component container) First Time Fix (tab) |
First Time Fix (bar chart)
First Time Fix (trend chart)
|
| Tasks Charts (tabbed component container) Tasks per Technician (tab) |
Tasks per Technician (bar chart)
Tasks per Technician (trend chart)
|
| Tasks Charts (tabbed component container) Rejected/Rescheduled Tasks (tab) |
Rejected/Rescheduled Tasks (bar chart)
Rejected/Rescheduled Tasks (pie chart)
|
| Tasks Charts (tabbed component container) Schedule Time (tab) |
Schedule Time (bar chart)
Schedule Time (trend chart)
|
| Tasks Charts (tabbed component container) Task Constraints (tab) |
Task Constraints (bar chart)
Task Constraints (trend chart)
|
| Results Table | Column Sets:
|
Field Service Parts Summary Page
You can use the Field Service Parts Summary page to view Key Performance Indicators (KPIs) and Metrics for spare parts usage, parts orders and back orders pending, and areas of concern. This information is vital for decision making to further improve the operational efficiency of warehouse and service supply chain operations. You can drill down into parts orders, backorders, and debrief information using guided navigation, tag cloud, charts, and a results table that displays attributes and various dimensions. You can also export results table data to an Excel spreadsheet.
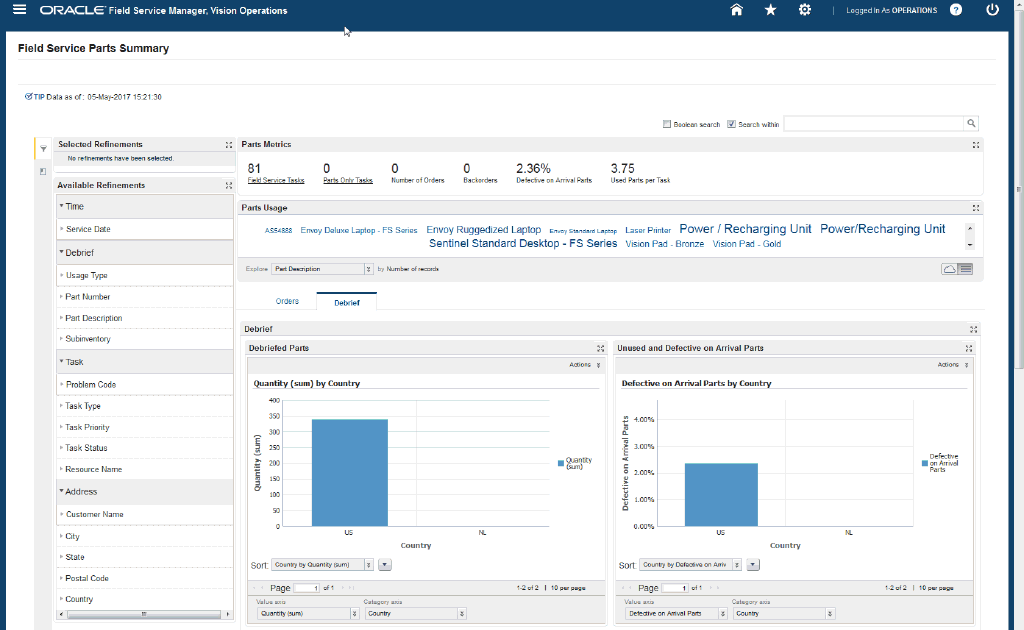
The following is a display of the Field Service Parts Summary page.
From the Field Service Manager responsibility, navigate to the Field Service Parts Summary page:
(N) Field Service Manager > Field Service Parts Summary


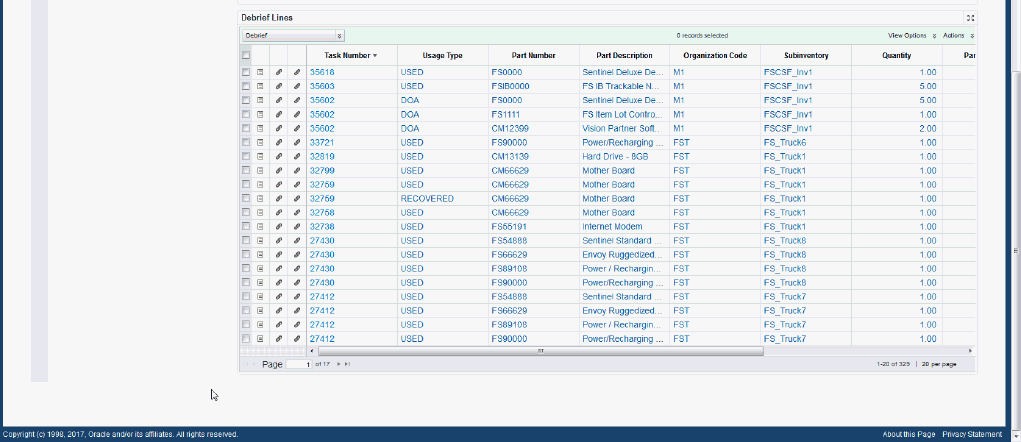
Within the Field Service Parts Summary page, you can view and analyze the efficiency of Spares Supply Chain and Logistics Operations, based on the analysis of data related to Spare Parts Consumption, Parts Orders, Backorders, Unused Parts, Parts Dead on Arrival (DOA), and Parts utilization per Task using display tools that include metrics, charts, graphs, and tables. The following describes the Endeca Field Service Parts Summary page regions and components:
| Region | Components |
|---|---|
Advanced Search
|
The Advanced Search component includes value search, record search, Boolean search, and partial search capabilities. You can submit keyword searches and the application provides type-ahead suggestions and displays attribute values that match the typed text. When you perform a search, the search term is added to the Selected Refinements component. As you type, you may be prompted to select a matching attribute value, or simply search for the entered text.
Additional Information: See the Advanced Search Capabilities appendix in this guide for details. |
| Selected Refinements | The Selected Refinements component displays all values that you have selected to filter data, and allows you to quickly make adjustments to the current refinement by removing items or clearing all filters from the list. |
| Bookmarks | The Bookmarks component allows you to save a given navigation and component state and return to it at a later time. |
| Available Refinements | The Available Refinements component allows you to filter data based on the currently available values or value ranges for selected attributes that are displayed within attribute groups. Expand the following attribute groups to view and select attribute names: Time
Order
Debrief
Task
Address
Service Request
|
| Parts Metrics (summarization bar) Note: The Metric Components are color coded to highlight warnings and health: - Red: Critical warning state - Yellow: Warning - Grey: Normal - Green: Good |
Parts Metrics
|
| Parts Usage (tag cloud) | Top Ten Parts Tag Cloud Component
Note: The Parts Usage tag cloud component displays the top ten parts by frequency of occurrence. The Tag Cloud is dynamically rendered based on distinct Part Names associated with all Field Service Tasks in the system. Tag cloud can be used to filter the displayed records based on the tag clicked by the user. |
| Charts (tabbed component container) Orders (tab) |
Order Number Count (bar chart)
Received and Shipped on Time (bar chart)
|
| Charts (tabbed component container) Debrief (tab) |
Debrief (chart)
Unused and Defective on Arrival Parts (chart)
|
| Debrief Lines (results table) | Column Sets:
|
Field Service Information Discovery Plus Administrator Portal
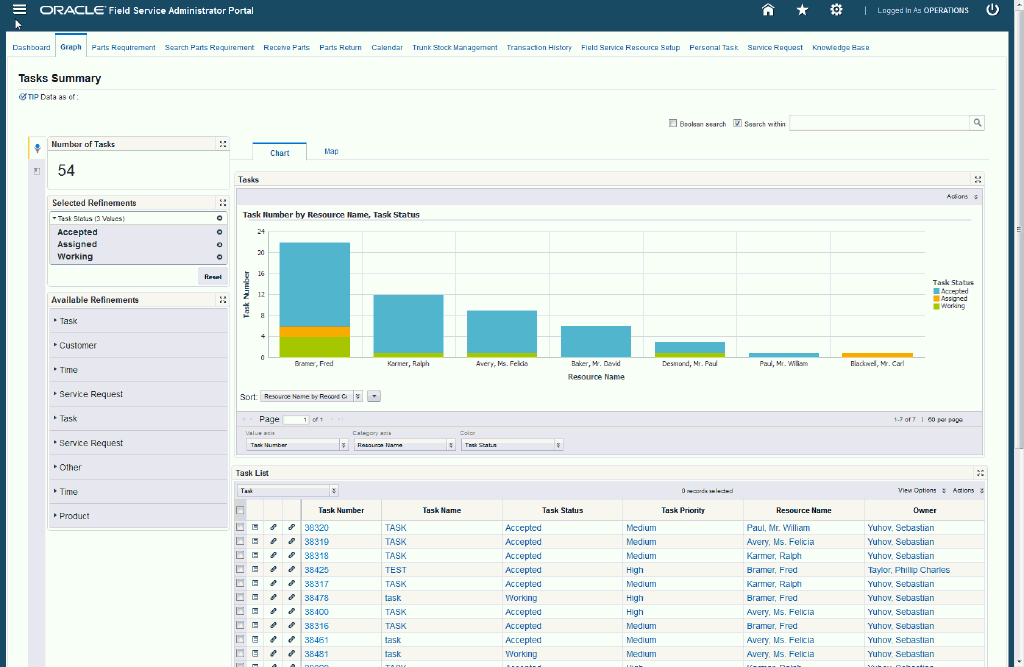
Field Service Administrators can use this dashboard to analyze data related to Service Requests, Tasks, and Technicians. The following is a partial display of the Field Service Administrator Portal page.
From the Field Service Administrator Portal responsibility, navigate to the Field Service Administrator Portal page:
(N) Field Service Administrator Portal > Dashboard > Graph (T)

| Region | Components |
|---|---|
Advanced Search
|
The Advanced Search component includes value search, record search, Boolean search, and partial search capabilities. You can submit keyword searches and the application provides type-ahead suggestions and displays attribute values that match the typed text. When you perform a search, the search term is added to the Selected Refinements component. As you type, you may be prompted to select a matching attribute value, or simply search for the entered text.
Additional Information: See the Advanced Search Capabilities appendix in this guide for details. |
| Selected Refinements | The Selected Refinements component displays all values that you have selected to filter data, and allows you to quickly make adjustments to the current refinement by removing items or clearing all filters from the list. |
| Bookmarks | The Bookmarks component allows you to save a given navigation and component state and return to it at a later time. |
| Available Refinements | The Available Refinements component allows you to filter data based on the currently available values or value ranges for selected attributes that are displayed within attribute groups. Expand the following attribute groups to view and select attribute names:
|
| Summarization Bar Note: The Metric Components are color coded to highlight warnings and health: - Red: Critical warning state - Yellow: Warning - Grey: Normal - Green: Good |
|
| Chart (tabbed component container) Tasks |
Task Number by Resource Name, Task Status (chart)
|
| Task List (Results Table) | Column Sets:
|
Oracle Field Service Information Discovery Plus Product Configuration
Setting Up Oracle Field Service Information Discovery Plus
The Oracle Field Service product configuration setup must be completed after the installation and common configurations are completed as described in Installing Oracle E-Business Suite Information Discovery, Release 12.2 V8 (Doc ID: 2214431.1).
Setup and Configuration Steps
To set up Oracle Field Service Information Discovery Plus, you must complete the following steps:
-
Set Access Control by assigning UMX roles and updating access grants.
-
Load data to the Oracle Field Service Data Domain by running graphs provided by Oracle Field Service.
Access Control: Hide and Show EID Dashboards (User Interfaces) for Oracle Field Service
As part of the Oracle E-Business Suite Information Discovery integration for the Oracle Field Service application, the following UMX Roles are provided:
| UMX Role | Internal Code Name |
|---|---|
| Field Service Endeca Access Role | UMX|CSF_ENDECA_ACCESS_ROLE |
| Field Service Endeca Admin Portal Access Role | UMX|CSF_ENDECA_ADMIN_PO_ACCESS_ROLE |
| Field Service Endeca Global Access Role | UMX|CSF_ENDECA_GLOBAL_ACCESS_ROLE |
You must add the new UMX role 'Field Service Endeca Access Role' (Internal Code Name: UMX|CSF_ENDECA_ACCESS_ROLE) to enable Endeca menu items for the Field Service Manager responsibility, or any other custom responsibility which is using the same menu. When this UMX role is assigned to the Field Service Manager responsibility, the menu items 'Field Service Tasks Summary' and 'Field Service Parts Summary' appear.
To obtain access to the Field Service Admin Portal, you must add the new UMX role 'Field Service Endeca Admin Portal Access Role' (Internal Code Name: UMX|CSF_ENDECA_ADMIN_PO_ACCESS_ROLE) to the 'Field Service Administrator Portal' responsibility.
If a user requires access to the complete (global) dataset, the 'Field Service Endeca Global Access Role' (Internal Code Name: UMX|CSF_ENDECA_GLOBAL_ACCESS_ROLE) must be added for that user. If a user does not have global access to the dataset, that user will have access to task, debrief, and parts order information related to resources belonging to his/hers group or territory only.
For assigning UMX roles and grants, refer to Installing Oracle E-Business Suite Information Discovery, Release 12.2 V8 (Doc ID: 2214431.1).
Scheduling Setup for Full Endeca Upload or Refresh
The following data domains are included with the Oracle Field Service application:
| Data Domain Name | Purpose |
|---|---|
| csf-tasks | Domain Service Request, Task, and Resource (Technician) information. |
| csf-parts | Stores Parts Order and Task Debrief information. |
Each data domain comes with a set of graphs. The naming of the graphs is identical across data stores.
The initial data upload for Endeca Field Service is complete when the Full graph is run as described in the Installing Oracle E-Business Suite Information Discovery, Release 12.2 V8 (Doc ID: 2214431.1). Full refresh deletes all data from Endeca and repopulates it with a full data extract from the E-Business Suite system. For incremental data load or refresh, you should determine how often the Endeca data should be refreshed from E-Business Suite depending on your organizational requirements.
To schedule ETL on the Integrator Server
-
Login to Integrator server using your Clover login.
-
Click the Scheduling tab.
-
Select the New Schedule link.
-
Enter a Description for the scheduler.
-
Select Periodic as the Type.
-
Select by interval as the Periodicity.
-
Enter a start date and time in the Not active before date/time field.
-
Enter an end date and time in the Not active after date/time field.
-
Enter a value in the Interval (minutes) field.
-
Ensure you select the Fire misfired event as soon as possible check box.
-
Select Start a graph from the Task Type list.
-
Select the graph for schedule to run. I.e. FullLoadConfig.grf/IncrementalLoadConfig.grf.
-
Click Create to set the scheduler.
ETL Parameters for Oracle Field Service
You can load data to the Oracle Field Service Data Domain by running graphs provided by Oracle Field Service.
To load data to the Oracle Field Service data domain
-
Using the URL for the EID Integrator Server, navigate to the Sandboxes page and expand the graph node under csf-parts.
-
Graphs to load data include:
-
FullLoadConfig.grf: This graph loads meta data and data from all views. It resets all records in the csf-parts data domain, and then loads data. Run this graph to load data for the Field Service Parts Summary page. This graph will load data for part orders and debrief.
-
IncrementalLoadConfig.grf: This graph performs incremental load for part orders and debrief. Only those records that were updated subsequent to the last load are loaded. Note: Data deleted in EBS (Field Service) will not be removed from Endeca by running Incremental Graph. You must run FullLoadConfig.grf graph to remove all the data from Endeca and then reload all data. Full refresh deletes all data from Endeca and repopulates it with a full data extract from the E-Business Suite system.
-
Views and Joins for Oracle Field Service Information Discovery Plus
The following views are used by the ETL layer in Endeca to load Oracle Field Service data to the Endeca data domain:
| View Name | Purpose |
|---|---|
| CSF_EID_TASKS_V | Loads Service Request, Task and Resources (Technician) data |
| CSF_EID_PARTS_V | Loads Parts Orders and Task Debrief data |
Menus for Oracle Field Service Information Discovery Plus
Oracle Field Service Information Discovery Plus integration includes the following new user menu functions:
| User Function Name | Function Name |
|---|---|
| Oracle Field Service Parts Destination | CSP_ENDECA_PARTS |
| Oracle Field Service Parts Landing Page | CSP_ENDECA_PARTS_LANDING_PG |
| Oracle Field Service Tasks Destination | CSF_ENDECA_TASKS |
| Oracle Field Service Tasks Landing Page | CSF_ENDECA_TASKS_LANDING_PG |
| Oracle Field Admin Portal Destination | CSF_ENDECA_AP |
| Oracle Field Service Admin Portal Landing Page | CSF_ENDECA_AP_LANDING_PG |