Oracle Depot Repair Information Discovery Plus
This chapter covers the following topics:
- Overview
- Oracle Depot Repair Information Discovery Plus User Interface
- Service Orders Dashboard Page
- Supplier Warranty Claims Dashboard Page
- Overview
- Set up Oracle Depot Repair Information Discovery Plus Integration
- Running the Full Load Graph
- Setting Up the Scheduler for Incremental Refresh
- Roles in Oracle Depot Repair Information Discovery Plus
- Grants in Oracle Depot Repair Information Discovery Plus
- Permission Sets in Oracle Depot Repair Information Discovery Plus
- Views and Joins to Load Oracle Depot Repair Information Discovery Plus
- Menus and Functions in Oracle Depot Repair Information Discovery Plus
Overview
You can use Oracle Depot Repair Information Discovery Plus to search and filter the most critical service data in a single location and drill down to get more detailed information enabling you to take action using that information. As a service manager or a service technician, you can access the Repair Orders Dashboard. If you are a claims manager or a claims administrator, then you can access the Supplier Warranty Claims Dashboard. You use these dashboards to review and analyze data using key Performance Indicators (KPIs), performance evaluation metrics, charts, graphs, and tables.
You can search using Oracle Depot Repair dashboard pages and Endeca Information Discovery (EID) design tools. These pages are hosted in an EID environment, and called from new container pages in EBS.
Oracle Depot Repair Information Discovery Plus User Interface and Integration
Oracle Depot Repair Information Discovery Plus User Interface
Oracle Depot Repair Information Discovery Plus consists of two dashboards. Service managers and service technicians can access the Repair Orders Dashboard, and claims managers and claims administrators can access the Supplier Warranty Claims Dashboard.
Service Orders Dashboard Page
Service managers and service technicians use the Service Orders Dashboard page to view open and resolved orders to deal with current high-impact issues that need immediate resolution and to gather business intelligence and analysis of historical data. The Service Orders Dashboard page consists of three tabs - Open, Resolved, and Organization Map.
Open Tab
The Open tab in the Service Orders page displays information about open orders and displays information and data graphically and in tabular format. The page consists of the following regions and components:
The Open tab page contains filtering components that you can use to search, navigate and filter the data displayed in other components:
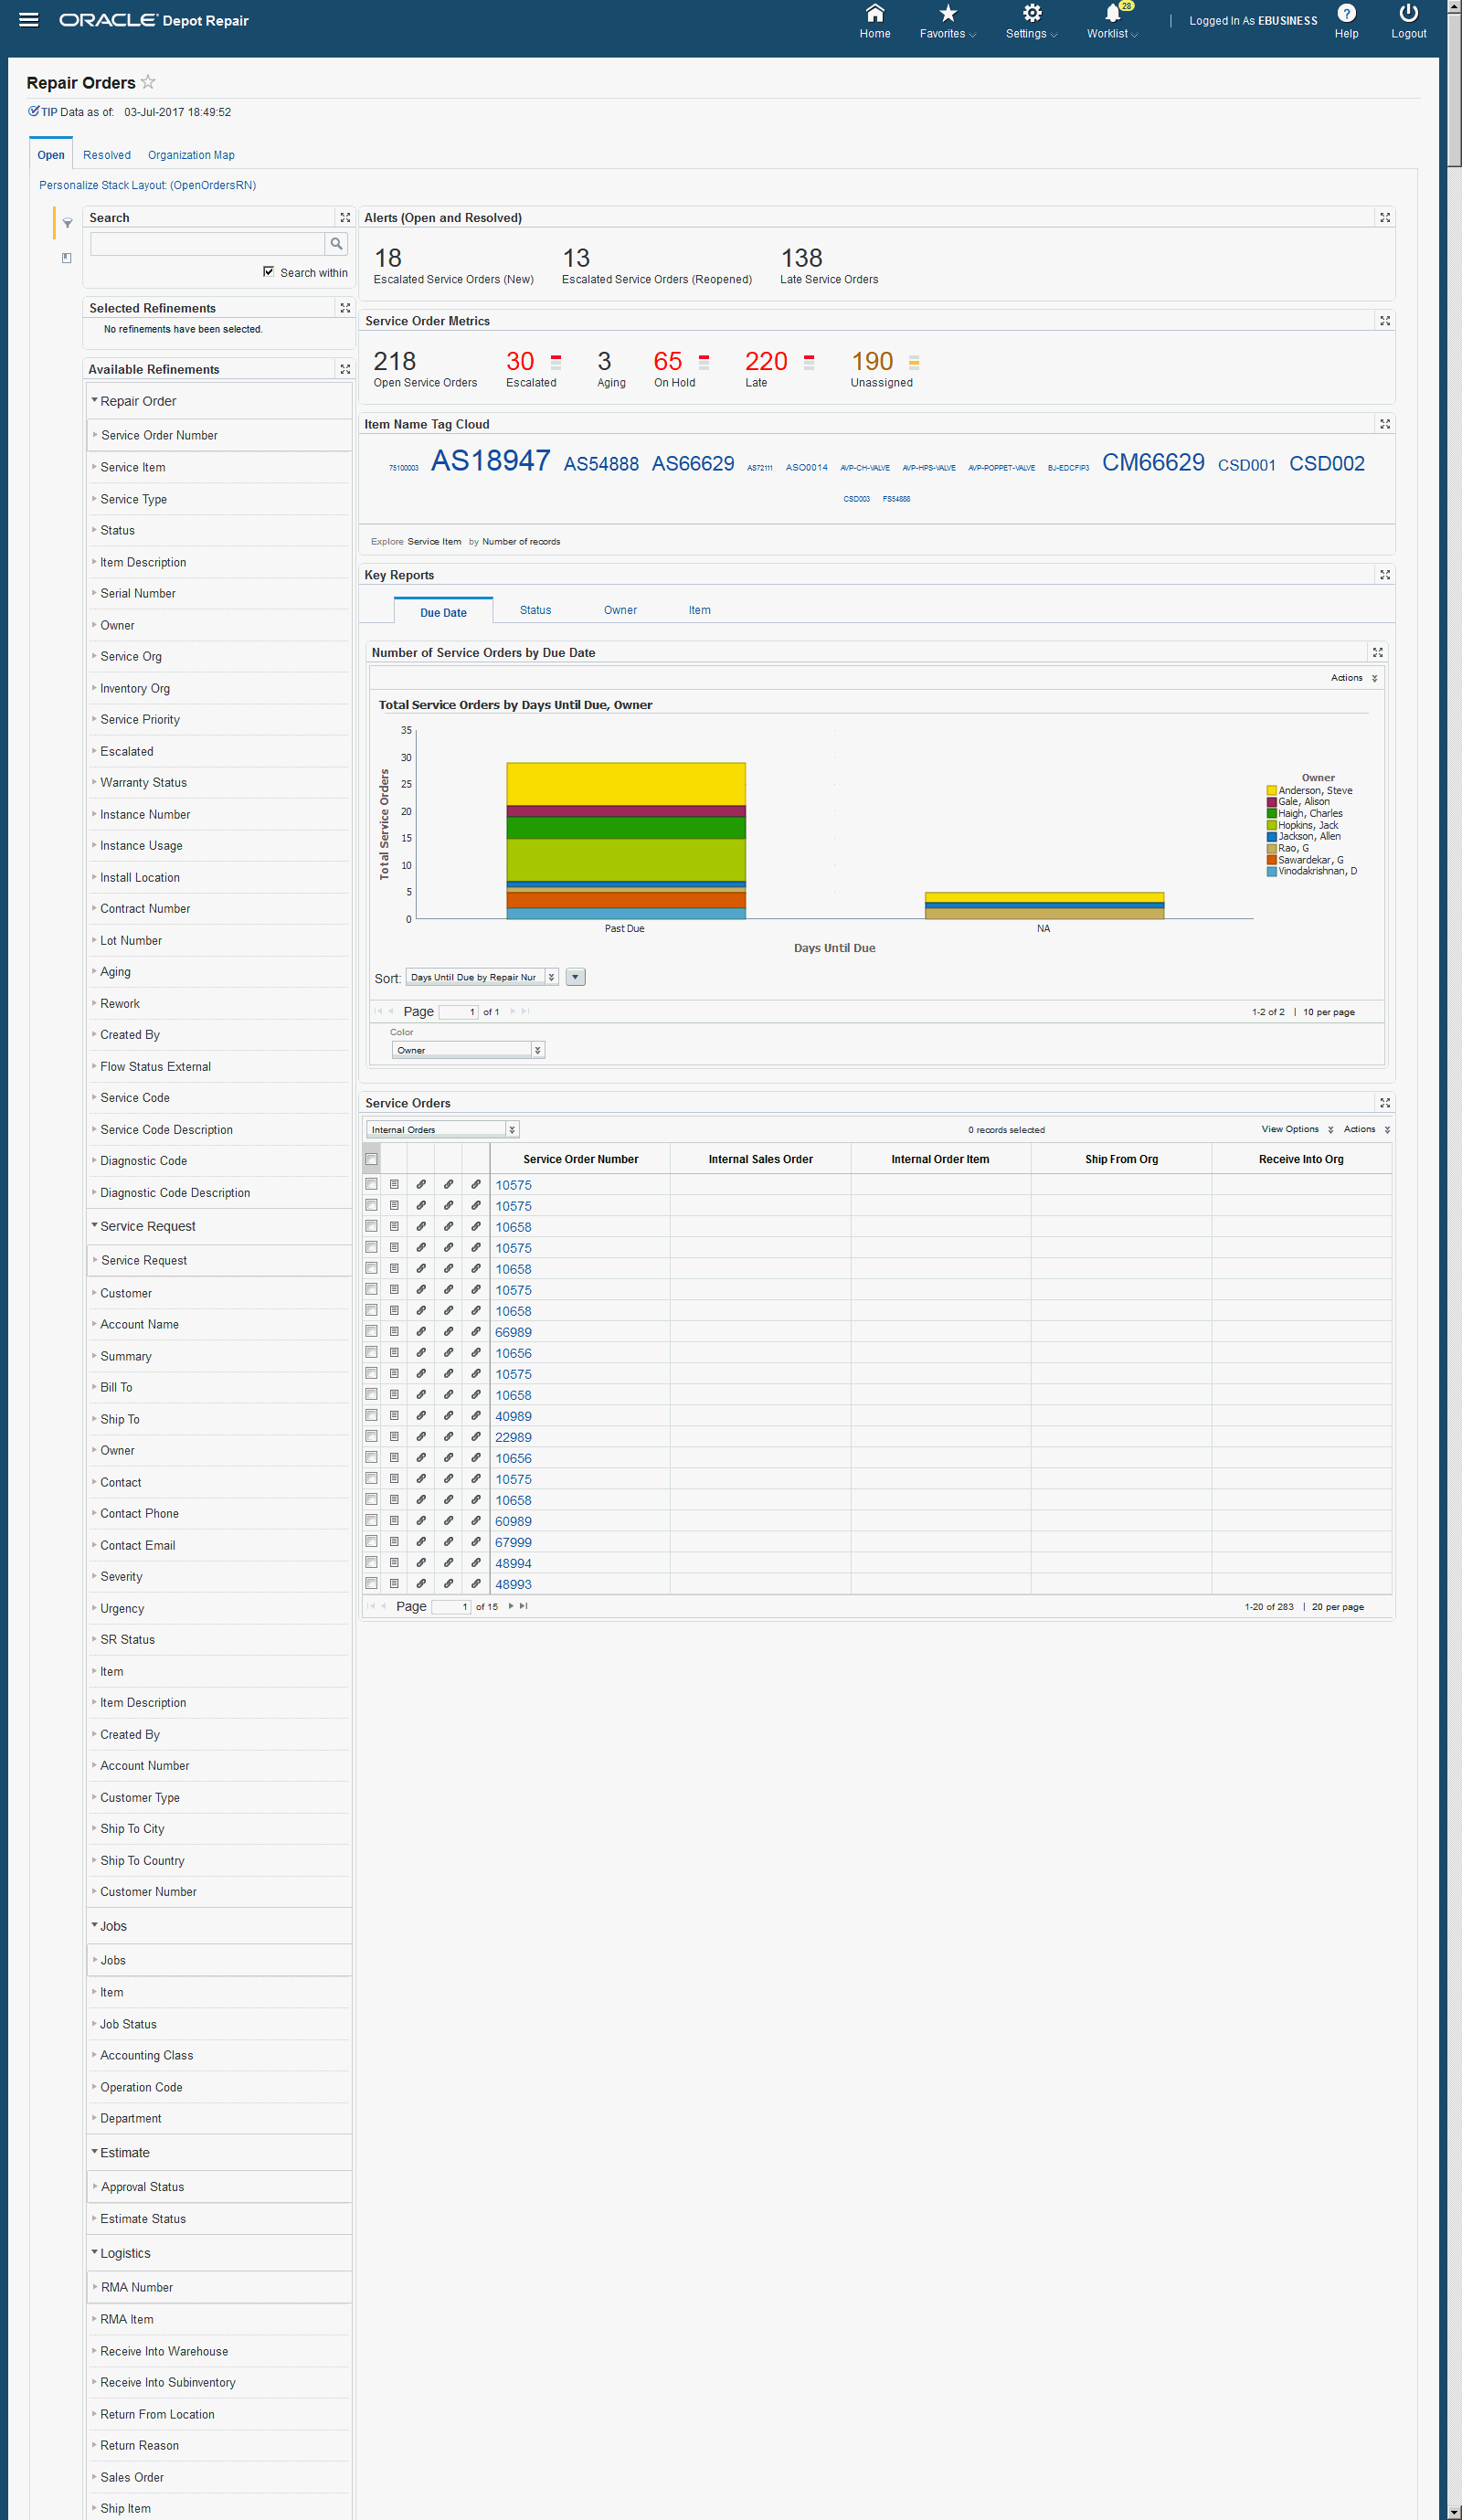
| Region | Components |
|---|---|
| Tip | Displays the date on which the data was last refreshed. |
Search
|
The Advanced Search component includes value search, record search, and partial search capabilities. You can submit keyword searches and the application provides type-ahead suggestions and displays attribute values that match the typed text. When you perform a search, the search term is added to the Selected Refinements component. As you type, you may be prompted to select a matching attribute value, or simply search for the entered text.
Additional Information: See the Advanced Search Capabilities appendix in this guide for details. Partial record search is enabled for specific attributes. Attributes for partial record search include:
|
| Selected Refinements | The Selected Refinements component displays all values that you have selected to filter data, and allows you to quickly make adjustments to the current refinement by removing items or clearing all filters from the list. |
| Bookmarks | The Bookmarks component allows you to save a given navigation and component state and return to it at a later time. |
| Available Refinements | The Available Refinements component allows you to filter data based on the currently available values or value ranges for selected attributes that are displayed within attribute groups. Expand the attribute groups to view and select attribute names. |
| Alerts (Open and Resolved) | Displays the open and resolved alerts. |
| Service Order Metrics |
|
| Item Name Tag Cloud | This tag cloud displays the distribution of all items in the result set. |
| Key Reports |
|
| Service Orders |
Table Actions include:
|
| Notifications | This displays notifications in a tabular format. |
Resolved Tab
The Resolved tab in the Service Orders page displays information about resolved orders and displays information and data graphically and in tabular format. The page consists of the following regions and components:
The Resolved tab page contains filtering components that you can use to search, navigate and filter the data displayed in other components:
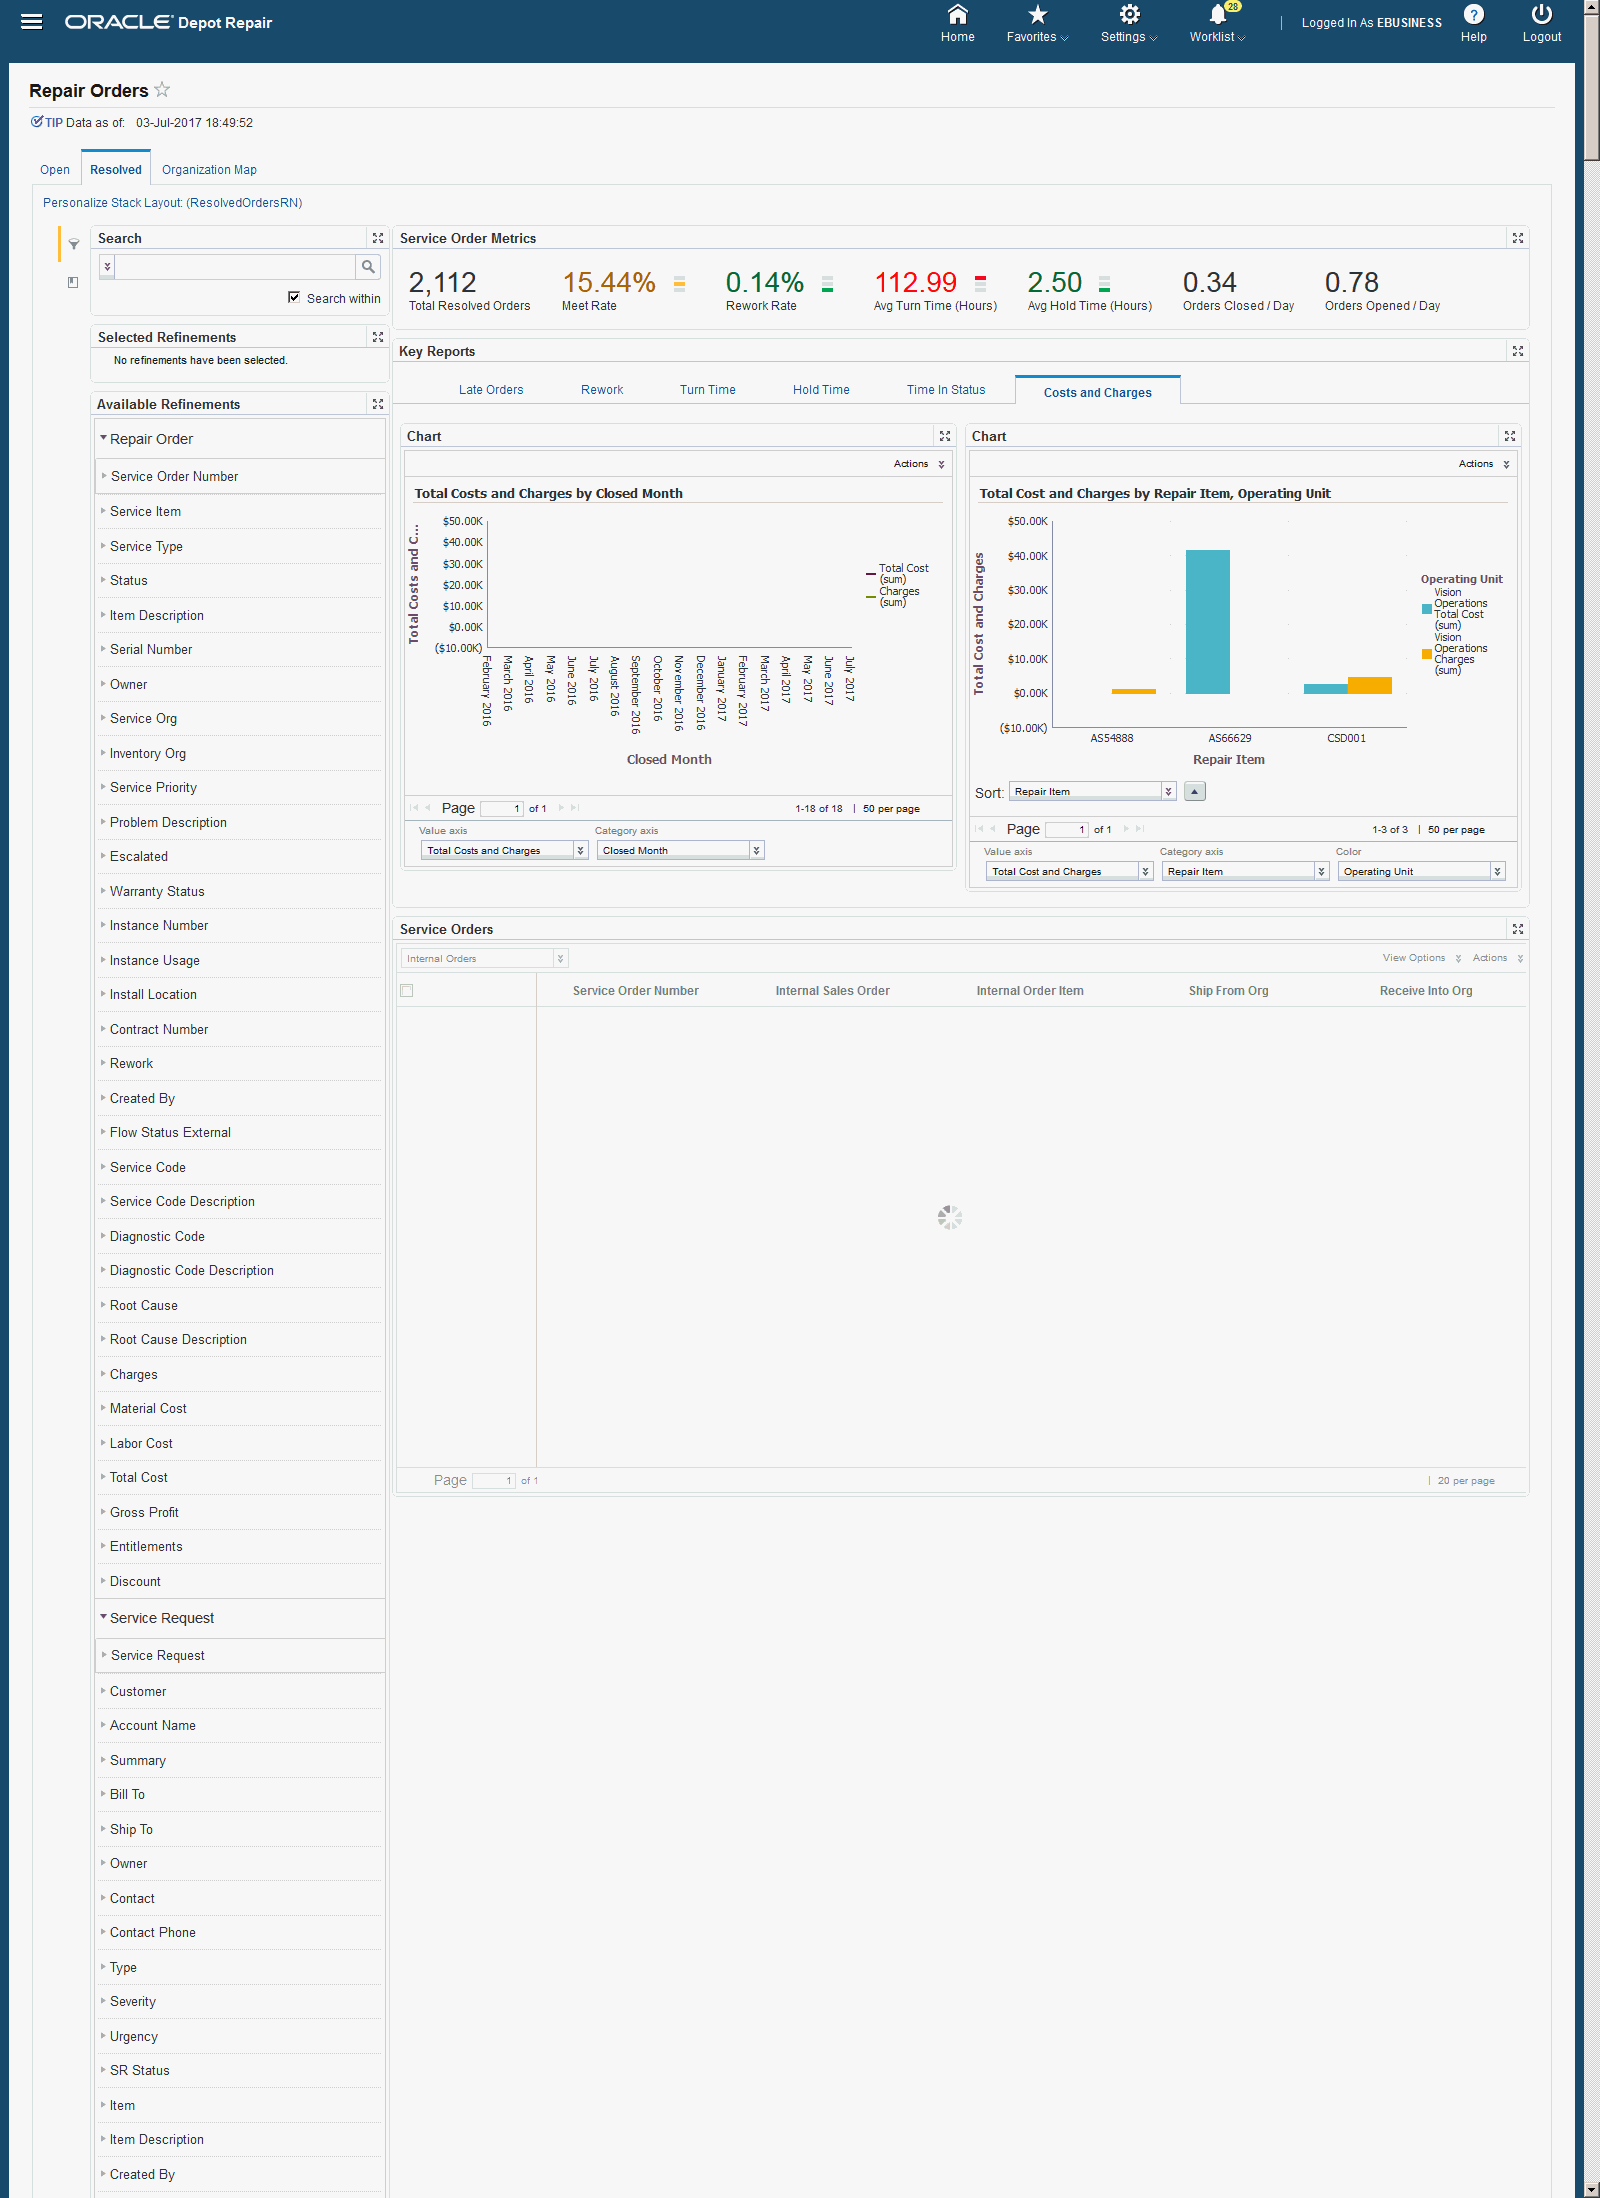
| Region | Components |
|---|---|
| Tip | Displays the date on which the data was last refreshed. |
Search
|
The Advanced Search component includes value search, record search, and partial search capabilities. You can submit keyword searches and the application provides type-ahead suggestions and displays attribute values that match the typed text. When you perform a search, the search term is added to the Selected Refinements component. As you type, you may be prompted to select a matching attribute value, or simply search for the entered text.
Additional Information: See the Advanced Search Capabilities appendix in this guide for details. Partial record search is enabled for specific attributes. Attributes for partial record search include:
|
| Selected Refinements | The Selected Refinements component displays all values that you have selected to filter data, and allows you to quickly make adjustments to the current refinement by removing items or clearing all filters from the list. |
| Bookmarks | The Bookmarks component allows you to save a given navigation and component state and return to it at a later time. |
| Available Refinements | The Available Refinements component allows you to filter data based on the currently available values or value ranges for selected attributes that are displayed within attribute groups. Expand the attribute groups to view and select attribute names. |
| Service Order Metrics |
|
| Key Reports |
|
| Service Orders |
|
| Record Details | Displays details of the selected Service Order Number. |
| Notifications | This displays notifications in a tabular format. |
Organization Map Tab
The Organization Map tab in the Repair Orders page displays information about the location of each repair inventory organization on the map. The page consists of the following regions and components:
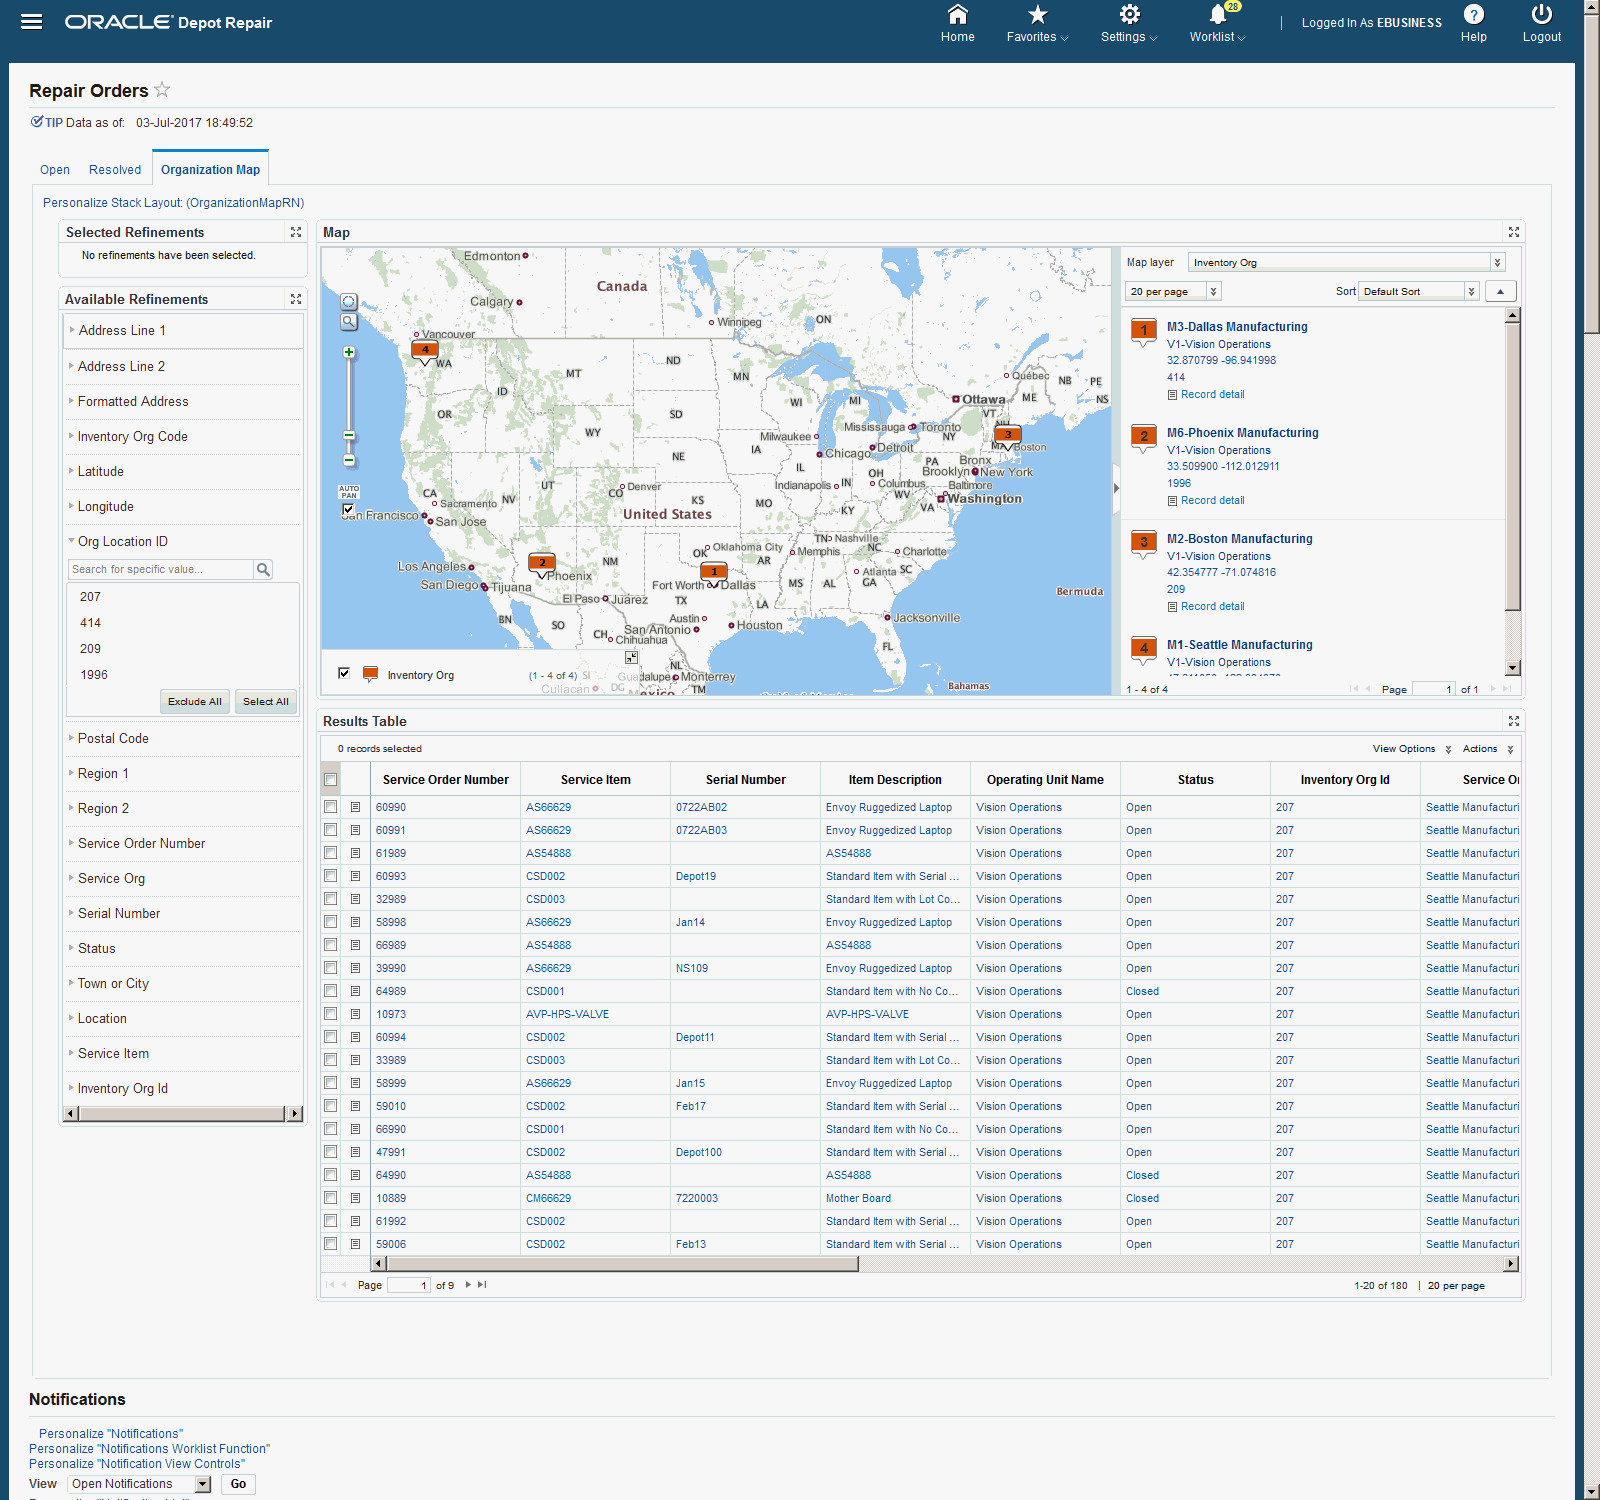
| Region | Components |
|---|---|
| Tip | Displays the date on which the data was last refreshed. |
| Selected Refinements | The Selected Refinements component displays all values that you have selected to filter data, and allows you to quickly make adjustments to the current refinement by removing items or clearing all filters from the list. |
| Available Refinements | The Available Refinements component allows you to filter data based on the currently available values or value ranges for selected attributes that are displayed within attribute groups. Expand the following attribute groups to view and select attribute names:
|
| Map | This widget displays the location of each repair inventory organization on the map. Click the location of any of the inventory organizations on the map to filter and display data about service orders assigned to the selected organization's location. |
| Results Table | The details that display on the Results Table are:
Table Actions include:
|
Supplier Warranty Claims Dashboard Page
Claims managers and claims administrators can access the Supplier Warranty Claims Dashboard page to view open and resolved orders to gather business intelligence and analysis of historical data. The Supplier Warranty Claims Dashboard page consists of two tabs - In Process and Closed.
In Process Tab
The In Process tab in the Supplier Warranty Claims Dashboard page displays information about in process claims and displays information and data graphically and in tabular format.
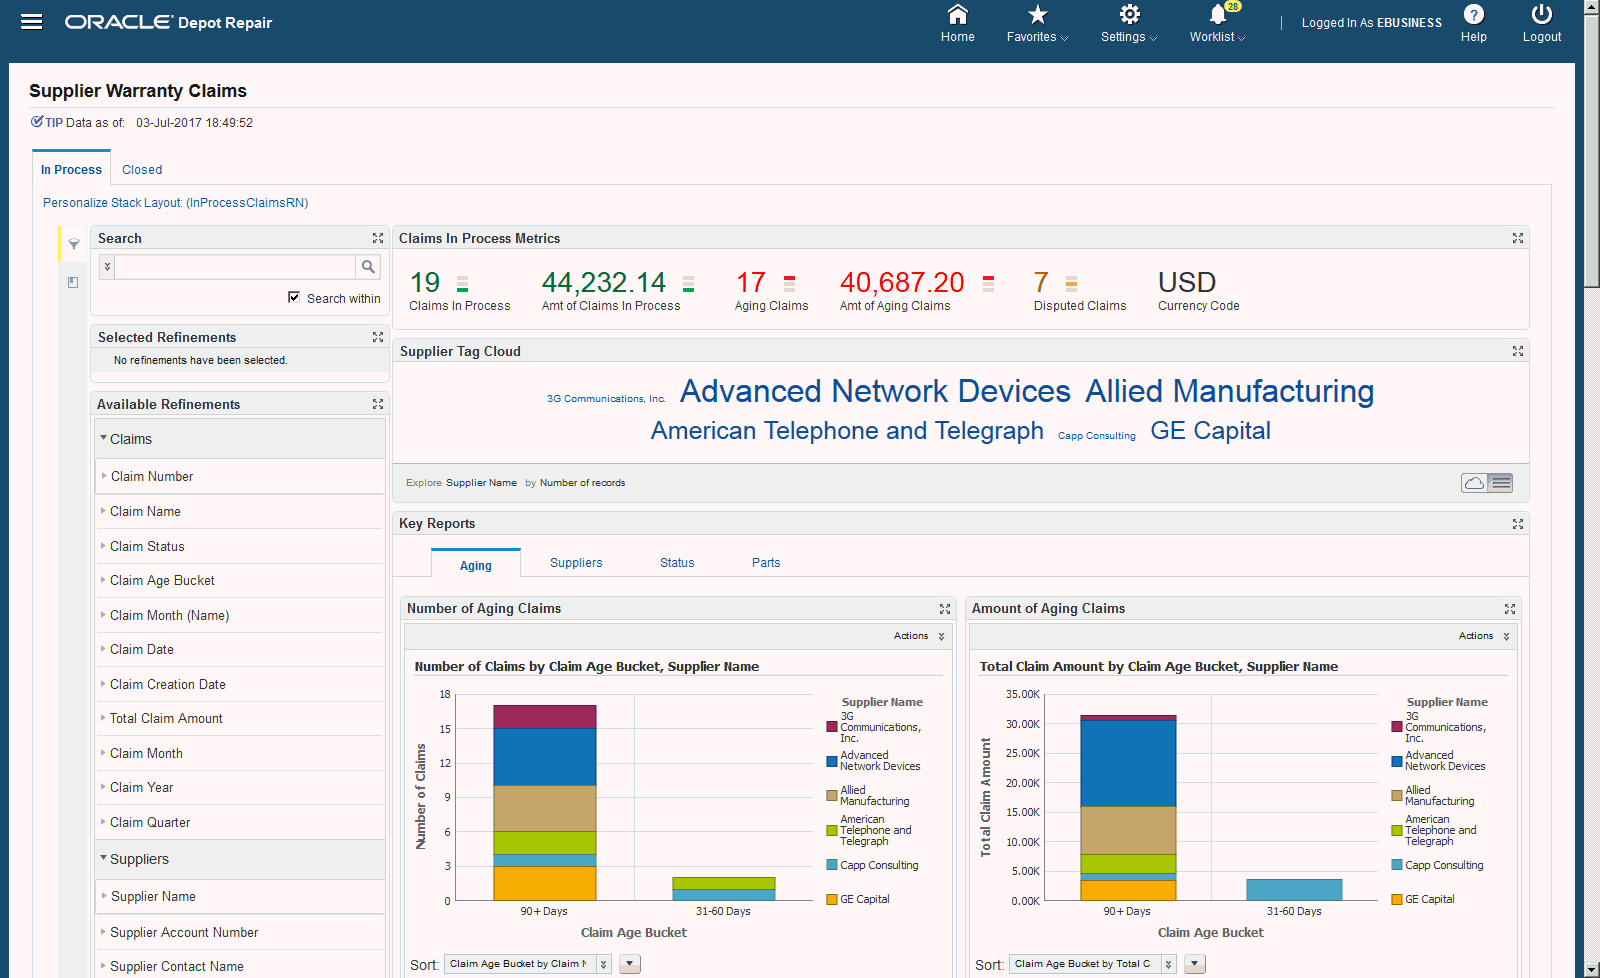
The page consists of the following regions and components:
| Region | Components |
|---|---|
| Tip | Displays the date on which the data was last refreshed. |
Search
|
The Search component allows you to submit keyword searches and provides type-ahead suggestions displaying attribute values that match the typed text. When you perform a search, the search term is added to the Selected Refinements component. As you type, you may be prompted to select a matching attribute value, or simply search for the entered text. |
| Selected Refinements | The Selected Refinements component displays all values that you have selected to filter data, and allows you to quickly make adjustments to the current refinement by removing items or clearing all filters from the list. |
| Bookmarks | The Bookmarks component allows you to save a given navigation and component state and return to it at a later time. |
| Available Refinements | The Available Refinements component allows you to filter data based on the currently available values or value ranges for selected attributes that are displayed within attribute groups. Expand the attribute groups to view and select attribute names. |
| Claims In Process Metrics |
|
| Key Reports |
|
| Supplier Warranty Claims |
|
| Supplier Warranty Claim Details | Displays the details of the selected Claim Number |
| Supplier Tag Cloud | This tag cloud displays the distribution of all suppliers with claims in the result set. |
| Notifications | This displays notifications in a tabular format. |
Closed Tab
The Closed tab in the Supplier Warranty Claims Dashboard page displays information about closed claims and displays information and data graphically and in tabular format.
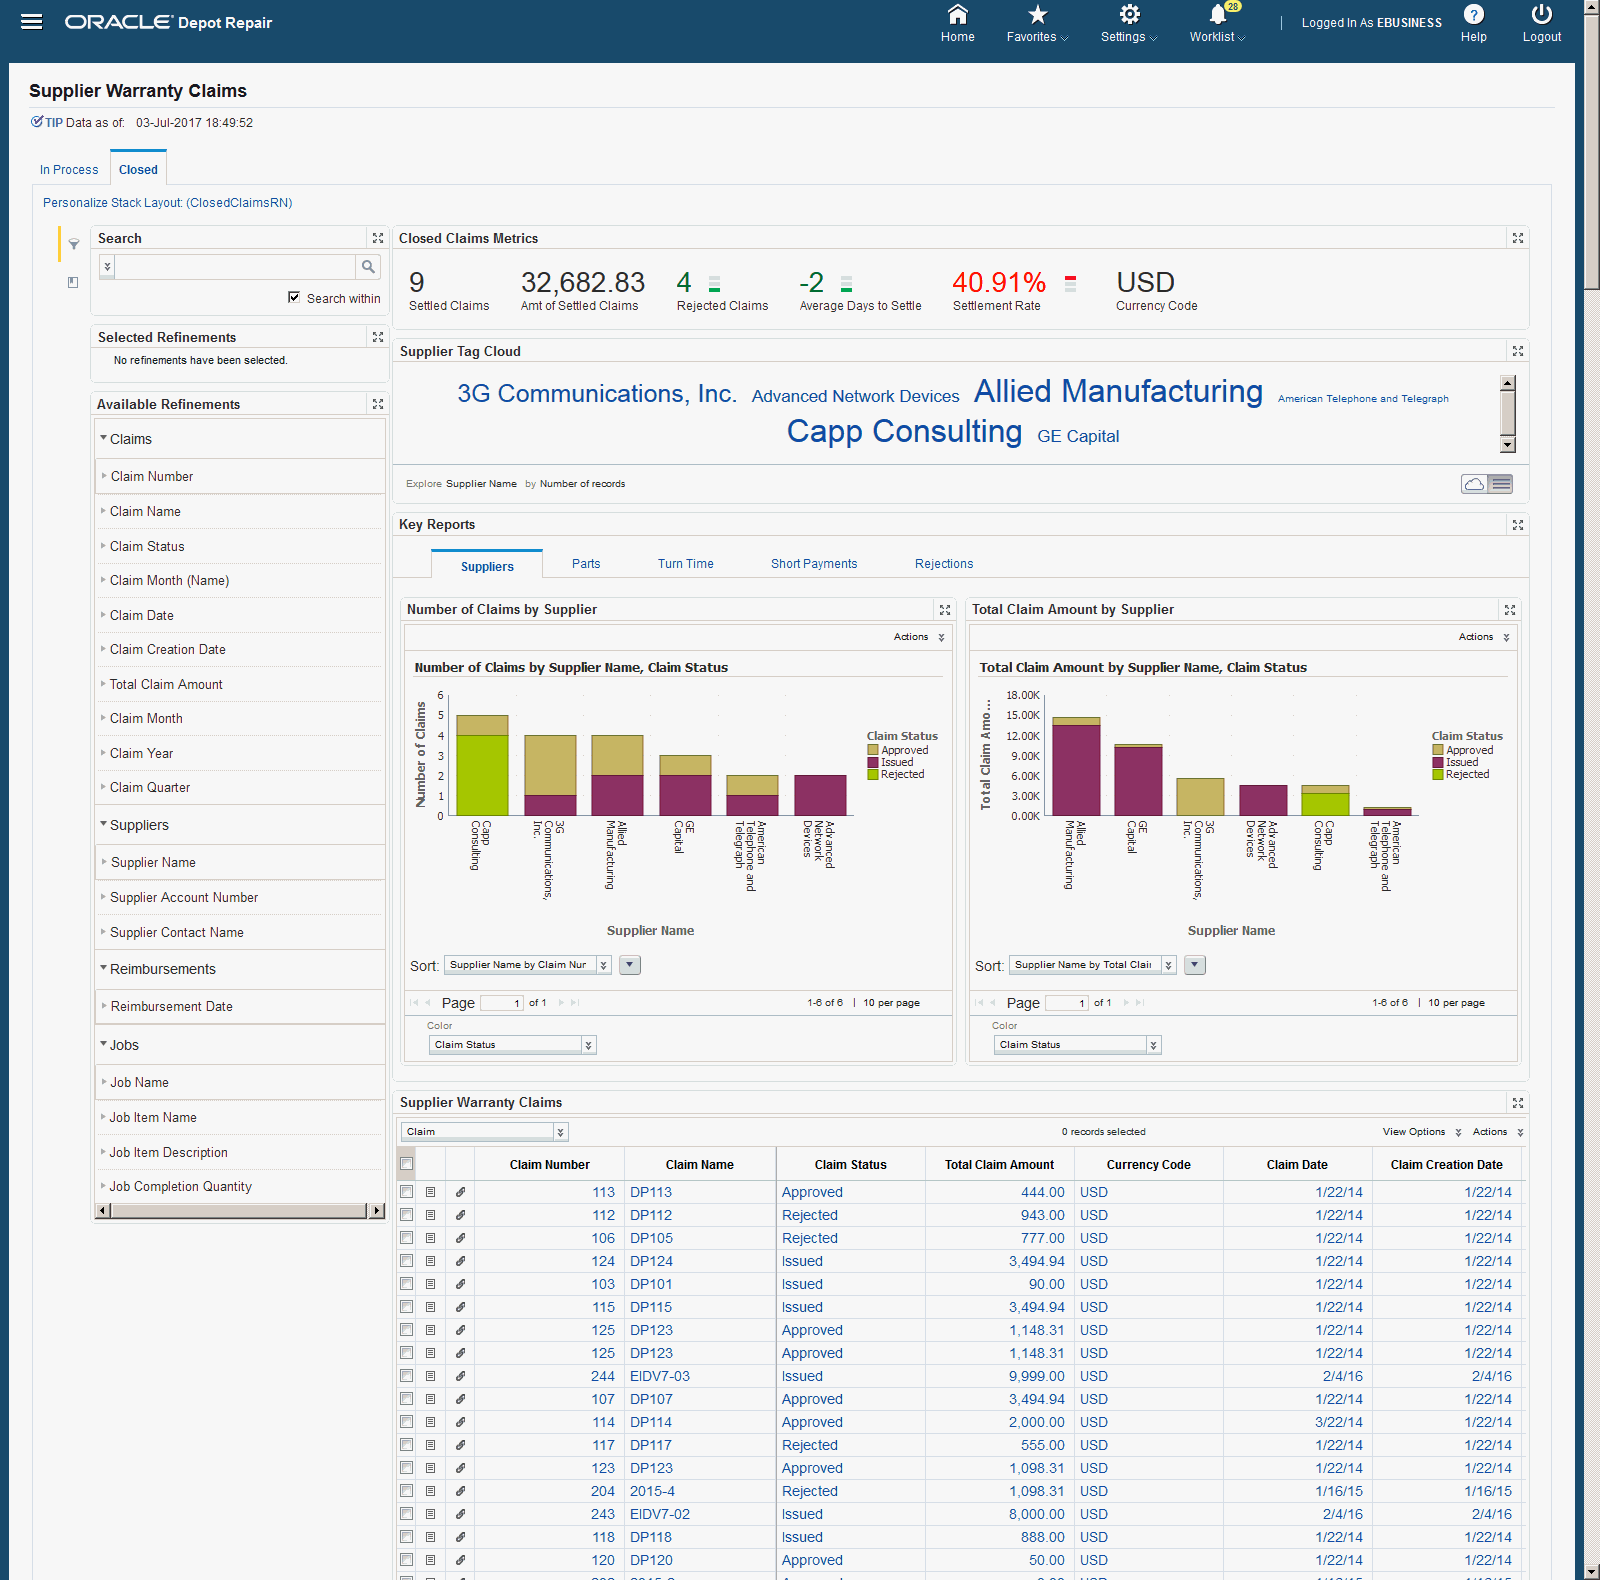
The page consists of the following regions and components:
| Region | Component |
|---|---|
| Tip | Displays the date on which the data was last refreshed. |
Search
|
The Search component allows you to submit keyword searches and provides type-ahead suggestions displaying attribute values that match the typed text. When you perform a search, the search term is added to the Selected Refinements component. As you type, you may be prompted to select a matching attribute value, or simply search for the entered text. |
| Selected Refinements | The Selected Refinements component displays all values that you have selected to filter data, and allows you to quickly make adjustments to the current refinement by removing items or clearing all filters from the list. |
| Bookmarks | The Bookmarks component allows you to save a given navigation and component state and return to it at a later time. |
| Available Refinements | The Available Refinements component allows you to filter data based on the currently available values or value ranges for selected attributes that are displayed within attribute groups. Expand the attribute groups to view and select attribute names. |
| Closed Claims Metrics |
|
| Key Reports |
|
| Supplier Warranty Claims |
|
| Supplier Warranty Claim Details | Displays the details of the selected Claim Number |
| Supplier Tag Cloud | This tag cloud displays the distribution of all suppliers with claims in the result set. |
| Notifications | This displays notifications in a tabular format. |
Oracle Depot Repair Information Discovery Plus Product Configuration
Overview
Complete the Oracle Depot Repair Information Discovery Plus product configuration after the installation and common configurations are completed as described in the Installing Oracle E-Business Suite Information Discovery, Release 12.2 V8 document (Doc ID: 2214431.1).
Set up Oracle Depot Repair Information Discovery Plus Integration
-
Add the Depot: Endeca Access Role to any predefined Oracle Depot Repair responsibility or to any custom Depot Repair responsibility. Update the Grant CSD_ENDECA_ACCESS_GRANT and the Permission Set CSD_ENDECA_ACCESS_PS.
See: Oracle E-Business Suite System Administrator's Guide - Security for more information on how to assign roles.
See: Grants in Oracle Depot Repair Information Discovery Plus
See: Permission Sets in Oracle Depot Repair Information Discovery Plus
See: Oracle E-Business Suite System Administrator's Guide - Security for more information on how to assign roles.
See: Appendix C: Adding Roles to Responsibilities and Setting Security Context in Installing Oracle E-Business Suite Information Discovery, Release 12.2 V8 document (Doc ID: 2214431.1)
-
Run the Full Graph to complete the initial data load for Oracle Depot Repair Information Discovery.
See: Installing Oracle E-Business Suite Information Discovery, Release 12.2 V8 (Doc ID: 2214431.1)
-
Run the Full Load Graph.
-
Set up the Scheduler.
Running the Full Load Graph
Once you have run the full load graph in accordance with the Installing Oracle E-Business Suite Information Discovery, Release 12.2 V8 document (Doc ID: 2214431.1), attribute configuration is loaded for all seeded attributes. Additionally, you need to run the following full data loads as follows:
To run a full Endeca Refresh on the Integrator Server
-
Login to Integrator server using your Clover login.
-
Click the Scheduling tab.
-
Select the New Schedule link.
-
Enter a Description for the scheduler, for example, Depot Repair Full Load Load Scheduler.
-
Select Periodic as the Type.
-
Select by interval as the Periodicity.
-
Enter a start date and time in the Not active before date/time field.
-
Enter an end date and time in the Not active after date/time field.
-
Enter a value in the Interval (minutes) field.
-
Ensure you select the Fire misfired event as soon as possible check box.
-
Select Execute graph from the Task Type list.
-
Select csd from the Sandbox list.
-
Select graph/FullLoadConfig.grf from the Graph list.
-
Click Create to set the scheduler.
Setting Up the Scheduler for Incremental Refresh
Once the Full graph is run in accordance with the Installing Oracle E-Business Suite Information Discovery, Release 12.2 V8 document (Doc ID: 2214431.1), initial data load for Oracle Depot Repair Information Discovery Plus is complete. For incremental refresh, you must determine how often the Endeca data should be refreshed from EBS depending upon your organizational requirements. Oracle recommends that you keep this near real time. As the data is updated in the EBS, you need to ensure it is updated in the endeca MDEX server. You set up the Scheduler to load incremental graphs depending on the volume of information requiring update.
To set up the scheduler
-
Login to Integrator server using your Clover login.
-
Click the Scheduling tab.
-
Select the New Schedule link.
-
Enter a Description for the scheduler, for example, Depot Repair Incremental Load Scheduler.
-
Select Periodic as the Type.
-
Select by interval as the Periodicity.
-
Enter a start date and time in the Not active before date/time field.
-
Enter an end date and time in the Not active after date/time field.
-
Enter a value in the Interval (minutes) field.
-
Ensure you select the Fire misfired event as soon as possible check box.
-
Select Start a graph from the Task Type list.
-
Select csd from the Sandbox list.
-
Select graph/IncrementalLoadConfig.grf from the Graph list.
-
Click Create to set the scheduler.
Technical Integration Components
Roles in Oracle Depot Repair Information Discovery Plus
-
Role Name: Depot: Endeca Access Role
-
Code: CSD_ENDECA_ACCESS_ROLE
Grants in Oracle Depot Repair Information Discovery Plus
-
Grant Name: Depot: Endeca Access Role
-
Grant Code: CSD_ENDECA_ACCESS_GRANT
-
Grantee Type: Group of Users
-
Grantee: Depot: Endeca Access Role
-
Responsibility - select a predefined responsibility or a custom responsibility of your choice
-
Permission Set Code: CSD_ENDECA_ACCESS_PS
-
Permission Set Name- Depot: Endeca Access Permission Set
Permission Sets in Oracle Depot Repair Information Discovery Plus
-
Permission Set Name- Depot: Endeca Access Permission Set
-
Permission Set Code - CSD_ENDECA_ACCESS_PS
-
Permissions Included in the Set: Depot: Repair Orders Endeca Page (CSD_ENDECA_REPAIRS_DASHBOARD_PG) and Depot: Supplier Warranty Endeca Dashboard PG (CSD_ENDECA_SUPWAR_DASHBOARD_PG)
Views and Joins to Load Oracle Depot Repair Information Discovery Plus
The following views are used by the ETL layer in Oracle Endeca to load and display Oracle Depot Repair Information Discovery Plus data to the Oracle Endeca data store:
-
CSD_EID_SW_CLAIM_LINES_V - View to load Supplier Warranty Claims information.
-
CSD_EID_REPAIRS_V - View to load Repair Orders information.
-
CSD_EID_REPAIRS_INCR_V - View to load data from incremental refresh.
-
CSD_EID_INV_ORG_MAP_V - View to load map data.
Menus and Functions in Oracle Depot Repair Information Discovery Plus
The following functions are available for the Depot Repair Depot Menu (CSD_DEPOT_MENU) in Oracle Depot Repair Information Discovery Plus:
| Function Code | User Function Name | Function Type | Web HTML Call |
|---|---|---|---|
| CSD_ENDECA_SUPWAR_DASHBOARD_PG | Supplier Warranty Claims Dashboard | JSP | OA.jsp?page=/oracle/apps/csd/endeca/supwar/webui/EndecaSupwarrantyPG |
| CSD_ENDECA_REPAIRS_DASHBOARD_PG | Repair Orders Dashboard | JSP | OA.jsp?page=/oracle/apps/csd/endeca/ro/webui/EndecaRepairDashboardPG |
| CSD_ENDECA_INV_ORG_MAP | Inventory Organization Map View | JSP | GWY.jsp?targetAppType=Endeca&targetpage=web/csd-ro/csd_endeca_inv_org_map |
The following functions are available for the Depot Repair Supplier Warranty Menu (CSD_SUPPLIER_WARRANTY_SUBMENU) in Oracle Depot Repair Information Discovery Plus:
| Function Code | User Function Name | Function Type | Web HTML Call |
|---|---|---|---|
| CSD_ENDECA_SUPWAR_DASHBOARD_PG | Supplier Warranty Claims Dashboard | JSP | OA.jsp?page=/oracle/apps/csd/endeca/supwar/webui/EndecaSupwarrantyPG |