Oracle Financials Information Discovery Plus: Fixed Assets
This chapter covers the following topics:
- Overview
- Asset Reconciliation Page
- Asset Cost Page
- Asset Aging Page
- Asset Location Page
- Mass Transactions Page
- Additions Pipeline Page
- Setting Up Oracle Fixed Assets Information Discovery
- Setup and Configuration Steps
- Access Control: Hide and Show EID Dashboards (User Interfaces) for Oracle Fixed Assets
- Scheduling Setup for Full Endeca Upload or Refresh
- ETL Parameters for Fixed Assets
- Profile Options for Fixed Assets
- Views and Joins for Fixed Assets
- Menus for Endeca Fixed Assets
Overview
The Fixed Asset Manager can use the Oracle Financials Information Discovery Plus: Fixed Assets to search and filter assets, locations, and pending mass additions. Oracle Financials Information Discovery Plus: Fixed Assets empowers fixed asset managers and fixed asset accountants to optimize asset utilization, explore asset locations and assignments, and ease reconciliation of assets by providing powerful search and sophisticated available refinements capabilities. The operational efficiency and insight into the asset life cycle is greatly enhanced through key fixed asset metrics, drillable graphs, alerts, and tag clouds, enabling users to quickly identify problem areas and outstanding items that require intervention. Oracle Financials Information Discovery Plus: Fixed Assets allows users to efficiently navigate to the relevant Oracle Applications to take corrective action as necessary.
You can search using Fixed Assets pages and Information Discovery (EID) design tools. These pages are hosted in an EID environment, and called from new container pages in EBS. In Fixed Assets, the following pages enable search functions using Endeca Information Discovery integration:
-
Asset Reconciliation Page: This page displays reconciliation information between fixed asset accounts in SLA (Sub-Ledger Accounting) and in GL (General Ledger). The Fixed Asset Manager can quickly compare balances between SLA and GL, investigate discrepancies and take required and corrective actions.
-
Asset Cost Page: This page offers superior navigation and discovery capabilities into all financial transactions affecting asset values and provides reconciliation of accounted asset cost and accumulated depreciation to balances in Oracle General Ledger.
-
Asset Aging Page: This page offers insight into remaining life of your assets with easy overview of asset cost, accumulated depreciation and net book value, and offers actionable links to submit a work request in Oracle Enterprise Asset Management, or to create a new purchase requisition in Oracle Procurement
-
Asset Locations Page: This Page offers tracking of fixed assets across all locations and gives the opportunity to explore assignments to employees, to detect discrepancies in cost center assignments, and provides actionable links to execute asset transfers and assignments in Oracle Assets in order to resolve missing assignments or mis-allocated resources.
-
Mass Transactions Page: This page offers insight into pending transactions such as mass additions, mass reclassifications, mass revaluations, and mass transfers. It provides actionable links to Oracle Assets for the fixed asset accountant to ensure all pending transactions are processed on time in order to close asset books with confidence.
-
Additions Pipeline Page: This page allows the fixed assets manager to check all additions pipeline that exist in Payables and Projects that affect asset costs.
This chapter provides product-specific details required to integrate Endeca Information Discovery (EID) with Oracle E-Business Suite Release 12.2 V8 for the Oracle Fixed Assets Information Discovery application. This supplements the information provided in Installing Oracle E-Business Suite Information Discovery, Release 12.2 V8 (Doc ID: 2214431.1). You must read this document and make note of the requirements before you begin your installation.
Oracle Financials Information Discovery Plus: Fixed Assets User Interfaces
Asset Reconciliation Page
The Asset Reconciliation Page displays an overview and visibility into all asset accounts balances. Account balances for Oracle Assets and Oracle General Ledger display side by side making discrepancies easy to identify. The Asset Reconciliation page:
-
Reconciles the year-to-date activities
-
Finds discrepancies between Fixed Assets and General Ledger balances
-
Minimizes errors and increases accuracy of financial statements
From the Assets Super User responsibility, navigate to the Asset Reconciliation page:
(N) Assets Information Discovery
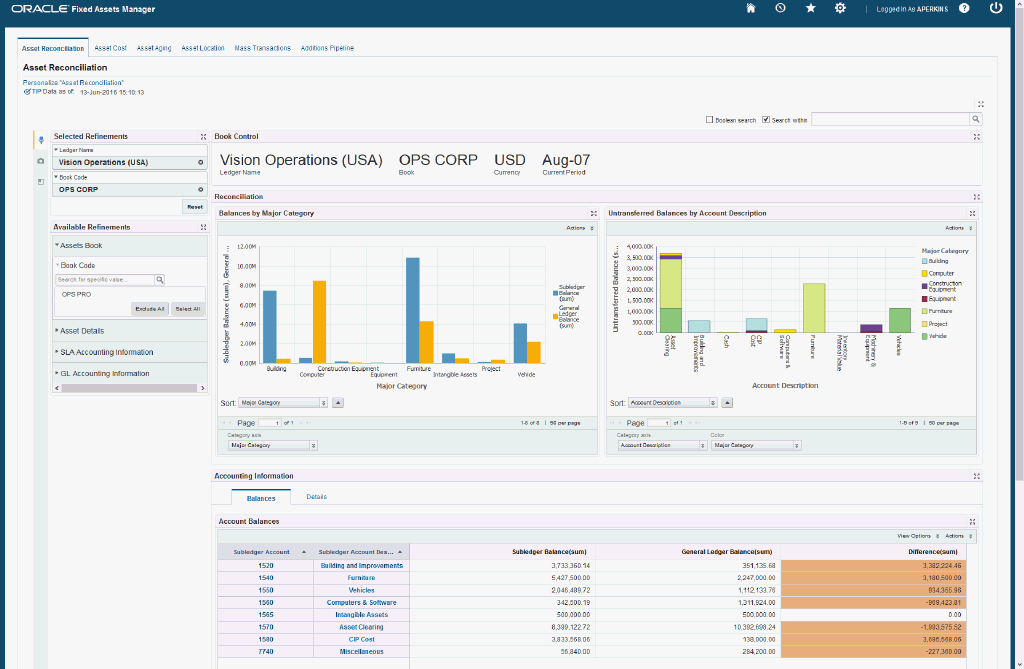
Within the Asset Reconciliation page, you can highlight asset book and GL accounting discrepancies. This page displays reconciliation information between fixed asset accounts in SLA (Sub-Ledger Accounting) and in GL (General Ledger). The Fixed Asset Manager can quickly compare information between SLA and GL, investigate discrepancies and take required and corrective action. You can analyze data using asset metrics, charts, graphs, and tables. The following describes the Asset Reconciliation page regions and components:
| Region | Components |
|---|---|
Advanced Search
|
The Advanced Search component includes value search, record search, Boolean search, and partial search capabilities. You can submit keyword searches and the application provides type-ahead suggestions and displays attribute values that match the typed text. When you perform a search, the search term is added to the Selected Refinements component. As you type, you may be prompted to select a matching attribute value, or simply search for the entered text.
Additional Information: See the Advanced Search Capabilities appendix in this guide for details. |
| Bookmarks | The Bookmarks component allows you to save a given navigation and component state so that you can return to it at a later time. |
| Selected Refinements | The Selected Refinements component displays all values that you have selected to filter the data, and allows you to quickly make adjustments to the current refinement by removing items from the list or clearing all filters. |
| Available Refinements | The Available Refinements component allows you to filter data based on the current available values or value ranges for selected attributes that are displayed within attribute groups. Expand the following attribute groups to view and select attribute names:
|
| Book Control (summarization bar) | Book Control contains the following dimension values that spotlight items:
|
| Reconciliation (component container) | Balances by Major Category (chart) The Balances by Major Category chart displays the total account balances for asset cost accounts, accumulated depreciation accounts, CIP cost accounts, and clearing accounts by asset major category. You can change the category axis to SLA Account Description.
Untransferred Balances by Account Description This chart displays the total untransferred balances to General Ledger by account description and assets major category. You can change the category axis to Account Line Type.
|
| Accounting Information (tabbed component container) Balances (tab) |
Account Balances (results table) The Account Balances results table displays account balances information. |
| Accounting Information (tabbed component container) Details (tab) |
Account Details (results table) The Account Details results table displays accounting detail information.
|
Asset Cost Page
The Asset Cost page displays an overview of asset cost and accumulated depreciation by category, and a reconciliation between Fixed Assets (FA) and General Ledger (GL) by account for both cost and accumulated depreciation. You can view asset cost metrics, asset cost charts, and results tables. The following is a display of the Asset Cost page.
From the Assets Super User responsibility, navigate to the Asset Cost page:
(N) Assets Information Discovery
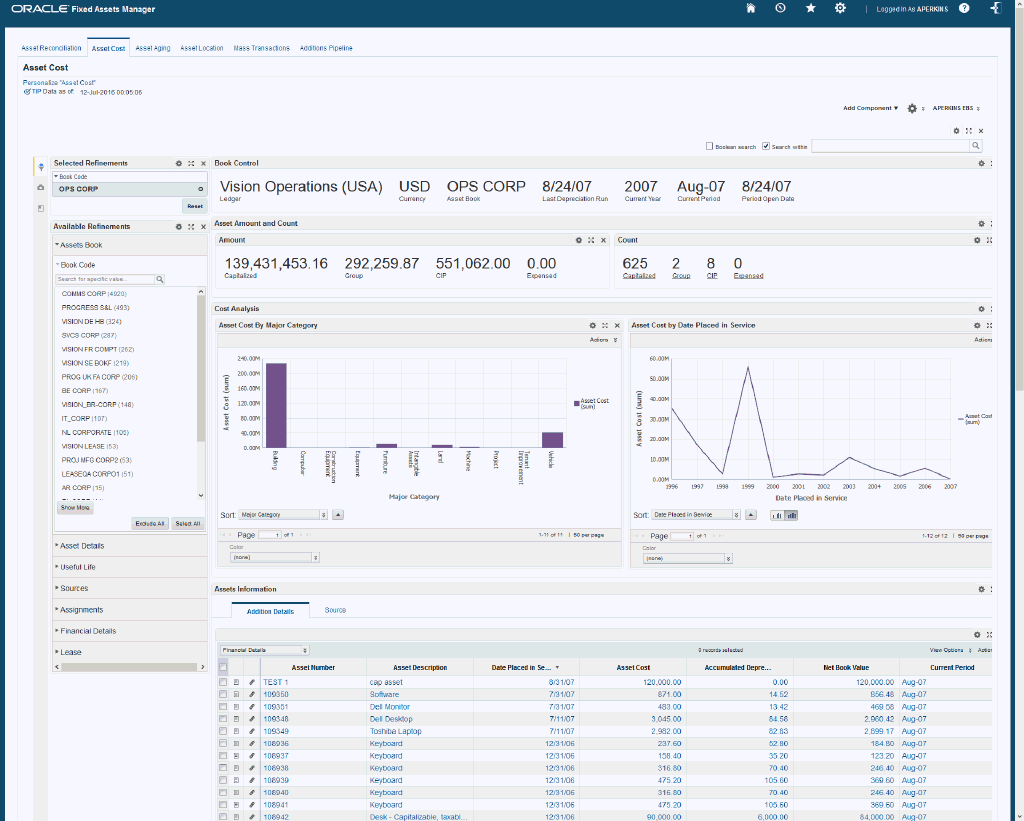
Within the Asset Cost page, you can track asset costs and accumulated depreciation balance by major category. You can analyze data using asset metrics, charts, graphs, and tables. The following describes the Asset Cost page regions and components:
| Region | Components |
|---|---|
Advanced Search
|
The Advanced Search component includes value search, record search, Boolean search, and partial search capabilities. You can submit keyword searches and the application provides type-ahead suggestions and displays attribute values that match the typed text. When you perform a search, the search term is added to the Selected Refinements component. As you type, you may be prompted to select a matching attribute value, or simply search for the entered text.
Additional Information: See the Advanced Search Capabilities appendix in this guide for details. |
| Bookmarks | The Bookmarks component allows you to save a given navigation and component state so that you can return to it at a later time. |
| Selected Refinements | The Selected Refinements component displays all values that you have selected to filter the data, and allows you to quickly make adjustments to the current refinement by removing items from the list or clearing all filters. |
| Available Refinements | The Available Refinements component allows you to filter data based on the current available values or value ranges for selected attributes that are displayed within attribute groups. Expand the following attribute groups to view and select attribute names:
|
| Book Control (summarization bar) | Book Control contains the following dimensions value spotlight items:
|
| Asset Amount and Count (summarization bar component container) | Amount
Count
|
| Asset Analysis (tabbed component container) Accounts Reconciliation (tab) |
Balances (chart) The Balances chart displays the total account balances for asset cost accounts and accumulated depreciation accounts by asset major category. You can change the category axis to account code and account description.
|
| Asset Analysis (tabbed component container) Cost Analysis (tab) |
Asset Cost by Major Category (chart) The chart displays asset cost across the major categories with the availability to drill down to Minor Category and Property Type.
Asset Cost by Date Placed in Service (chart) The chart displays asset cost by data placed in service (in years) with availability to drill down to Month then Day.
|
| Balance Reconciliation (component container) | Balance Reconciliation (results table) The Balance Reconciliation results table helps the asset manager to find any discrepancies in balances between fixed assets and general ledger, and also helps to speed the closing process.
|
| Assets Information (tabbed component container) | Addition Details (results table)
Source (results table)
|
Asset Aging Page
The Asset Aging page allows the fixed assets manager to search assets and displays aging assets and useful asset life information. You can view asset aging metrics, charts, and results tables. The following is a display of the Asset Aging page.
From the Assets Super User responsibility, navigate to the Asset Aging page:
(N) Assets Information Discovery > Asset Aging (tab)
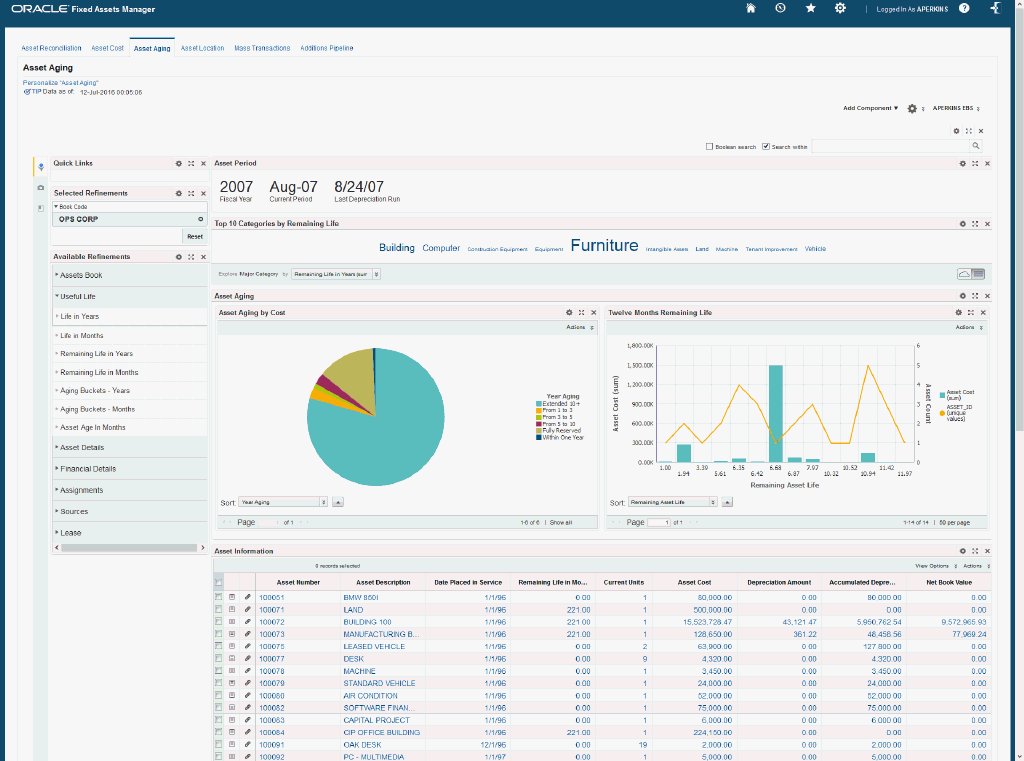
Within the Asset Aging page, you can track asset aging and useful asset life information by category. You can analyze data using asset aging metrics, charts, graphs, and results tables. The following describes the Asset Aging page regions and components:
| Region | Components |
|---|---|
Advanced Search
|
The Advanced Search component includes value search, record search, Boolean search, and partial search capabilities. You can submit keyword searches and the application provides type-ahead suggestions and displays attribute values that match the typed text. When you perform a search, the search term is added to the Selected Refinements component. As you type, you may be prompted to select a matching attribute value, or simply search for the entered text.
Additional Information: See the Advanced Search Capabilities appendix in this guide for details. |
| EBS Quick Links | Use the EBS Quick Links component to link to quickly navigate to other EBS Information Discovery Extensions. This component provides a link to the Maintenance Work Request OA page. |
| Bookmarks | The Bookmarks Component allows you to save a given navigation and component state so that you can return to it at a later time. |
| Selected Refinements | The Selected Refinements component displays all values that you have selected to filter the data, and allows you to quickly make adjustments to the current refinement by removing items from the list or clearing all filters. |
| Available Refinements | The Available Refinements component allows you to filter data based on the current available values or value ranges for selected attributes that are displayed within attribute groups. Expand the following attribute groups to view and select attribute names:
|
| Top 10 Categories by Remaining Life (tag cloud container) | Top 10 Categories by Remaining Life
Note: The Top 10 Categories by Remaining Life tag cloud component displays the top ten asset categories by remaining life. The categories display in relative sizes by frequency of occurrence.
|
| Asset Aging (component container) | Asset Aging by Cost (chart) The chart displays the aging buckets for assets (in years) and drills down to month aging.
Twelve Months Remaining Life (chart) Note: The chart displays the count and the cost of assets that will complete their life within a year (asset life due in a year).
|
| Asset Information (component container) | Asset Aging Information (results table)
Note: The Asset Aging Information table displays financial information for the asset's useful life.
|
Asset Location Page
The Asset Location page allows the fixed assets manager to search assets by location or by employees assigned to asset groups. You can view asset location metrics, charts, and results tables. The following is a display of the Asset Location page.
From the Assets Super User responsibility, navigate to the Asset Location page:
(N) Assets Information Discovery > Asset Location (tab)
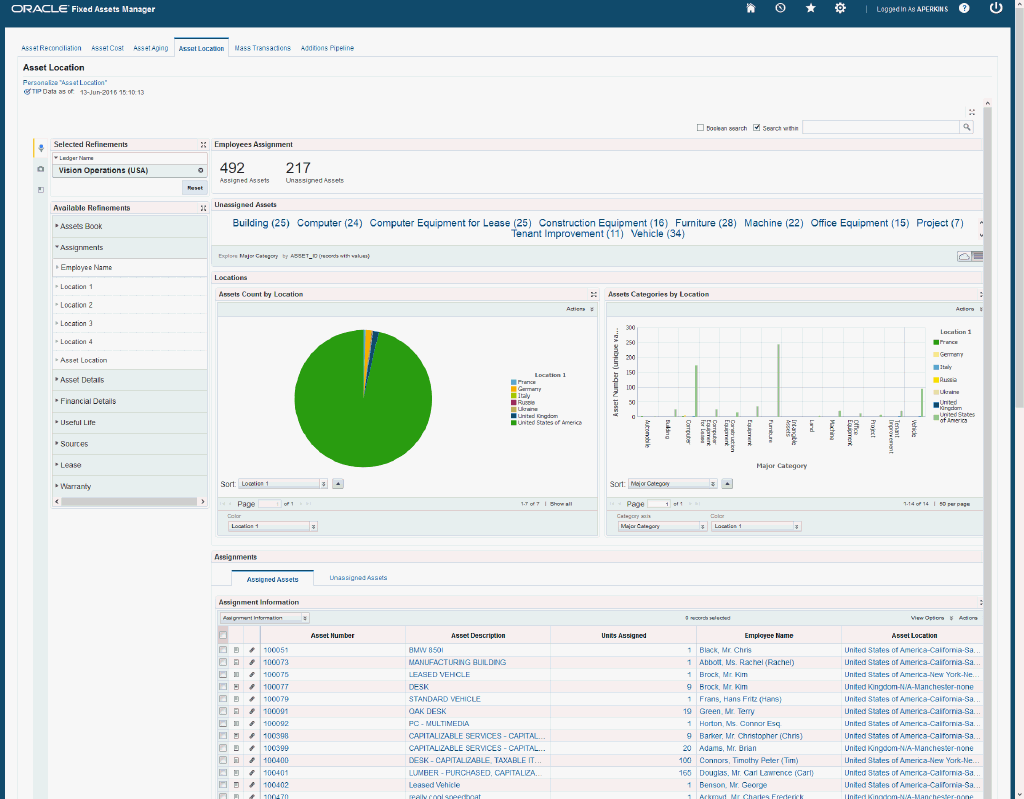
Within the Asset Location page, you can select the ledger and asset book to check the location or assignment of a specific asset or group of assets. You can analyze data using asset location metrics, charts, graphs, and results tables. The following describes the Asset Location page regions and components:
| Region | Components |
|---|---|
Advanced Search
|
The Advanced Search component includes value search, record search, Boolean search, and partial search capabilities. You can submit keyword searches and the application provides type-ahead suggestions and displays attribute values that match the typed text. When you perform a search, the search term is added to the Selected Refinements component. As you type, you may be prompted to select a matching attribute value, or simply search for the entered text.
Additional Information: See the Advanced Search Capabilities appendix in this guide for details. |
| Bookmarks | The Bookmarks Component allows you to save a given navigation and component state so that you can return to it at a later time. |
| Selected Refinements | The Selected Refinements component displays all values that you have selected to filter the data, and allows you to quickly make adjustments to the current refinement by removing items from the list or clearing all filters. |
| Available Refinements | The Available Refinements component allows you to filter data based on the current available values or value ranges for selected attributes that are displayed within attribute groups. Expand the following attribute groups to view and select attribute names:
|
| Employees Assignment (summarization bar) | The Employees Assignment summarization bar displays the number of assigned assets and unassigned assets to employees and contains the following metrics:
|
| Unassigned Assets (tag cloud) | Unassigned Assets
Note: The Unassigned Assets tag cloud component displays the top unassigned assets by major category. You can drill down from the major category to the minor category by selecting a value within the tag cloud. Selections appear in the Selected Refinements component. |
| Locations (component container) | Assets Count by Location (chart)
Note: The chart displays assets count by location segments.
Assets Categories by Location (chart) Note: The chart displays the asset cost by major category and by location.
|
| Results Table (tabbed component container) | Assignment Details (results table)
Note: The Assignment Details results table displays assignment information.
Unassigned Assets (results table) Note: The Unassigned Assets table displays assets not assigned to employees.
|
Mass Transactions Page
The Mass Transactions page allows fixed assets accountants to easily find pending transactions and take required actions. You can view pending transaction metrics, charts, and results tables. The following is a display of the Mass Transactions page.
From the Assets Super User responsibility, navigate to the Mass Transactions page:
(N) Assets Information Discovery > Mass Transactions (tab)
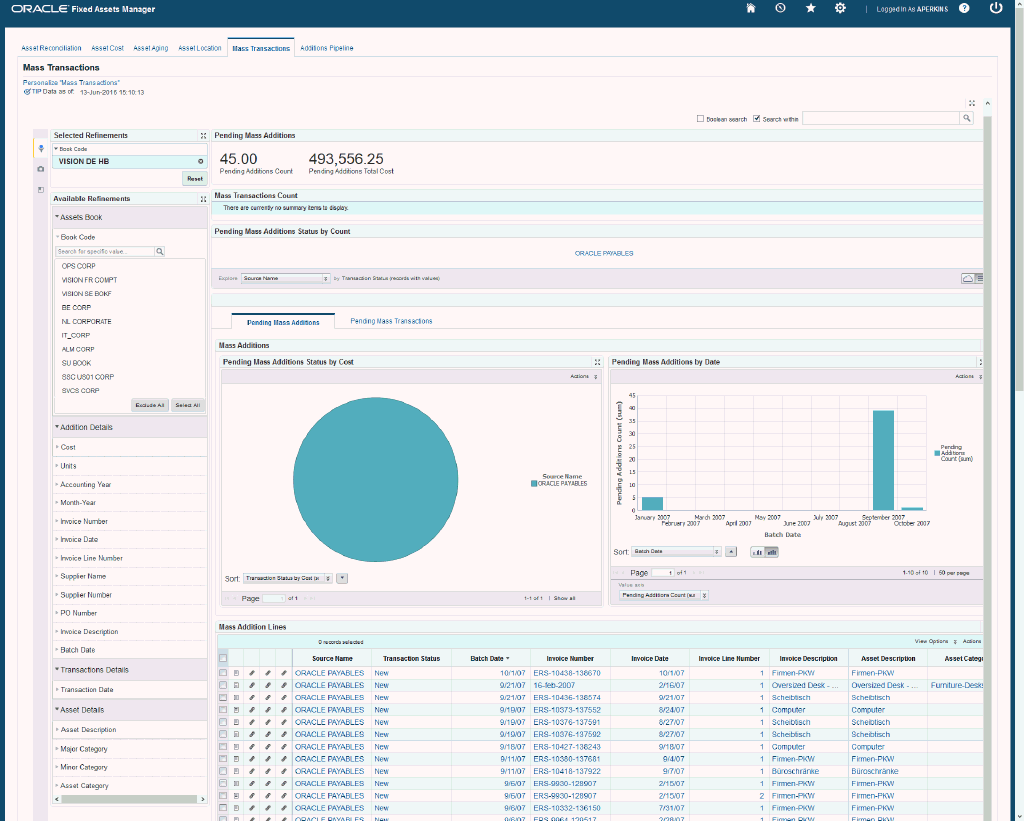
Within the Mass Transactions page, you can track pending transactions and take required actions. You can analyze data using asset metrics, charts, graphs, and tables. The following describes the Mass Transactions page regions and components:
| Region | Components |
|---|---|
Advanced Search
|
The Advanced Search component includes value search, record search, Boolean search, and partial search capabilities. You can submit keyword searches and the application provides type-ahead suggestions and displays attribute values that match the typed text. When you perform a search, the search term is added to the Selected Refinements component. As you type, you may be prompted to select a matching attribute value, or simply search for the entered text.
Additional Information: See the Advanced Search Capabilities appendix in this guide for details. |
| Bookmarks | The Bookmarks Component allows you to save a given navigation and component state so that you can return to it at a later time. |
| Selected Refinements | The Selected Refinements component displays all values that you have selected to filter the data, and allows you to quickly make adjustments to the current refinement by removing items from the list or clearing all filters. |
| Available Refinements | The Available Refinements component allows you to filter data based on the current available values or value ranges for selected attributes that are displayed within attribute groups. Expand the following attribute groups to view and select attribute names:
|
| Pending Mass Additions (summarization bar) | The Pending Mass Additions summary bar contains the following metrics:
|
| Mass Transactions Count (summarization bar) | The Mass Transactions Count summarization bar contains the following metrics:
|
| Pending Mass Additions Status by Count (tag cloud) | Pending Mass Additions Status by Count (tag cloud)
Note: The Pending Mass Additions Status by Count tag cloud component displays the top pending mass additions status by category. The categories display in relative sizes by frequency of occurrence. The tag cloud component is configured to display the following dimensions:
|
| Mass Additions (tabbed component container) Pending Mass Additions (tab) |
Pending Mass Additions Status by Cost (chart) The Pending Mass Additions Status by Cost chart displays the total sum of asset cost per each status type.
Pending Mass Additions by Date (chart) The Pending Mass Additions by Date chart displays both the number and total cost of the pending additions per mass additions batch date.
|
| Pending Mass Transactions Details (tabbed component container) Pending Mass Transactions (tab) |
Pending Transactions by Record Type (chart) The Pending Transactions by Record Type chart displays the number of pending transactions per record type.
Pending Mass Transaction by Type (chart) The Pending Mass Transaction by Type chart displays the number of pending transactions per each transaction type.
|
| Results Table component container | Mass Addition Lines (results table)
Note: The Mass Additions Lines results table display when you select the Pending Mass Additions tab.
Pending Transaction Details (results table) Note: The Mass Additions Lines results table display when you select the Pending Mass Transactions tab.
|
Additions Pipeline Page
The Additions Pipeline page identifies all pending transactions that exist in Payables and Projects that affect asset costs. The Additions Pipeline page provides:
-
Ledger details that include ledger name, operating unit, functional currency, and count of pending invoices and projects.
-
Total pending additions by account description.
-
Total amounts.
-
Additions pipeline details (invoices, projects).
You can view pending transaction metrics, charts, and results tables. The following is a display of the Additions Pipeline page.
From the Assets Super User responsibility, navigate to the Additions Pipeline page:
(N) Assets Information Discovery > Additions Pipeline (tab)
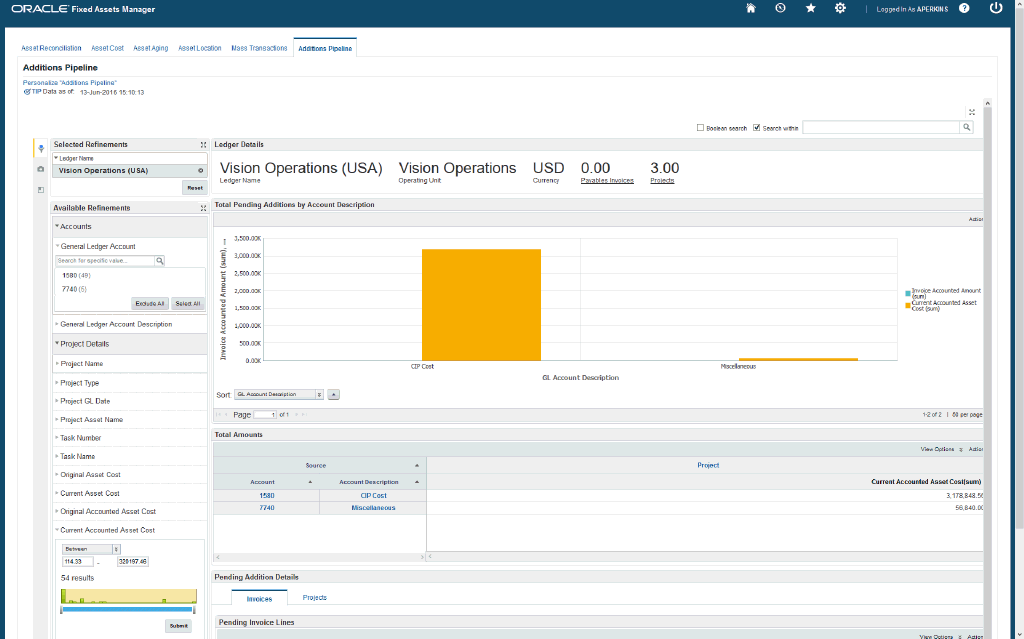
Within the Additions Pipeline page, the Fixed Assets manager can check the additions pipeline using metrics, graphs, and results tables. The following describes the Additions Pipeline page regions and components:
| Region | Components |
|---|---|
Advanced Search
|
The Advanced Search component includes value search, record search, Boolean search, and partial search capabilities. You can submit keyword searches and the application provides type-ahead suggestions and displays attribute values that match the typed text. When you perform a search, the search term is added to the Selected Refinements component. As you type, you may be prompted to select a matching attribute value, or simply search for the entered text.
Additional Information: See the Advanced Search Capabilities appendix in this guide for details. |
| Bookmarks | The Bookmarks Component allows you to save a given navigation and component state so that you can return to it at a later time. |
| Selected Refinements | The Selected Refinements component displays all values that you have selected to filter the data, and allows you to quickly make adjustments to the current refinement by removing items from the list or clearing all filters. |
| Available Refinements | The Available Refinements component allows you to filter data based on the current available values or value ranges for selected attributes that are displayed within attribute groups. Expand the following attribute groups to view and select attribute names:
|
| Ledger Details (summarization bar) | The Ledger Details summary bar contains the following metrics:
|
| Total Pending Additions by Account Description (component container) | Total Pending Additions by Account Description (chart) The Total Pending Additions by Account Description chart displays assets count by location segments.
|
| Total Amounts (component container) | Total Amounts (pivot table) The Total Amounts table displays the total additions pipeline. |
| Pending Addition Details (tabbed component container) Invoices (tab) |
Invoices (results table) The Invoices results table displays payable invoice details.
|
| Pending Addition Details (tabbed component container) Projects (tab) |
Pending Project Asset Lines (results table) The Pending Project Asset Lines table displays project asset lines details.
|
Oracle Fixed Assets Information Discovery Product Configuration
Setting Up Oracle Fixed Assets Information Discovery
The Oracle Fixed Assets Information Discovery product configuration setup must be completed after the installation and common configurations are completed as described in Installing Oracle E-Business Suite Information Discovery, Release 12.2 V8 (Doc ID: 2214431.1).
Setup and Configuration Steps
To set up Oracle Fixed Assets Information Discovery, you must complete the following steps:
-
Set Access Control by assigning UMX roles and updating access grants.
Access Control: Hide and Show EID Dashboards (User Interfaces) for Oracle Fixed Assets
As part of the Oracle E-Business Suite-EID integration for the Oracle Fixed Assets application, the following UMX Roles are provided:
| UMX Role | Internal Code Name |
|---|---|
| Fixed Assets Endeca Access Role | UMX|FA_ACCESS_ROLE |
| Fixed Assets Manager Endeca Access Role | UMX|FA_MGR_ACCESS_ROLE |
You must add the new UMX roles 'Fixed Assets Endeca Access Role' (Internal Code Name: UMX|FA_ACCESS_ROLE) and Fixed Assets Manager Endeca Access Role (Internal Code Name: UMX|FA_MGR_ACCESS_ROLE) to enable Endeca menu items for the Fixed Assets Manager responsibility, or any other custom responsibility which is using the same menu. When these UMX roles are assigned to the Fixed Assets Manager responsibility, the menu item Assets Information Discovery appears.
If you want to use the Endeca-related roles with more than one responsibility, then you must have an additional grant with a security context corresponding to each responsibility. You can add grants for a given role as a separate process while you are adding the role to the responsibility.
Fixed Assets includes separate Permissions and Grants for each page. The following are the Fixed Assets Permission Sets and Grants.
| Permission Sets | Internal Code Name |
|---|---|
| Fixed Assets Manager Endeca Permission Set | FA_ MGR_ENDECA_ACCESS_PS |
| Fixed Assets Endeca Permission Set | FA_ENDECA_ACCESS_PS |
| Grants | Internal Code Name |
|---|---|
| Fixed Assets Manager Endeca Access Grant | FA MGR Endeca Access Grant |
| Fixed Assets Endeca Access Grant | FA Endeca Access Grant |
For assigning UMX roles and grants, refer to Appendic C in Installing Oracle E-Business Suite Information Discovery, Release 12.2 V8 (Doc ID: 2214431.1).
Scheduling Setup for Full Endeca Upload or Refresh
The following data sets are included with the Oracle Fixed Assets application:
| Data Domain Name | Purpose |
|---|---|
| fa-asset | Stores all assets information regarding asset cost, locations, and aging. |
| fa-masstrans | Stores all pending mass transaction information. |
| fa-rec | Stores all account balances from SLA and GL. |
| fa-clr | Stores all additions pipeline information from Payables and Projects. |
The initial data upload for Endeca Fixed Assets is complete when the Full graph is run as described in the Installing Oracle E-Business Suite Information Discovery, Release 12.2 V8 (Doc ID: 2214431.1). Full refresh deletes all data from Endeca and repopulates it with a full data extract from the E-Business Suite system.
To schedule ETL on the Integrator Server
-
Login to Integrator server using your Clover login.
-
Click the Scheduling tab.
-
Select the New Schedule link.
-
Enter a Description for the scheduler.
-
Select Periodic as the Type.
-
Select by interval as the Periodicity.
-
Enter a start date and time in the Not active before date/time field.
-
Enter an end date and time in the Not active after date/time field.
-
Enter a value in the Interval (minutes) field.
-
Ensure you select the Fire misfired event as soon as possible check box.
-
Select Start a graph from the Task Type list.
-
Select the graph for schedule to run. I.e. FullLoadConfig.grf.
-
Click Create to set the scheduler.
ETL Parameters for Fixed Assets
You can load data to the Oracle Fixed Assets Data Domain by running graphs provided by Oracle Fixed Assets.
To load data to the Oracle Fixed Assets data domain
-
Using the URL for the EID Integrator Server, navigate to the Sandboxes page and expand the graph node under 'fa'.
-
Graph to load data includes:
-
FullLoadConfig.grf: This graph loads meta data and data from all views to the “fa” data domain on the Endeca server.
-
IncrementalLoadConfig.grf: This graph updates mass additions information and should be scheduled to run periodically depending on business requirements (monthly, weekly, or daily).
-
Profile Options for Fixed Assets
There are no profile options in Oracle Fixed Assets Information Discovery.
Views and Joins for Fixed Assets
The following views are used by the ETL layer in Endeca to load Oracle Fixed Assets data to the Endeca Data Domain:
| View Name | Purpose |
|---|---|
| FA_EID_F_ASSET_V | Loads assets data (aging, locations, and assignments) |
| FA_EID_F_MASS_TRANS_V | Loads pending mass transaction data |
| FA_EID_REC_V | Loads accounting data for asset accounts from SLA and GL |
| FA_EID_F_CLR | Loads additions pipeline data from payables and projects |
Menus for Endeca Fixed Assets
Oracle Fixed Assets integration includes the following new user menu function:
| User Function Name | Function Name |
|---|---|
| Assets Information Discovery | FA_ENDECA_MAIN |