Oracle Receivables Command Center
This chapter covers the following topics:
- Receivables Command Center Overview
- Outstanding Receivables Dashboard
- Billing Process Dashboard
- Payment Process Dashboard
- Cash Application Dashboard
- Payment History Dashboard
- Period Close Dashboard
- Receivables Reconciliation Dashboard
Receivables Command Center
Receivables Command Center Overview
Oracle Receivables Command Center enables receivables managers, analysts, and accounts receivable specialists to analyze and to act on receivables data from across their enterprise. Use the command center to review open receivables, billing, and payment transactions. Operational efficiency and insight is enhanced through key metrics, drillable graphs, and tag clouds so that you can quickly identify problem areas and outstanding items that require intervention.
Use the command center to:
-
Minimize customer account delinquency.
-
Compare current and delayed transactions against unapplied receipts.
-
Contact customer and expedite collection, and tailor collection strategy per customer.
-
-
Reduce Days Sales Outstanding (DSO).
-
Resolve billing process bottlenecks.
-
Reconcile payment exceptions and discrepancies.
-
-
Fit collection strategy per customer.
-
Analyze payment trends, overdue balances, adjustments, and credit memos.
-
Recognize potential problems early and minimize delays.
-
-
Manage period close process proactively.
-
Gain visibility into the accounting process.
-
Identify any potential bottlenecks early in the closing cycle.
-
Reduce adjustments by identifying missed and incorrect posted entries.
-
-
Manage the cash application process effectively.
-
Reduce the time and effort required to match transactions and apply receipts using a single interface.
-
Address discrepancies that can delay revenue recognition.
-
Minimize disputes and improve customer relationships by ensuring accurate application of payments.
-
Streamline your cash application process.
-
-
Accelerate the reconciliation process and reduce the reconciliation cycle time using the Receivables Reconciliation dashboard.
-
Gain insight into the integrated receivables subledger and general ledger data.
-
Perform comprehensive reconciliation analysis by comparing Receivables and General Ledger transactions data displayed side-by-side.
-
Track discrepancies between Receivables and General Ledger amounts.
-
Review unmatched records.
-
Identify potential causes of discrepancies such as missing journal entries, delayed transfers, or out-of-balance entries.
-
Review whether outstanding customer invoices and payments are accurately recorded and accounted.
-
-
Use reconciliation data to close financial activities on time.
-
Use the following dashboards in Receivables Command Center:
-
Outstanding Receivables: Use this dashboard to get insight into outstanding receivables, specific transactions, and potentially challenging customers that require attention. See Outstanding Receivables Dashboard.
-
Billing Process: Use this dashboard to review outstanding issues such as incomplete transactions, adjustments pending approval, and auto-invoice import processing errors. See Billing Process Dashboard.
-
Payment Process: Use this dashboard to identify payment related transactions such as unapplied and on account receipts, receipt and remittance batches requiring attention, and lockbox errors. See Payment Process Dashboard.
-
Cash Application: Use this dashboard to monitor and match unapplied cash receipts with outstanding invoices. You can process unapplied cash by applying all or part of a receipt to a single transaction or multiple transactions (one-to-one or one-to-many matching). See Cash Application Dashboard.
-
Payment History: Use this dashboard to review recent historical information about both paid transactions and applied receipts across customers. See Payment History Dashboard.
-
Period Close: Use this dashboard to get insight into all transactions that affect the closing process for accounting periods and speed up the period close and reconciliation process. See Period Close Dashboard.
-
Receivables Reconciliation: Use this dashboard to monitor the reconciliation process and its status. You can identify mismatches between the Receivables subledger and General Ledger balances and review specific transactions, receipts, or adjustments for discrepancy analysis. See Receivables Reconciliation Dashboard.
Note: The Oracle Receivables Command Center configuration and setup must be completed before the installation and common configurations are completed as described in My Oracle Support Knowledge Document 2495053.1, Installing Oracle Enterprise Command Center Framework. For additional ECC overview information, see Overview of Enterprise Command Centers, Oracle E-Business Suite User's Guide.
Searching Enterprise Command Center Dashboards
Use the dashboard sidebars to refine (filter) the data on each dashboard. You can select a value or record from the Available Refinements component, or use Search to find a keyword, a value, or a specific record. The type-ahead feature suggests matches for your entry that correspond to the available refinements. When you submit a search, the search term is added to the Selected Refinements list, and the dashboard data is refined to include only records that match the search. You can add multiple refinements and remove any of them at any time. Use Saved Search to create and save your search. You can edit, delete, or refer to this saved search. You can also use data sets to further refine your search.
Use an asterisk (*) or percent sign (%) to perform a partial keyword or record search that matches any string of zero or more characters. You can also use a question mark (?) to perform a partial search that matches any single character.
Additional Information: For more information about searching for and refining data in enterprise command centers, see Search in Highlights of an Enterprise Command Center, Oracle E-Business Suite User's Guide.
Outstanding Receivables Dashboard
See Receivables Command Center Overview.
The Outstanding Receivables dashboard offers insight into outstanding receivables and customers requiring attention. It provides an overview of open receivables transactions and associated key metrics.
Use the dashboard to:
-
Monitor the health of outstanding receivables to ensure prompt follow-up on payment commitments.
-
Assess the aging distribution of current and past-due transactions.
-
Identify the transactions that are problematic.
-
Negotiate on past-due invoices.
-
Preview customer invoices to expedite collection.
Select and initiate payments for transactions as a group.
From the Receivables Manager responsibility, navigate to the Outstanding Receivables dashboard:
(N) Receivables Manager > Receivables Command Center
First select a ledger to display relevant data based on the selected filter, then you can search for operating unit, customer, open receivables transactions, and associated key metrics.
Outstanding Receivables Dashboard
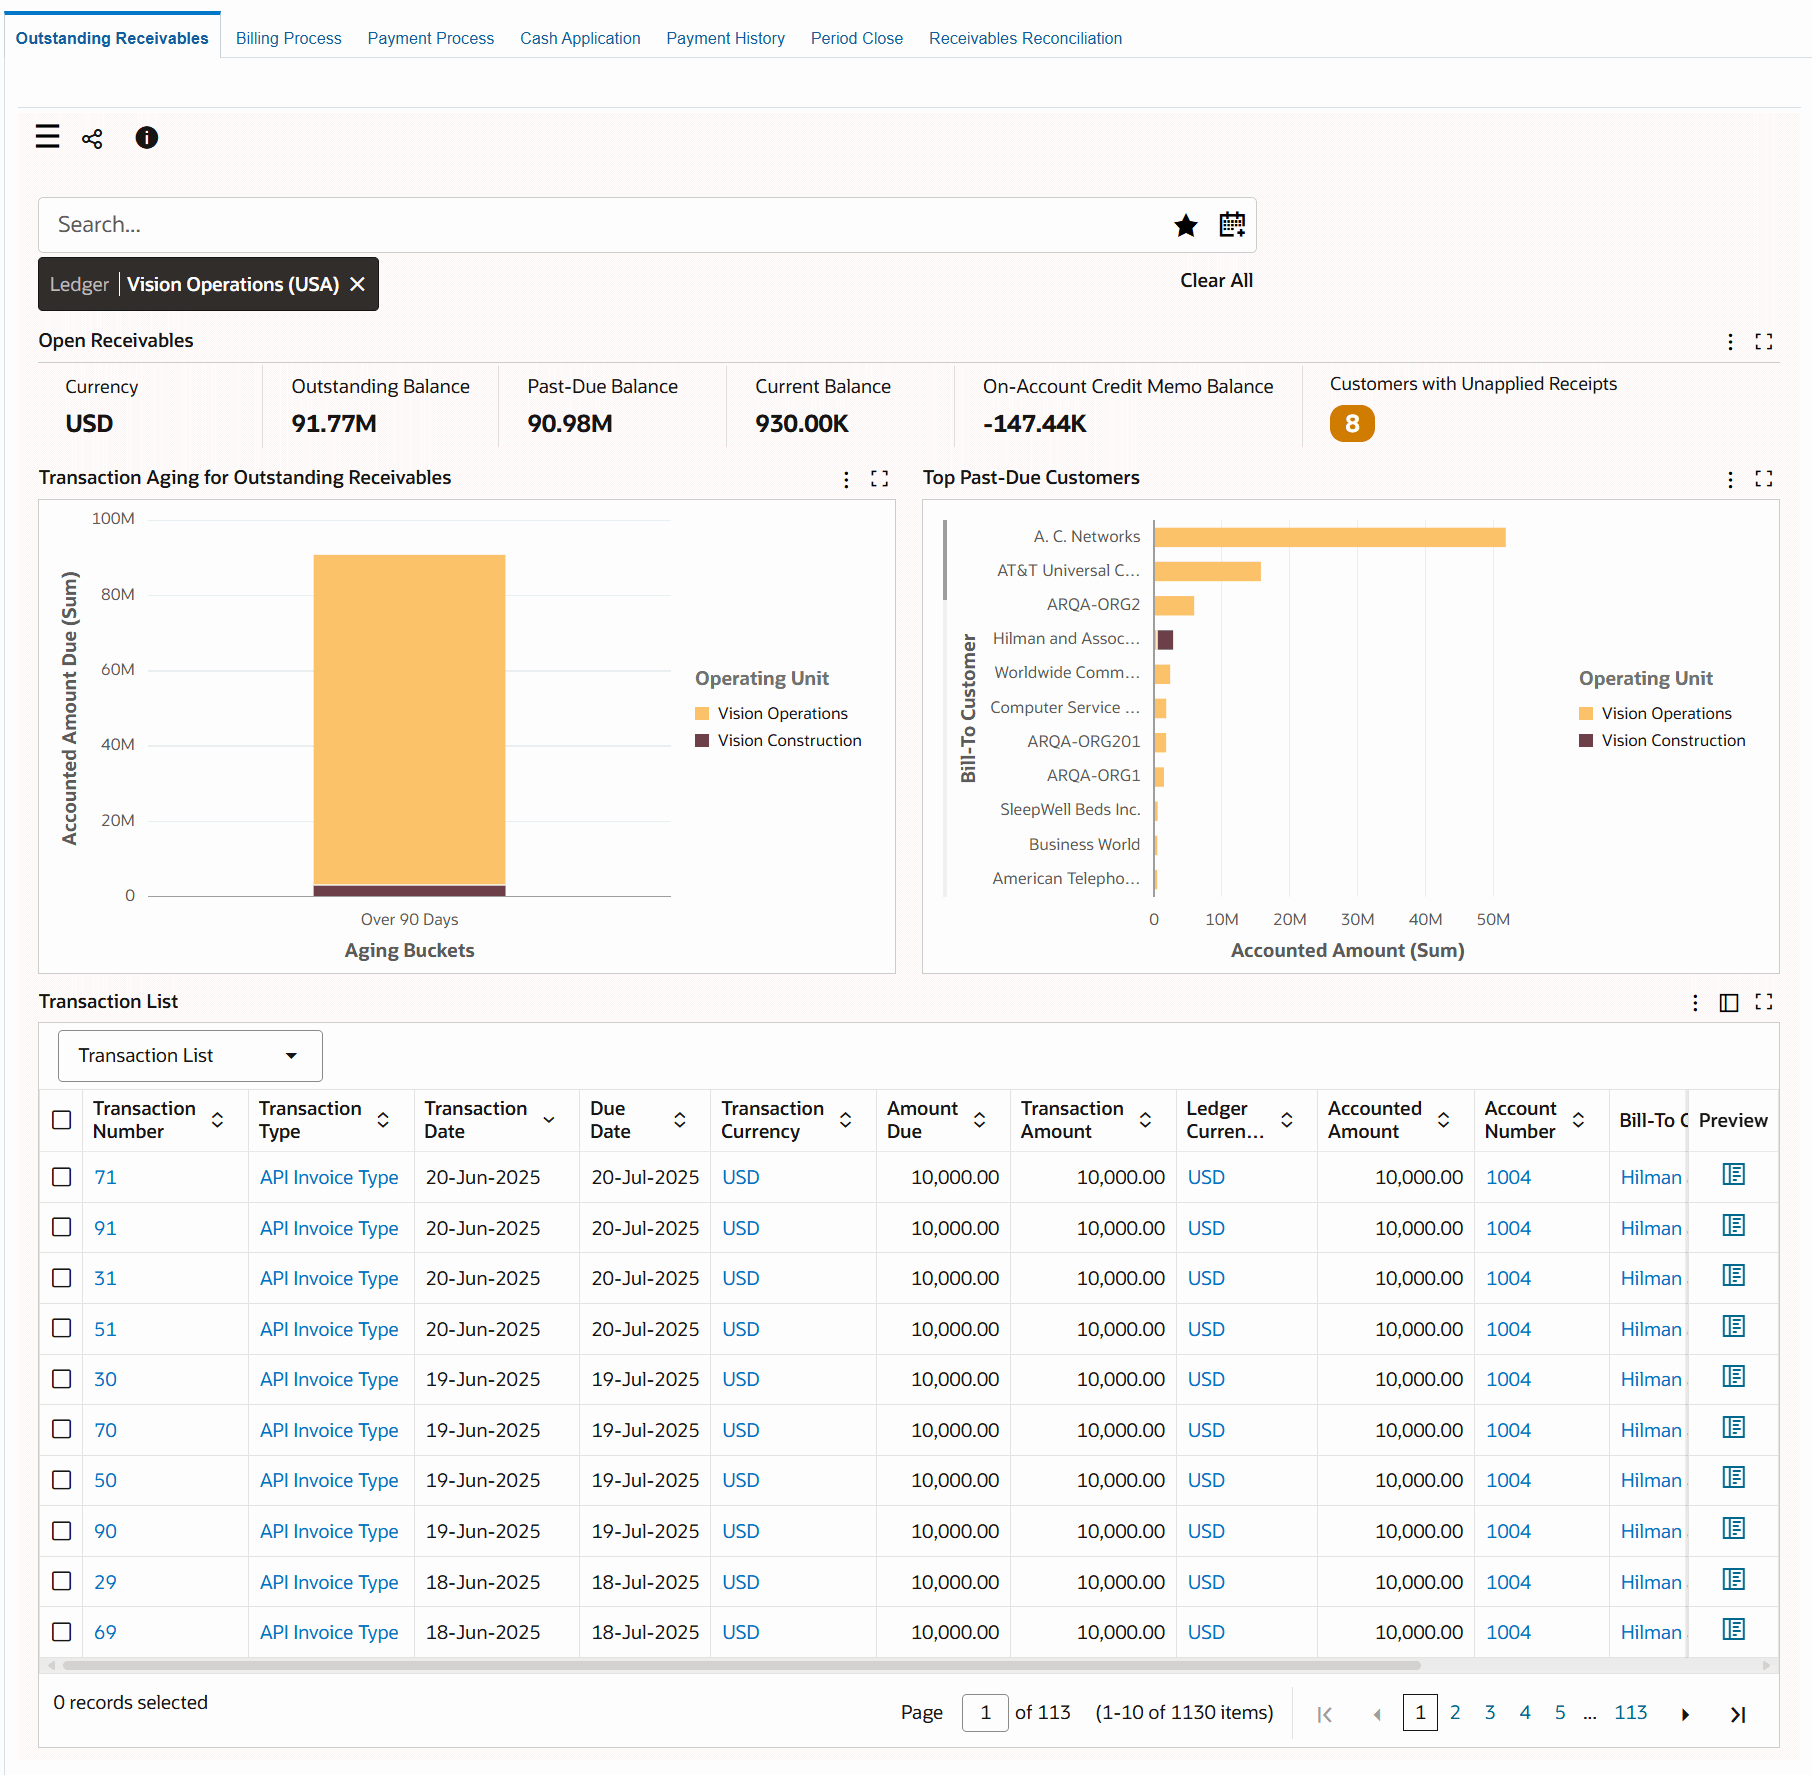
The following table describes the dashboard:
| Component | Description |
|---|---|
| Ledger (filter chip) | The Ledger filter displays the ledger that you can access. The outstanding receivables data is displayed in the context of a ledger. If you have access to multiple ledgers, then first select a ledger to display relevant data based on the selected filter. The Ledger list displays the ledgers that you can access with the total number of transactions for each ledger. |
| Open Receivables (summary bar) | The summary bar displays key metrics to summarize open receivable transactions for the selected ledger in the following fields:
|
| Open Receivables (charts) |
|
| Transaction List (results table) | This table contains detailed information about open receivables transactions. You can perform the following row-level actions:
|
| Options (table-level actions) | Export: Use this action to export the search results in a comma-separated values (CSV) file format. |
Billing Process Dashboard
See Receivables Command Center Overview.
The Billing Process dashboard highlights outstanding issues in billing such as incomplete transactions, adjustments that are waiting for approval, and auto-invoice import processing errors.
Use the dashboard to:
-
Resolve billing process bottlenecks.
-
Take corrective actions such as complete transactions and approve adjustments that are pending.
-
Resolve import errors.
From the Receivables Manager responsibility, navigate to the Billing Process dashboard:
(N) Receivables Manager > Receivables Command Center
Billing Process Dashboard
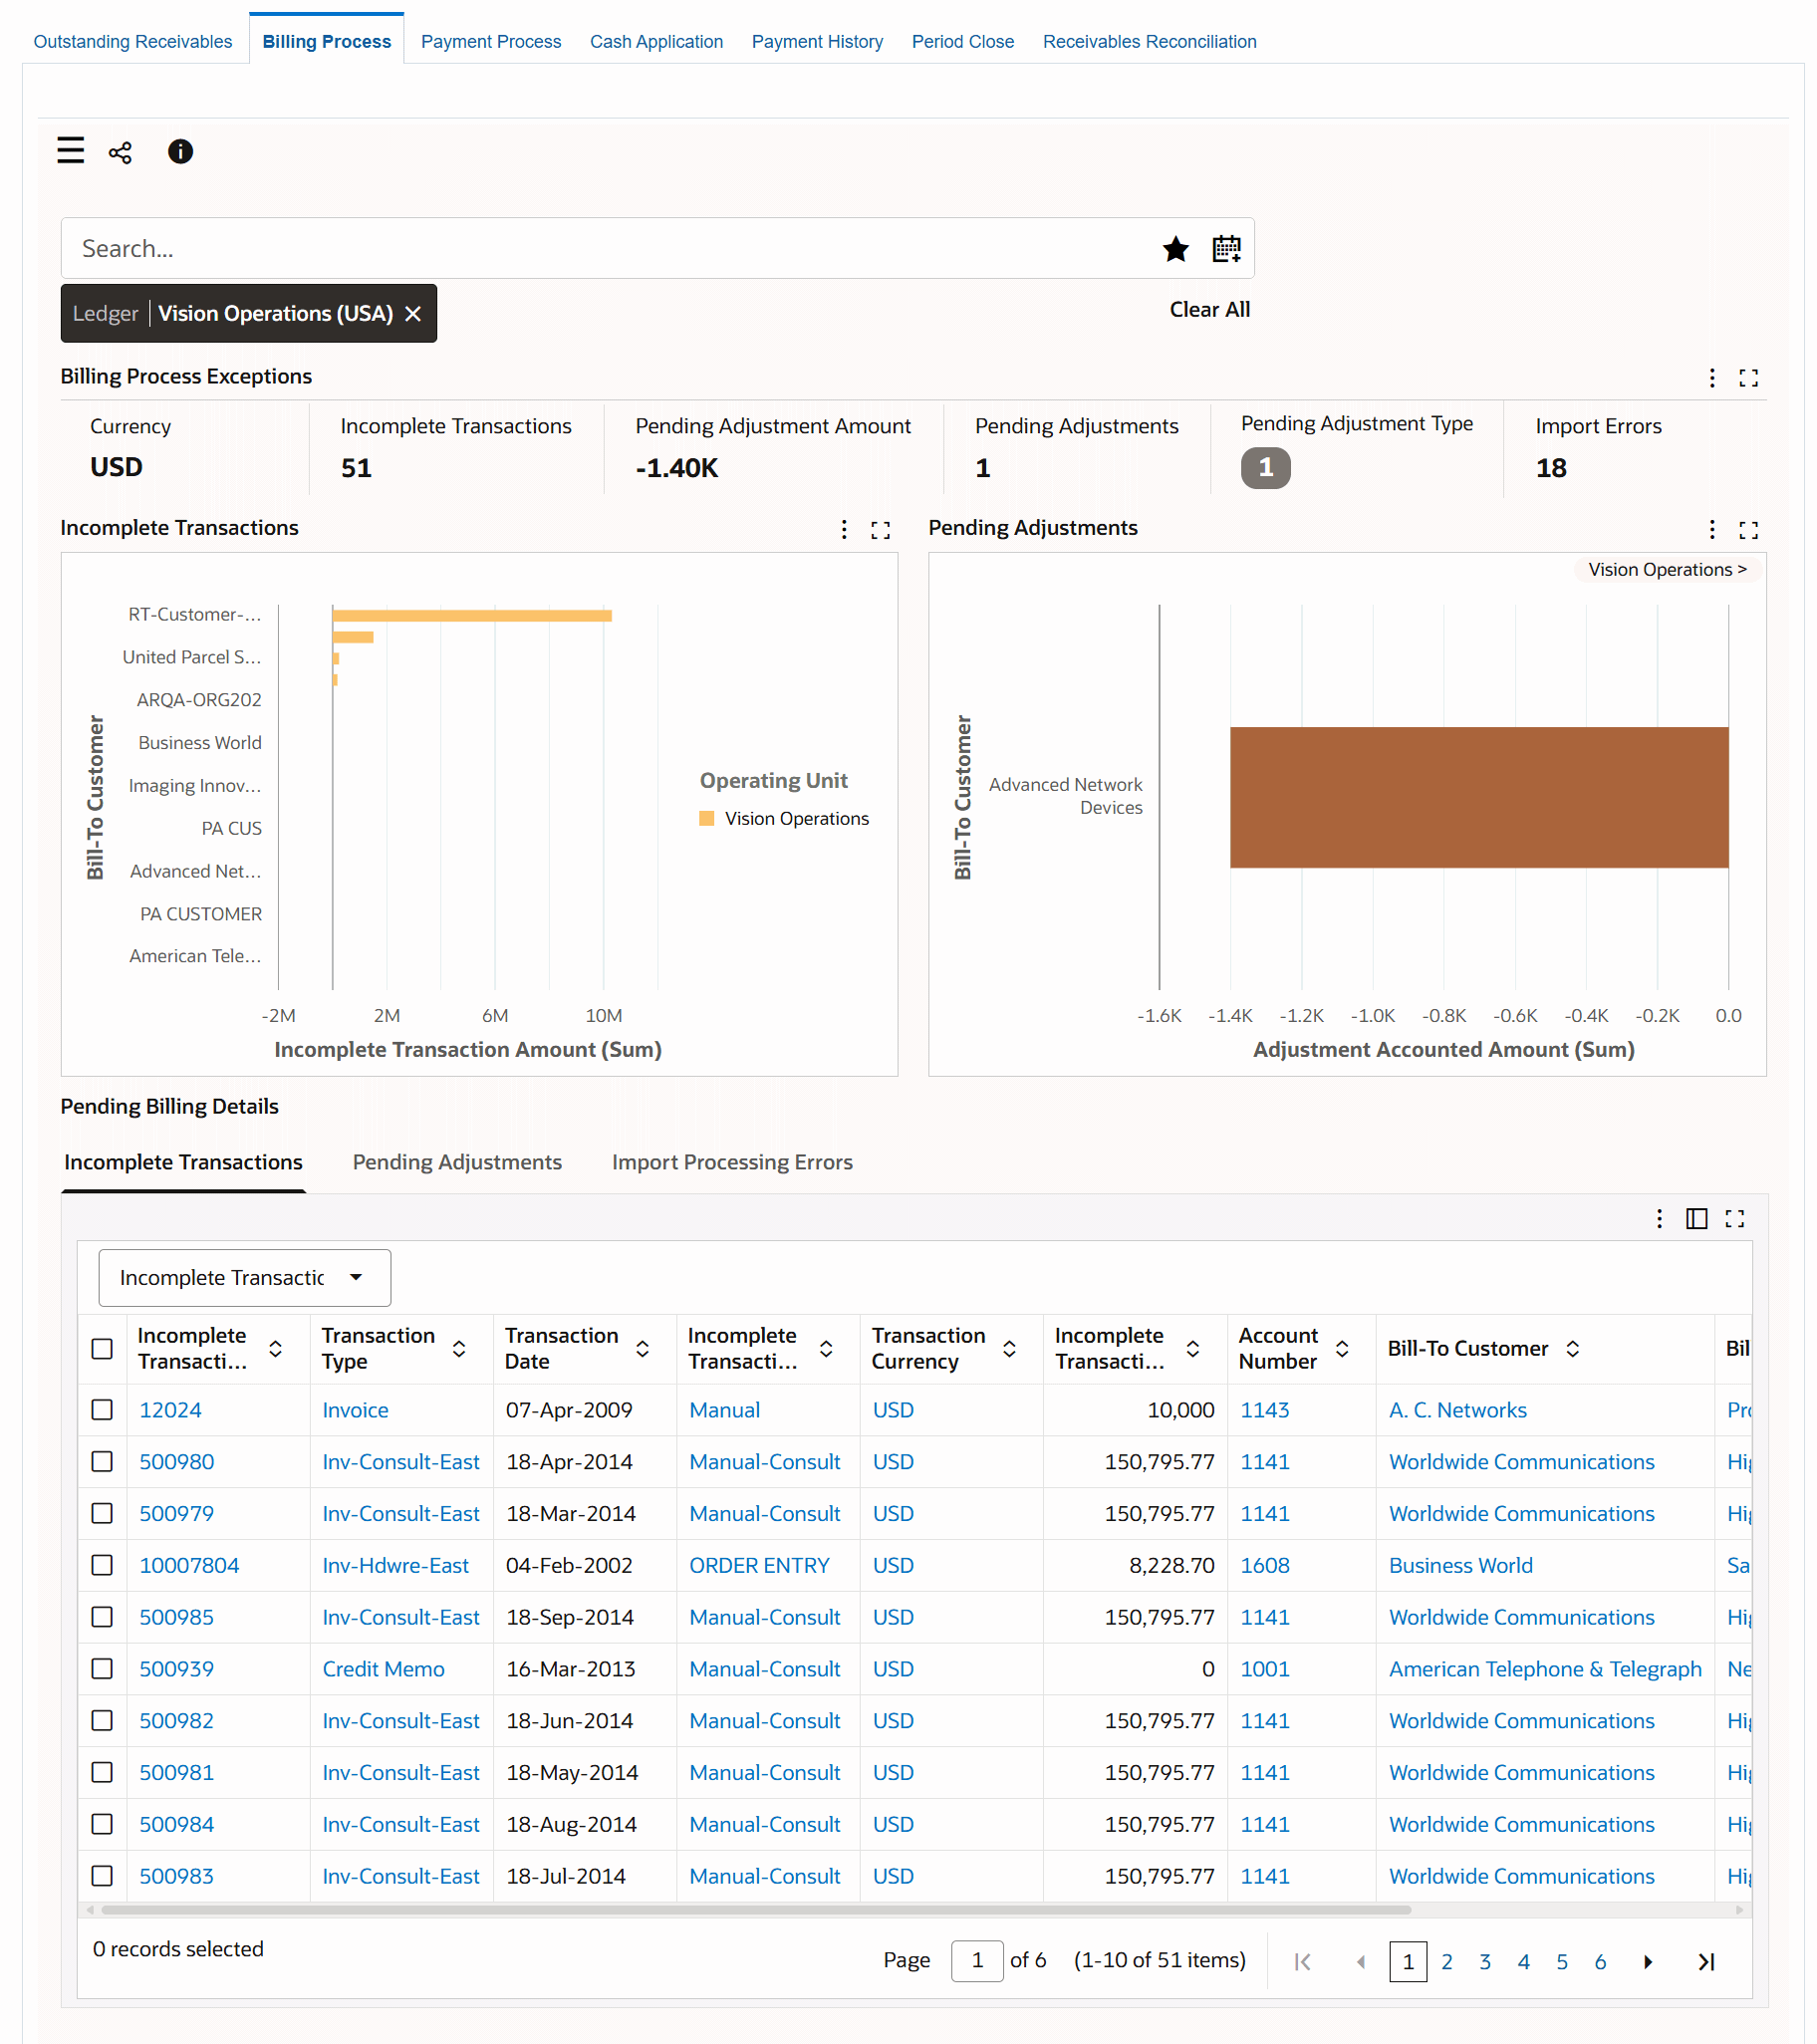
The following table describes the dashboard:
| Component | Description |
|---|---|
| Ledger (filter chip) | The Ledger filter displays the ledger that you can access. The billing process data is displayed in the context of a ledger. If you have access to multiple ledgers, then first select a ledger to display relevant data based on the selected filter. |
| Billing Process Exceptions (summary bar) | The summary bar displays the following key metrics about the billing process for open receivables transactions for the selected ledger.
|
| Billing Process (charts) |
|
| Pending Billing Details (results tables) | This component contains the following tables, each of which presents detailed information about portions of the billing process. You can also perform row-level actions from these tables
|
| Options (table-level actions) | Export: Use this action to export the search results in a comma-separated values (CSV) file format. |
Payment Process Dashboard
See Receivables Command Center Overview.
The Payment Process dashboard identifies payment related exceptions such as unapplied and on account receipts, receipt and remittance batches that require attention, and lockbox errors.
From the Receivables Manager responsibility, navigate to the Payment Process dashboard:
(N) Receivables Manager > Receivables Command Center
Payment Process Dashboard
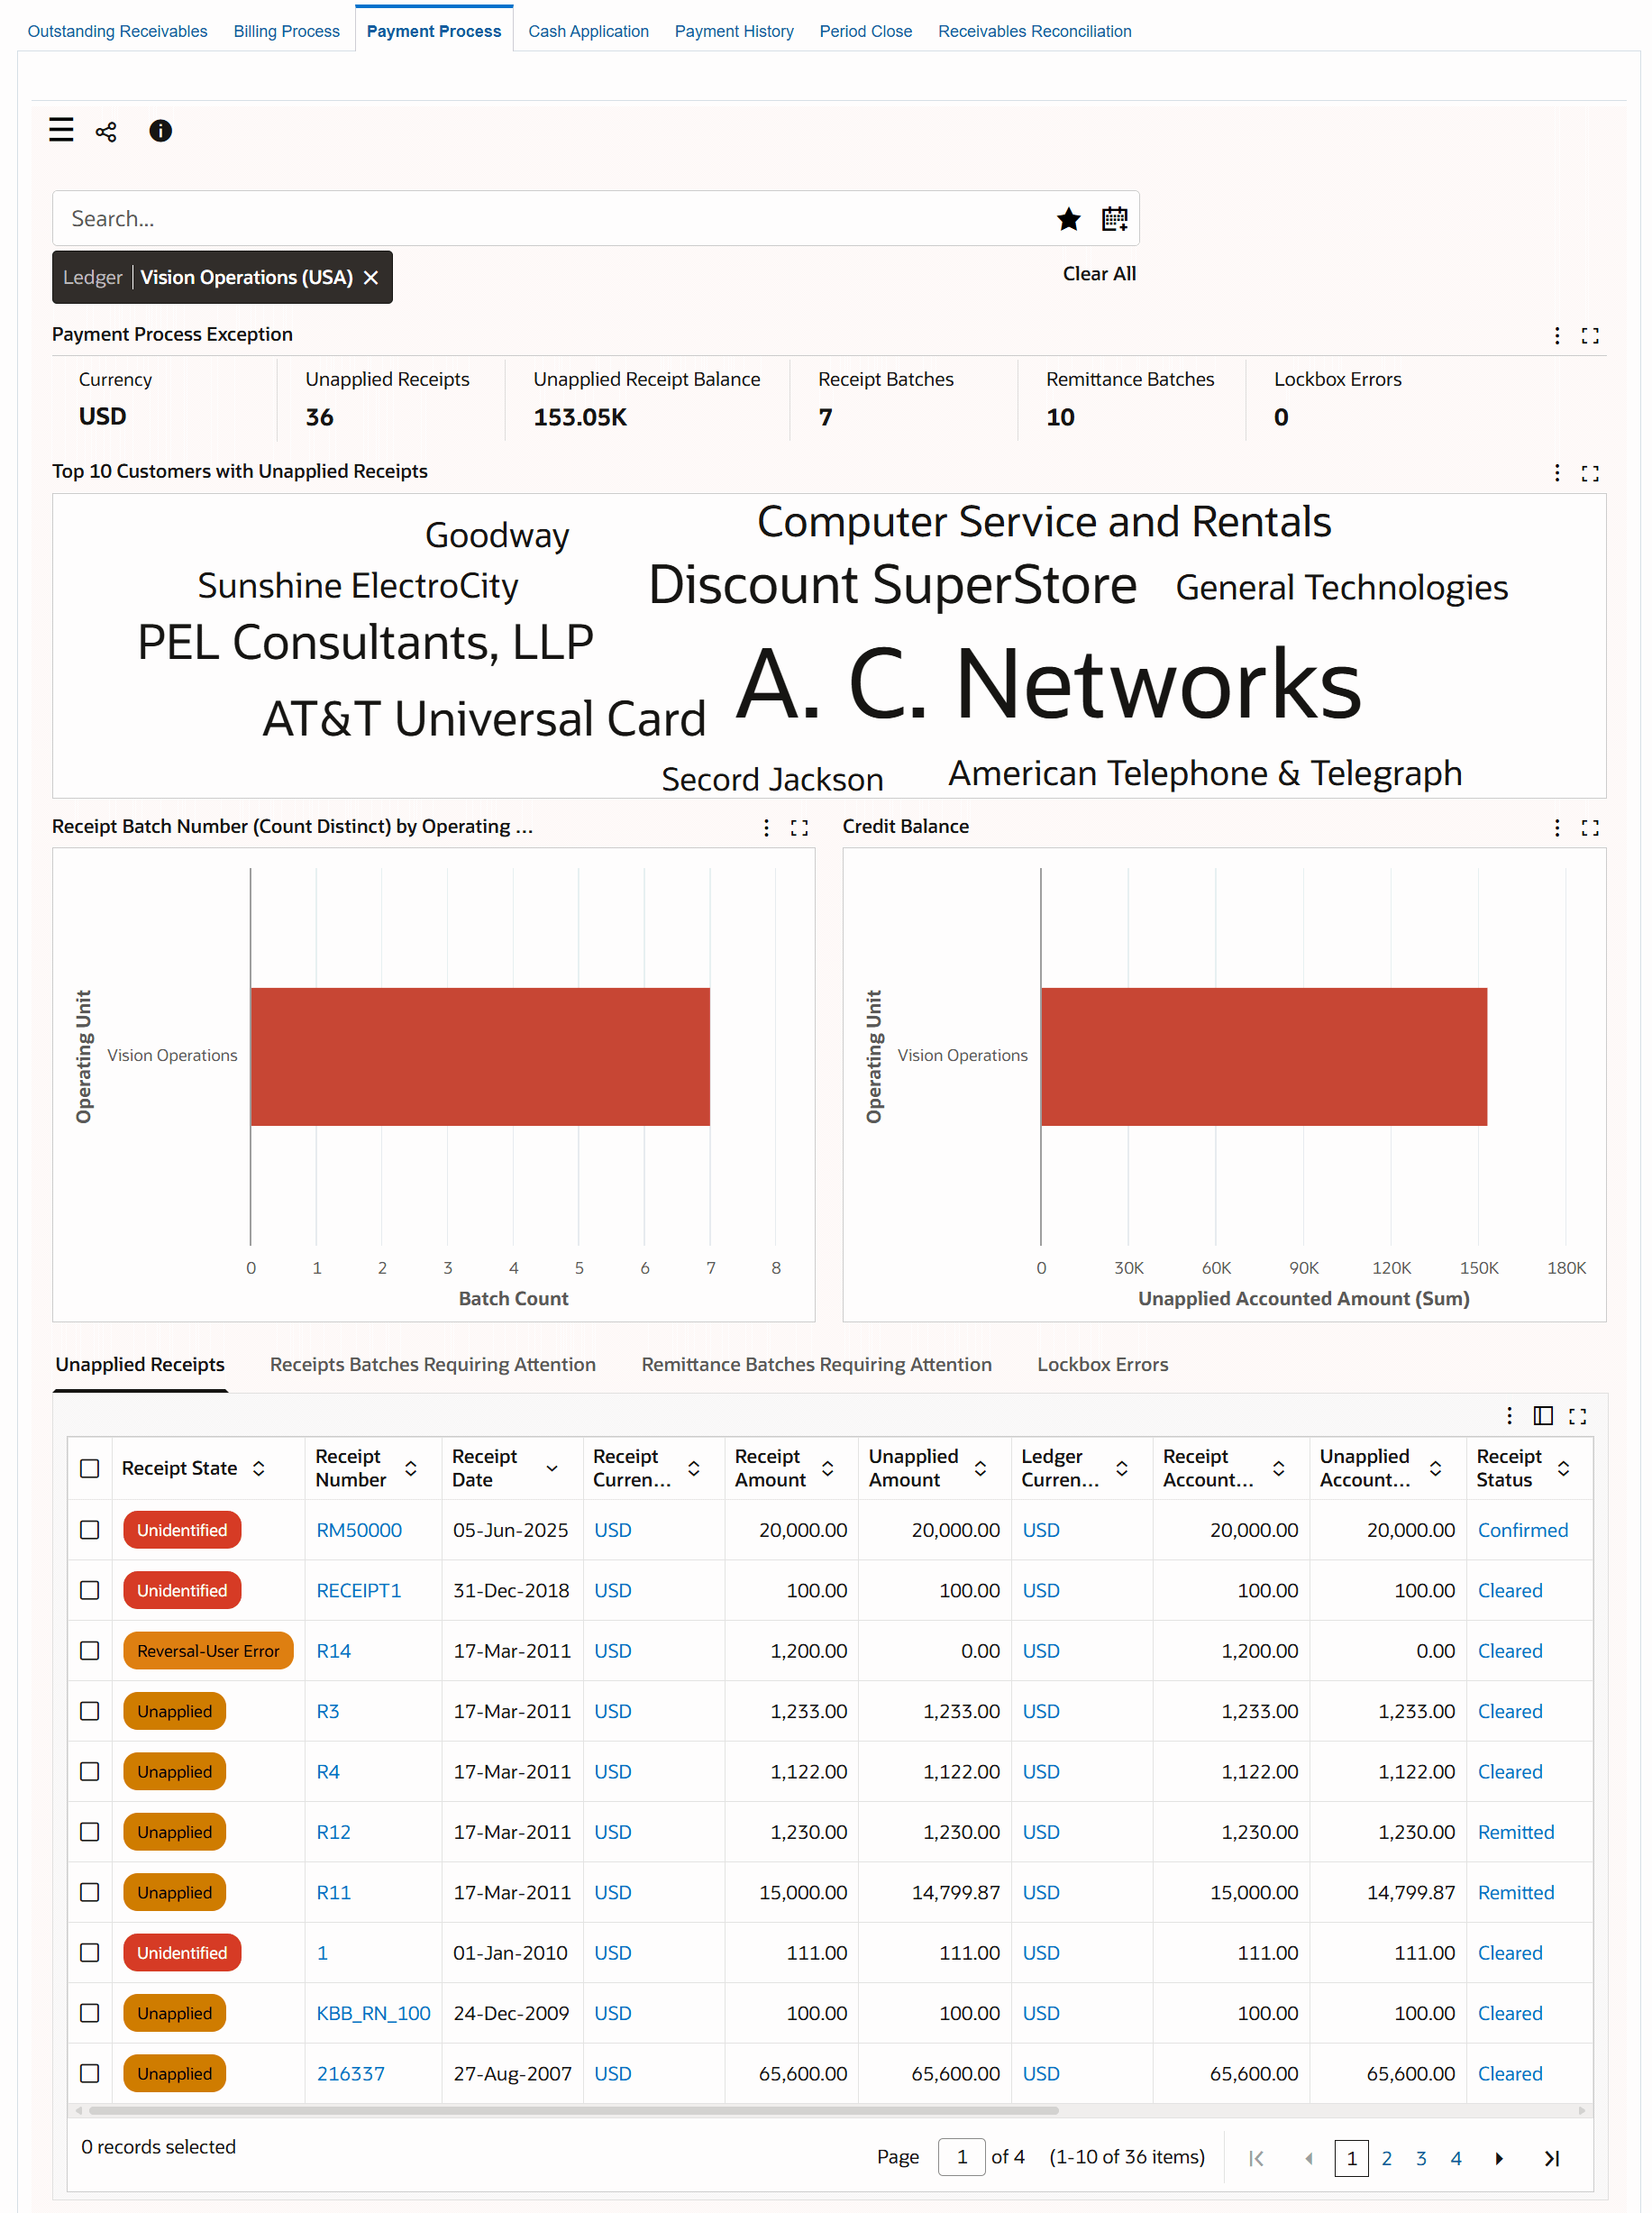
The following table describes the dashboard:
| Component | Description |
|---|---|
| Ledger (filter chip) | The Ledger filter displays the ledger that you can access. The payment process data is displayed in the context of a ledger. If you have access to multiple ledgers, then first select a ledger to display relevant data based on the selected filter. The Ledger list displays the ledgers that you can access with the total number of receipts for each ledger. |
| Payment Process (summary bar) | The summary bar shows metrics that indicate payment related transaction problems.
|
| Top 10 Customers with Unapplied Receipts (tag cloud) | This tag cloud displays the ten customers with the highest number of receipts that have not been applied to transactions or placed on account. |
| Receipt Batch Number (Count District) By Operating Unit (chart) | This chart shows the receipts batch count by operating unit. You can view the batch count by receipt batch process status. |
| Credit Balance (chart) | This chart shows the sum of unapplied amounts by operating unit and customer. |
| Unapplied Receipts (results table) | This table shows details for unapplied receipts including receipt number, unapplied amount, and receipt amount. To apply a receipt to the corresponding invoice, click the link in the Receipt Number column to open the Receipts window. |
| Receipts Batches Requiring Attention (results table) | To act on a receipt batch, click the link in the Receipt Batch Number column to open the Receipt Batches window. |
| Remittances Batch Requiring Attention (results table) | To act on a remittance batch, click the link in the Remittance Batch Number column to open the Remittances window. |
| Lockbox Errors (results table) | To edit transmission data, click the link in the Transmission Name column to open the Lockbox Transmission Data window. |
| Options (table-level actions) | Export: Use this action to export the search results in a comma-separated values (CSV) file format. |
Cash Application Dashboard
See Receivables Command Center Overview.
The Cash Application dashboard offers comprehensive insight into cash receipts and outstanding transactions of customers that require attention.
Use the dashboard to:
-
Gain insight into the cash payments of customers.
-
Use filters to focus on specific customers.
-
Focus on key customers with high open balances and those who require immediate attention.
-
-
Review critical cash application metrics.
-
View the total number of unapplied receipts and amount.
-
View the total number of open transactions and amount.
-
-
Prioritize aged receipts to avoid delays in applying payments and recognize revenue.
-
Identify unmatched and unapplied transactions quickly.
-
Drill down to the receipt details for review.
-
-
Resolve unmatched transactions by applying cash receipts to outstanding transactions.
-
Apply incoming payments to the correct customer accounts and receivable invoices using the Find Matches feature.
-
Apply all or part of a receipt to a single item or several debit items (one-to-one or one-to-many).
-
Apply receipts to invoices, debit memos, or deposits.
-
Apply a receipt in one currency to one or more transactions in different currencies (cross-currency receipt).
-
-
From the Receivables Manager responsibility, navigate to the Cash Application dashboard:
(N) Receivables Manager > Receivables Command Center
Cash Application Dashboard
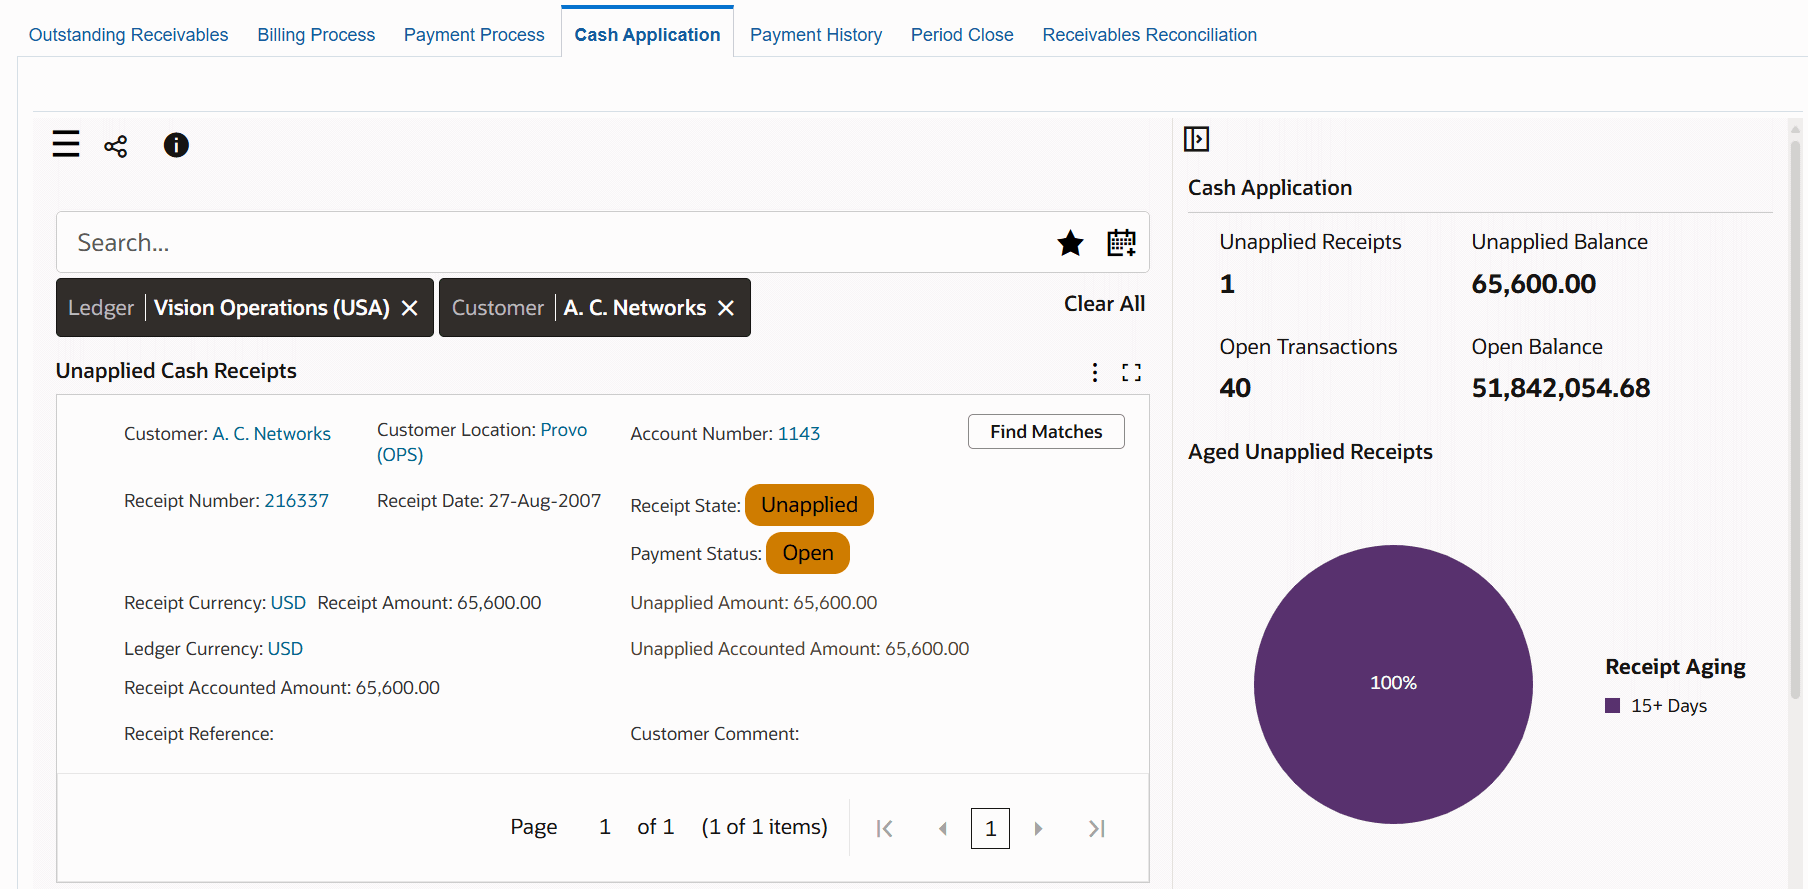
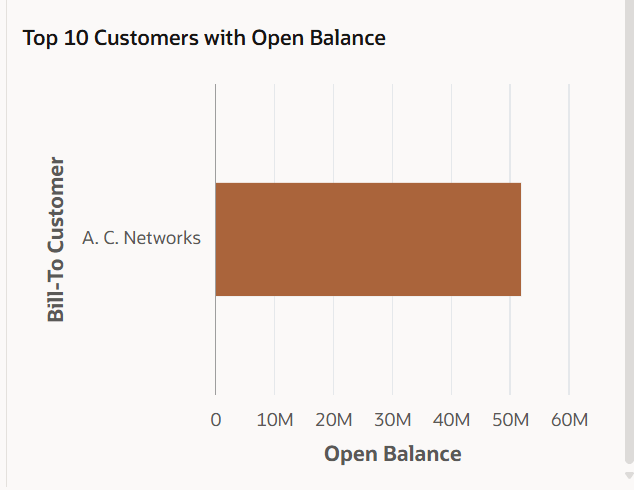
Top 10 Customers with Open Balance Chart
The following table describes the dashboard.
| Component | Description |
|---|---|
| Data Sets | The dashboard uses the following data sets to display data:
Click the Information icon to view the last successful run of the data load with the time stamp. |
| Ledger (filter chip) | The Ledger filter displays the ledger that you can access. If you have access to multiple ledgers, then first select a ledger to display relevant data based on the selected filter. To filter and review cash receipts data:
|
| Cash Application (summary bar) | You can view the following key cash application metrics:
|
| Aged Unapplied Receipts (pie chart) | The pie chart shows the total unapplied accounted amount by receipt aging. This chart provides information about the delayed receipts or receipts that are added to system but are not applied. You gain visibility into the aging of the receipts and can prioritize receipts based on aging, focusing efforts on older or critical transactions. The chart uses the following predefined receipt aging buckets:
You can view information of the filtered receipts in the Unapplied Cash Receipts grid. |
| Top 10 Customers with Open Balance (chart) | This bar chart shows the ten customers with the highest total accounted amount due and customer name. This data is retrieved from the Outstanding Receivables Dashboard. Use this information to focus on high-value customers that require attention for payment collection. Click a customer bar graph to view details of the unapplied cash receipts for that customer in the Unapplied Cash Receipts grid. |
| Unapplied Cash Receipts (results grid) | Based on the refinements or filter that you select, this grid displays a list of unapplied cash receipts with the following key information:
Reviewing cash receipts:
The grid includes a Find Matches button for each unapplied and applied cash receipt with the Open payment status to locate potential matches for the unapplied cash. See Using the Find Matches Feature. |
| Options (table-level actions) | Export: Use this action to export the search results in a comma-separated values (CSV) file format. |
Using the Find Matches Feature
When you click the Find Matches button for an applied or unapplied cash receipt with the Open payment status, the Cash Application drawer appears.
Components of the Cash Application Drawer
You can view customer information for the selected record such as account number, receipt number, receipt date, receipt currency, ledger currency, receipt amount, receipt accounted amount, unapplied amount, and unapplied accounted amount.
The Outstanding Transaction table lists all open transactions that are available for application to the selected receipt. This table shows the transaction class, transaction number, transaction date, transaction currency, due date, amount due, ledger currency, accounted amount due, and installment (which shows the number of installments as an invoice may have more than one installment). Oldest invoices are listed first. Note that this table lists only the transaction classes of Invoice, Debit Memo, and Deposit.
To apply a cash receipt:
-
Review the open transactions.
-
To search for the invoice with the matching amount, click the filter in the Accounted Amount Due column.
-
Click the Range icon to specify the Min and Max amount.
-
Enter the minimum and maximum amounts and click Select Filter. The table lists the outstanding transactions that match the filter.
-
Select the unapplied receipt and outstanding transaction. If you select more than one transaction, then you can verify the total amount using the footer summary.
-
Click Apply. The Cash Application page appears with Receipt and Applications regions.
-
Review the details and click Submit. A confirmation message appears that the application has been applied correctly.
-
The cash application is refreshed immediately. The unapplied cash receipt that you processed no longer appears on the dashboard.
Applying Cross-Currency Receipts
You can apply receipts that are in one currency to one or more transactions in different currencies. For example, you can apply a USD receipt to one invoice denominated in British pounds (GBP) and another in Canadian dollars (CAD). You can apply receipts to invoices, debit memos, and deposits.
To apply a cash receipt:
-
In Available Refinements, click Pending Receipt.
-
Click Receipt Currency.
-
Select Receipt Currency refinement.
-
To focus on a specific currency receipt, click the Exclude filter for other currencies. The Unapplied Cash Receipts grid displays receipts with the selected currency.
-
Click Find Matches. The Cash Application drawer appears with the list of outstanding transactions.
-
Review the unapplied amount and the unapplied accounted amount.
-
Select the transaction or transactions to which you want to apply this receipt.
-
Click Apply. On the Cash Application page, the rate type and the rate information is automatically displayed along with the functional amount.
-
In the Applied Amount field, the dashboard automatically displays the appropriate amount, which you can edit.
-
In the Allocated Applied Amount field, manually enter the required amount. When you tab out, the cross currency rate and exchange gain/loss for this application is automatically calculated.
-
Click Submit to apply invoice to the receipt. You can view the latest changes on the dashboard.
Payment History Dashboard
See Receivables Command Center Overview.
The Payment History dashboard provides an overview of paid transactions and payments, and associated key metrics. Use the dashboard to get insight into recent historical payment patterns across customers and operating units.
From the Receivables Manager responsibility, navigate to the Payment History dashboard:
(N) Receivables Manager > Receivables Command Center
Payment History Dashboard
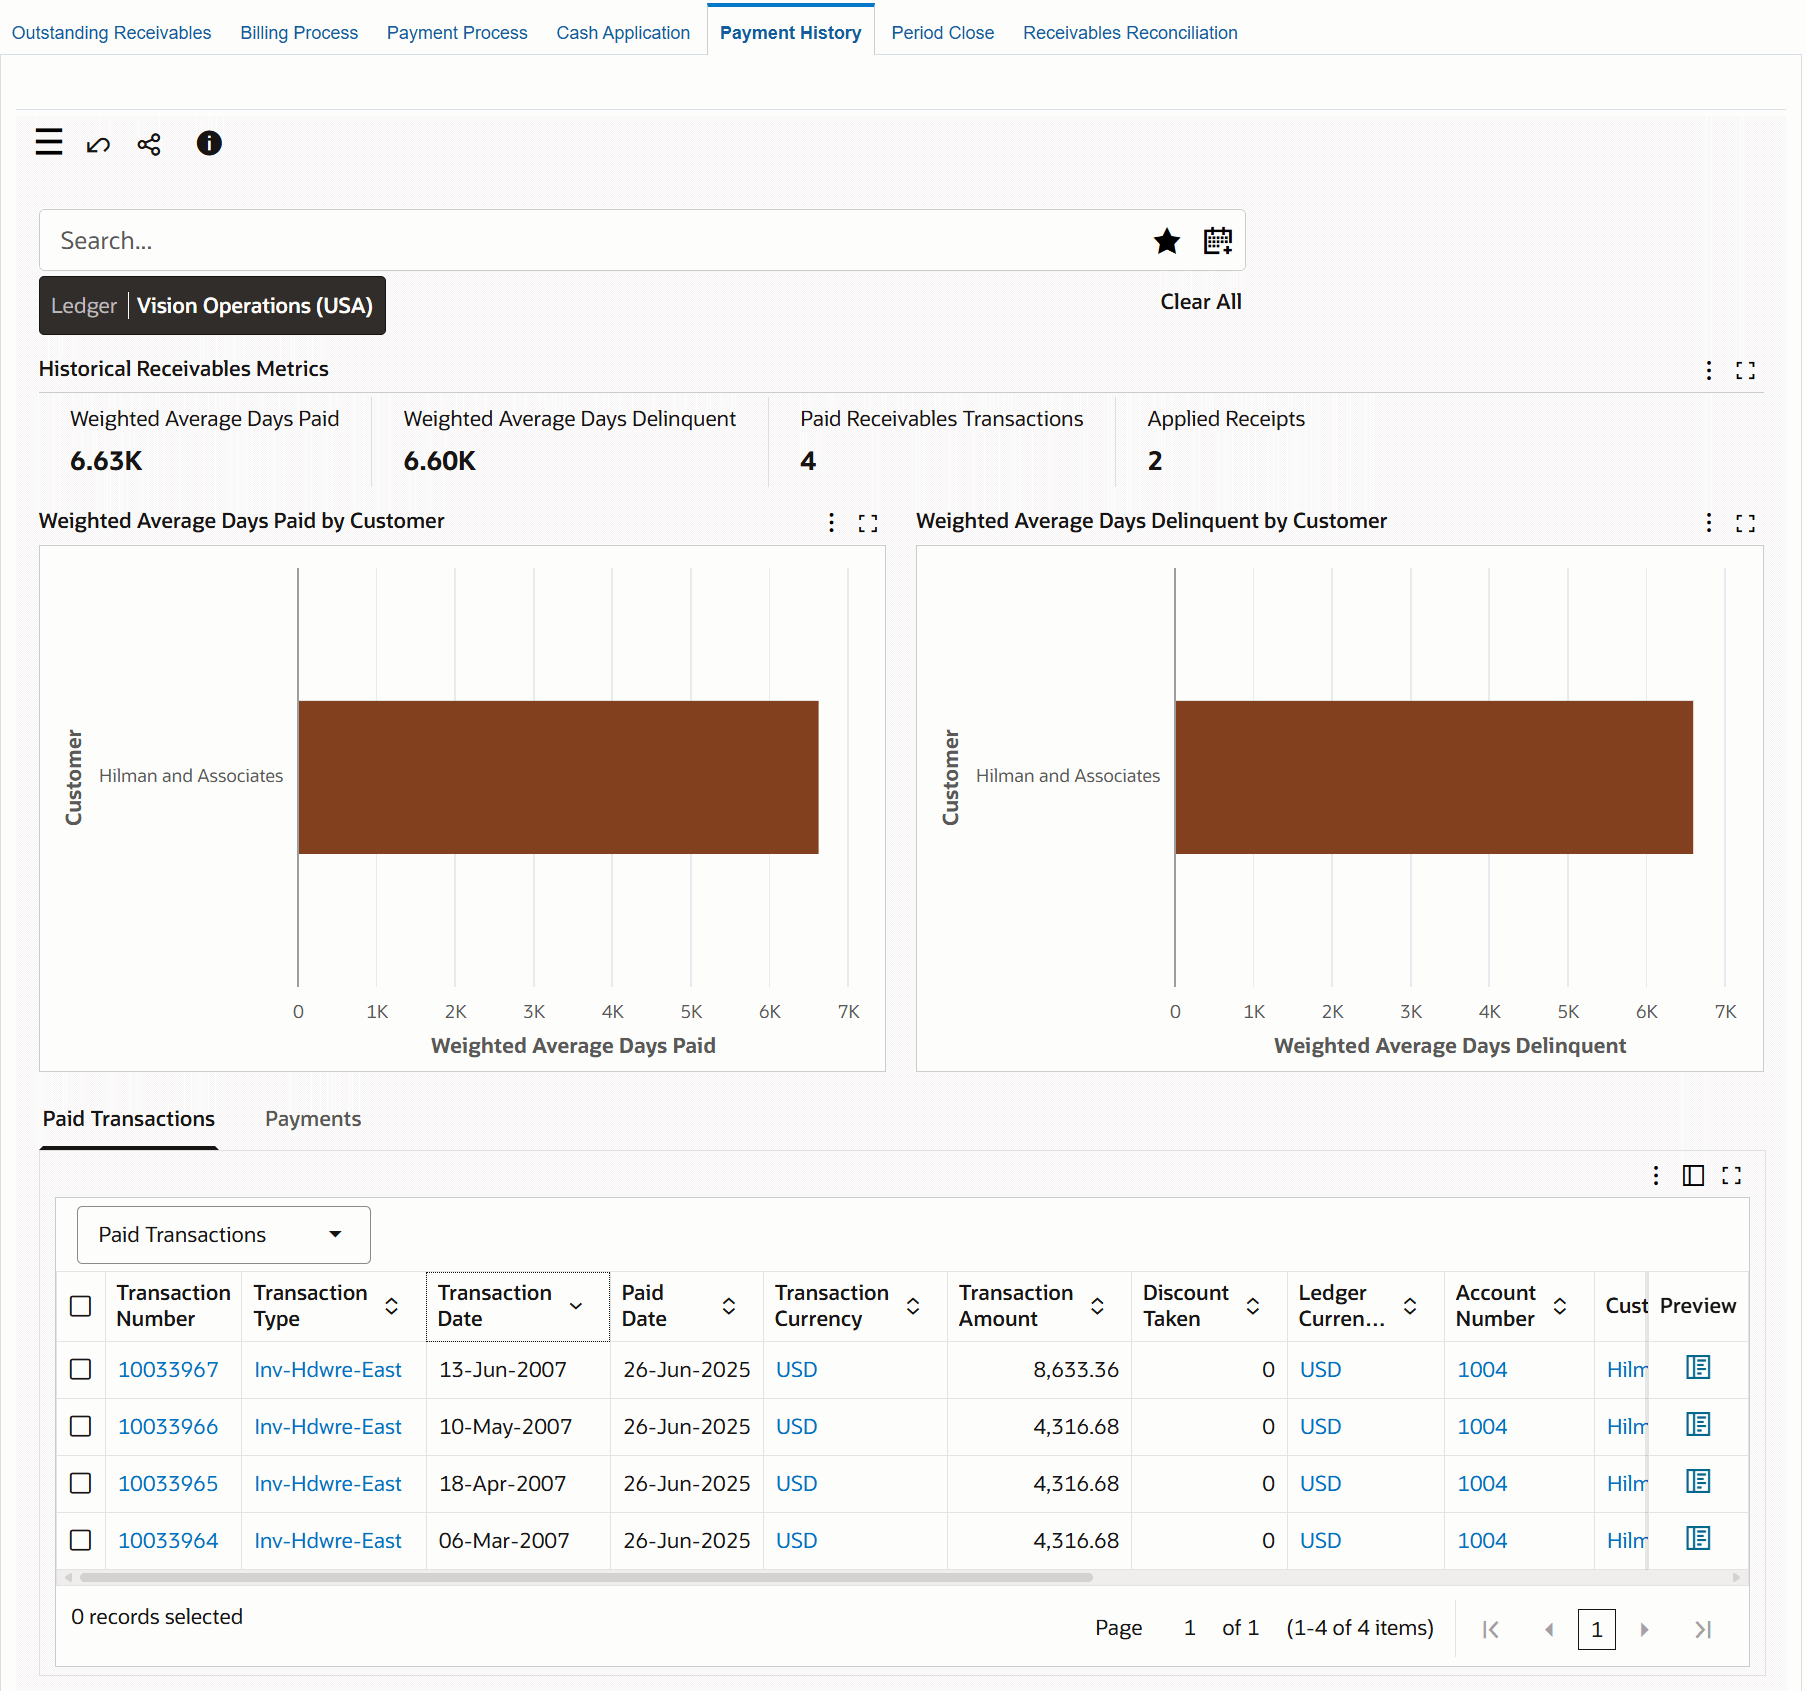
The following table describes the dashboard:
Only transactions that are fully paid during the period (or final payment was applied) and receipts that are fully applied are displayed on this dashboard. If a transaction has been partially paid or a receipt only partially applied, then it will be displayed in either the Outstanding Receivables or the Payment Process dashboard.
| Component | Description |
|---|---|
| Ledger (filter chip) | The Ledger filter displays the ledger that you can access. The payment history data is displayed in the context of a ledger. If you have access to multiple ledgers, then first select a ledger to display relevant data based on the selected filter. |
| Historical Receivables Metrics (summary bar) | The summary bar displays key metrics about receivable transactions for the selected ledger.
The dashboard uses the value that is specified in the AR: History Range for ECC profile option to calculate Weighted Average Days Paid, Paid Receivables Transactions, and Applied Receipts metrics. |
| Weighted Average Days Paid by Customer (chart) | This chart shows customers and their payment time in weighted average days. |
| Weighted Average Days Delinquent by Customer (chart) | This chart shows customers and their late payment time in weighted average days. |
| Paid Transactions (results table) | You can perform the following row-level actions:
|
| Payments (results table) | To view the payment history for a receipt and to act on it, click the link in the Receipt Number column to open the Receipts window. |
| Options (table-level actions) | Export: Use this action to export the search results in a comma-separated values (CSV) file format. |
Period Close Dashboard
See Receivables Command Center Overview.
The Period Close dashboard shows data for open accounting periods and offers insight into the period close process in your enterprise to ensure that all transactions are processed, accounted, and transferred to Oracle General Ledger (GL). If the accounting transactions are not closed during the subledger period, then new transactions in the past periods are affected, which invalidates the already accounted and reported results in GL.
Use the dashboard to:
-
Review all invoices and receipts created in the period.
-
Manage period close process proactively.
-
Gain visibility into the accounting process and subledger accounting events.
-
Review and analyze period close exceptions for a ledger, an operating unit, and an accounting period.
-
Investigate exception details at the transaction level.
-
Drill down to the source transaction to investigate the unaccounted transactions (receipts or invoices).
-
Drill down to subledger journal lines and journal errors.
-
-
Identify any potential bottlenecks early in the closing cycle.
-
Reduce adjustments by identifying missed and incorrect posted entries.
-
-
Increase efficiency.
-
Reduce period close time.
-
Accelerate delivery of financial results to internal management.
-
Identify improvements that need to be made over the next period.
-
-
Optimize month-end processes and improve accounting cycle.
-
Track the period close process.
-
Complete the accounting process.
-
Solve accounting errors.
-
Transfer accounted journals to GL.
-
From the Receivables Manager responsibility, navigate to the Period Close dashboard:
(N) Receivables Manager > Receivables Command Center
The Period Close dashboard shows data in the context of the selected ledger and the associated operating units. To calculate accounted and untransferred events, the dashboard considers the primary, secondary, and reporting currency ledgers' data including that of the subledger and journal.
Period Close Dashboard
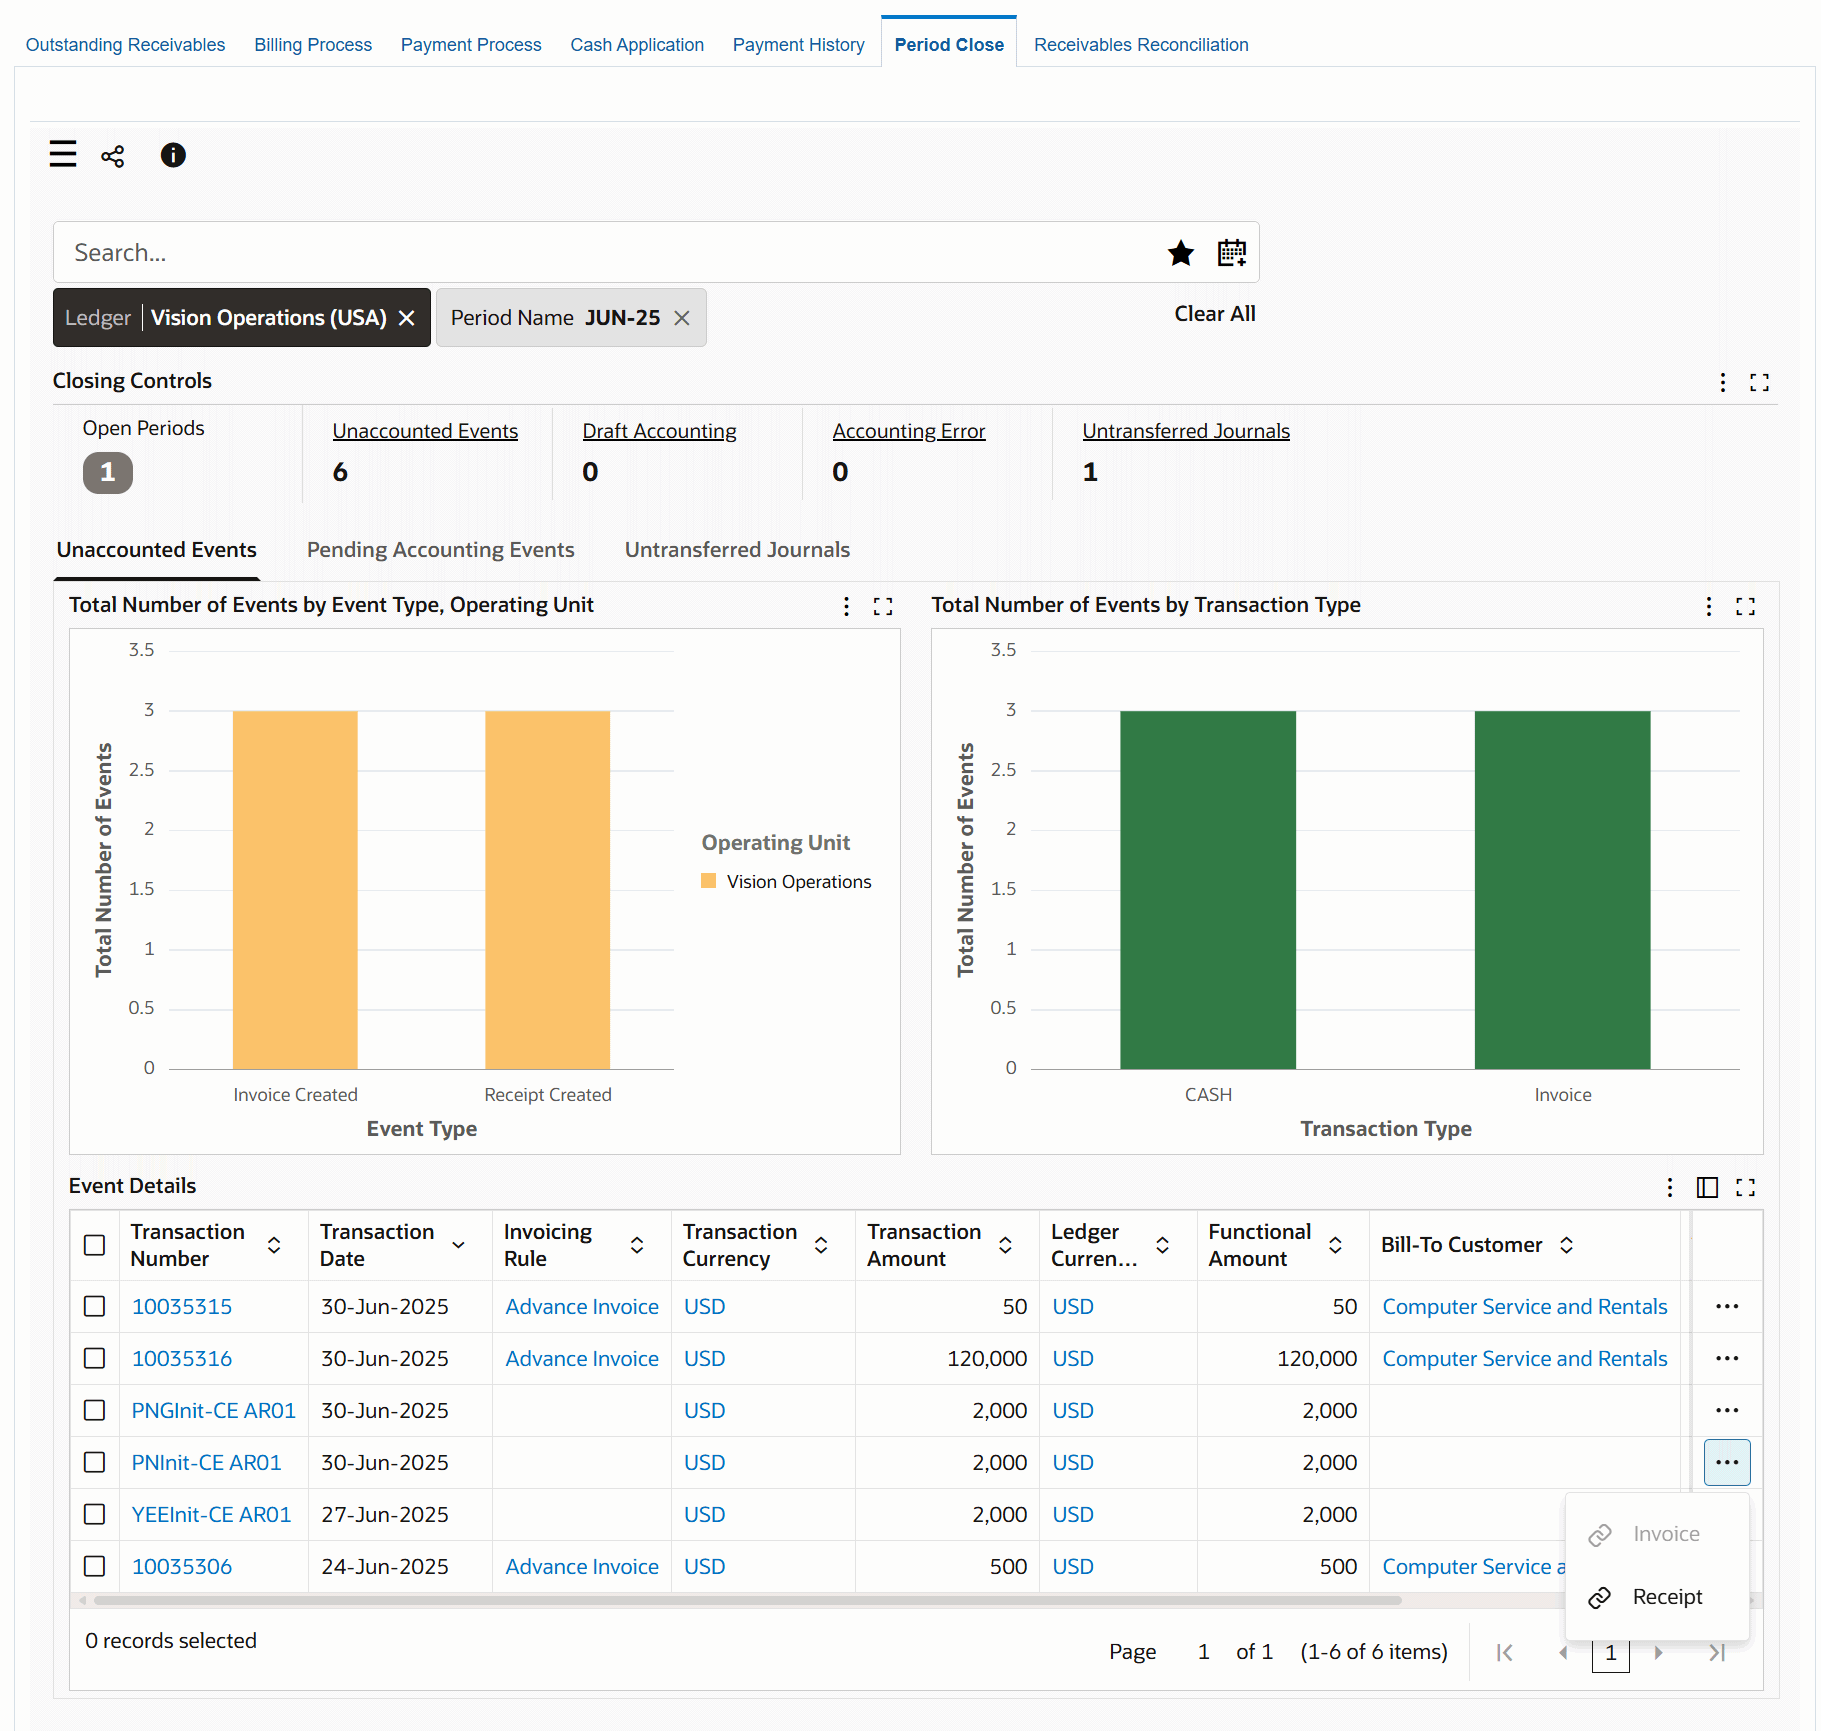
The following table describes the dashboard:
| Component | Description |
|---|---|
| Ledger (filter chip) | The Ledger filter displays the ledger that you can access. The period close data is displayed in the context of a ledger. If you have access to multiple ledgers, then first select a ledger to display relevant data based on the selected filter. The Ledger list displays the ledgers that you can access with the total number of events for each ledger. |
| Closing Controls (summary bar) | The summary bar shows the following key metrics to investigate the period close process for the selected ledger.
|
| Unaccounted Events (tab) | This tab contains the following charts and a results table.
|
| Pending Accounting Events (tab) | This tab contains the following charts and a results table:
|
| Untransferred Journals (tab) | This tab contains the following charts and a results table.
|
| Options (table-level actions) | Export: Use this action to export the search results in a comma-separated values (CSV) file format. |
Receivables Reconciliation Dashboard
See Receivables Command Center Overview.
The Receivables Reconciliation dashboard provides insights into the reconciliation process between Receivables and the General Ledger. Use the dashboard data for daily monitoring and for period-end reconciliation. The dashboard displays data within the context of a ledger and period.
Use the dashboard to:
-
Review the reconciliation metrics to monitor the reconciliation process.
-
Identify mismatches between the Receivables subledger and the General Ledger balances using credit, debit, and net amounts.
-
Navigate to the Account Analysis drawer for the selected General Ledger account.
-
Review the period activities.
-
Review the journal sources to know the reasons for amount differences.
-
Drill down to view subledger details on the View Journal Entry Lines page.
-
-
Examine Receivables subledger details and General Ledger journal sources.
-
Review unmatched records to take corrective actions.
From the Receivables Manager responsibility, navigate to the Receivables Reconciliation dashboard:
(N) Receivables Manager > Receivables Command Center
Important: The dashboard displays reconciliation data for open periods only. In addition to the Multi-Org Access Control (MOAC) security that is applied at the operating unit level, this dashboard implements the Segment Value Security for chart of accounts (COA) segments. Therefore, you can access only a segment value or ranges of segment values associated with your user responsibility. The Segment Value Security does not restrict your view of invoices associated with segments for which you do not have access.
Receivables Reconciliation Dashboard
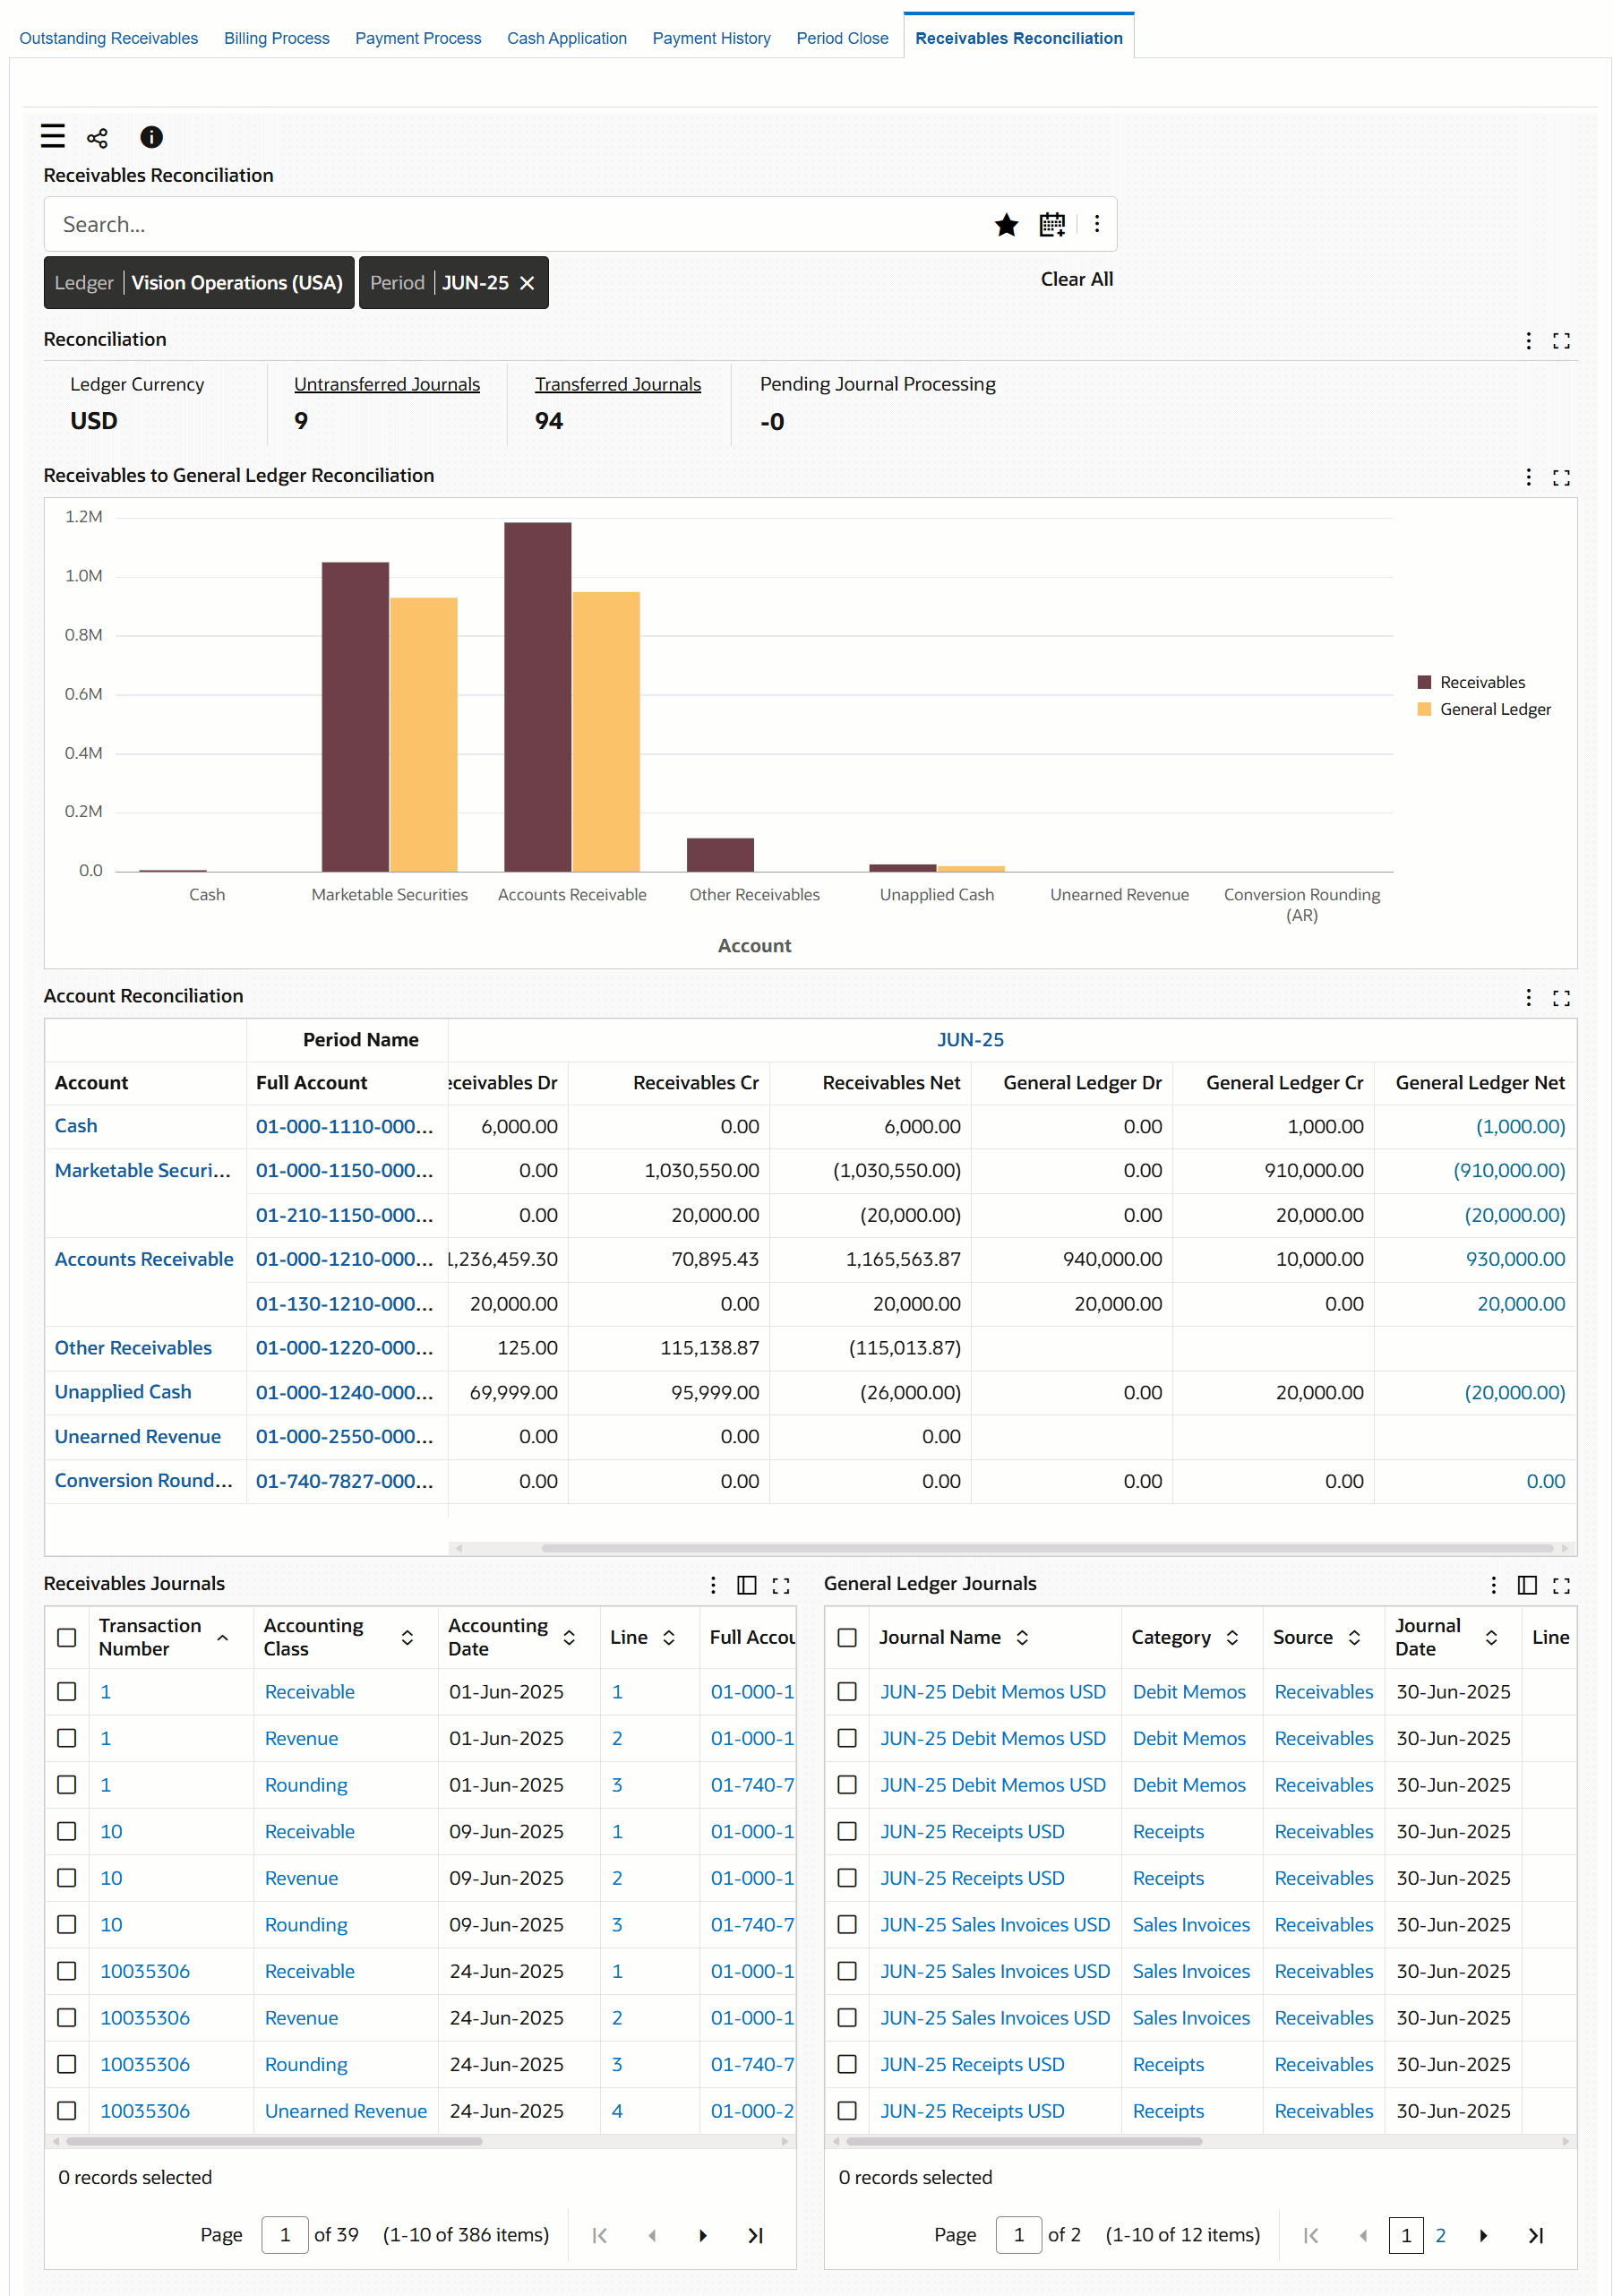
The following table describes the dashboard:
| Component | Description |
|---|---|
| Ledger (filter chip) Period (filter chip) |
The Ledger filter displays the ledger that you can access. The receivables reconciliation data is displayed in the context of a ledger. If you have access to multiple ledgers, then first select a ledger to display relevant data based on the selected filter. The Ledger list displays the ledgers that you can access with the journal count for each ledger. Select the period for which you want to view data. The Periods list displays the journal count for each period. |
| Reconciliation (summary bar) | The summary bar displays key metrics to summarize the reconciliation data for the selected ledger and period in the following fields:
|
| Receivables to General Ledger Reconciliation (chart) | This is a comparison chart between Receivables net amount (debit minus credit) and General Ledger net amount (debit minus credit) for each account in the ledger. Use this chart data to know whether the amounts match or there is difference in the Receivables and General Ledger amounts. The chart data helps you to perform reconciliation analysis. Click an account to review details in the pivot and results tables. |
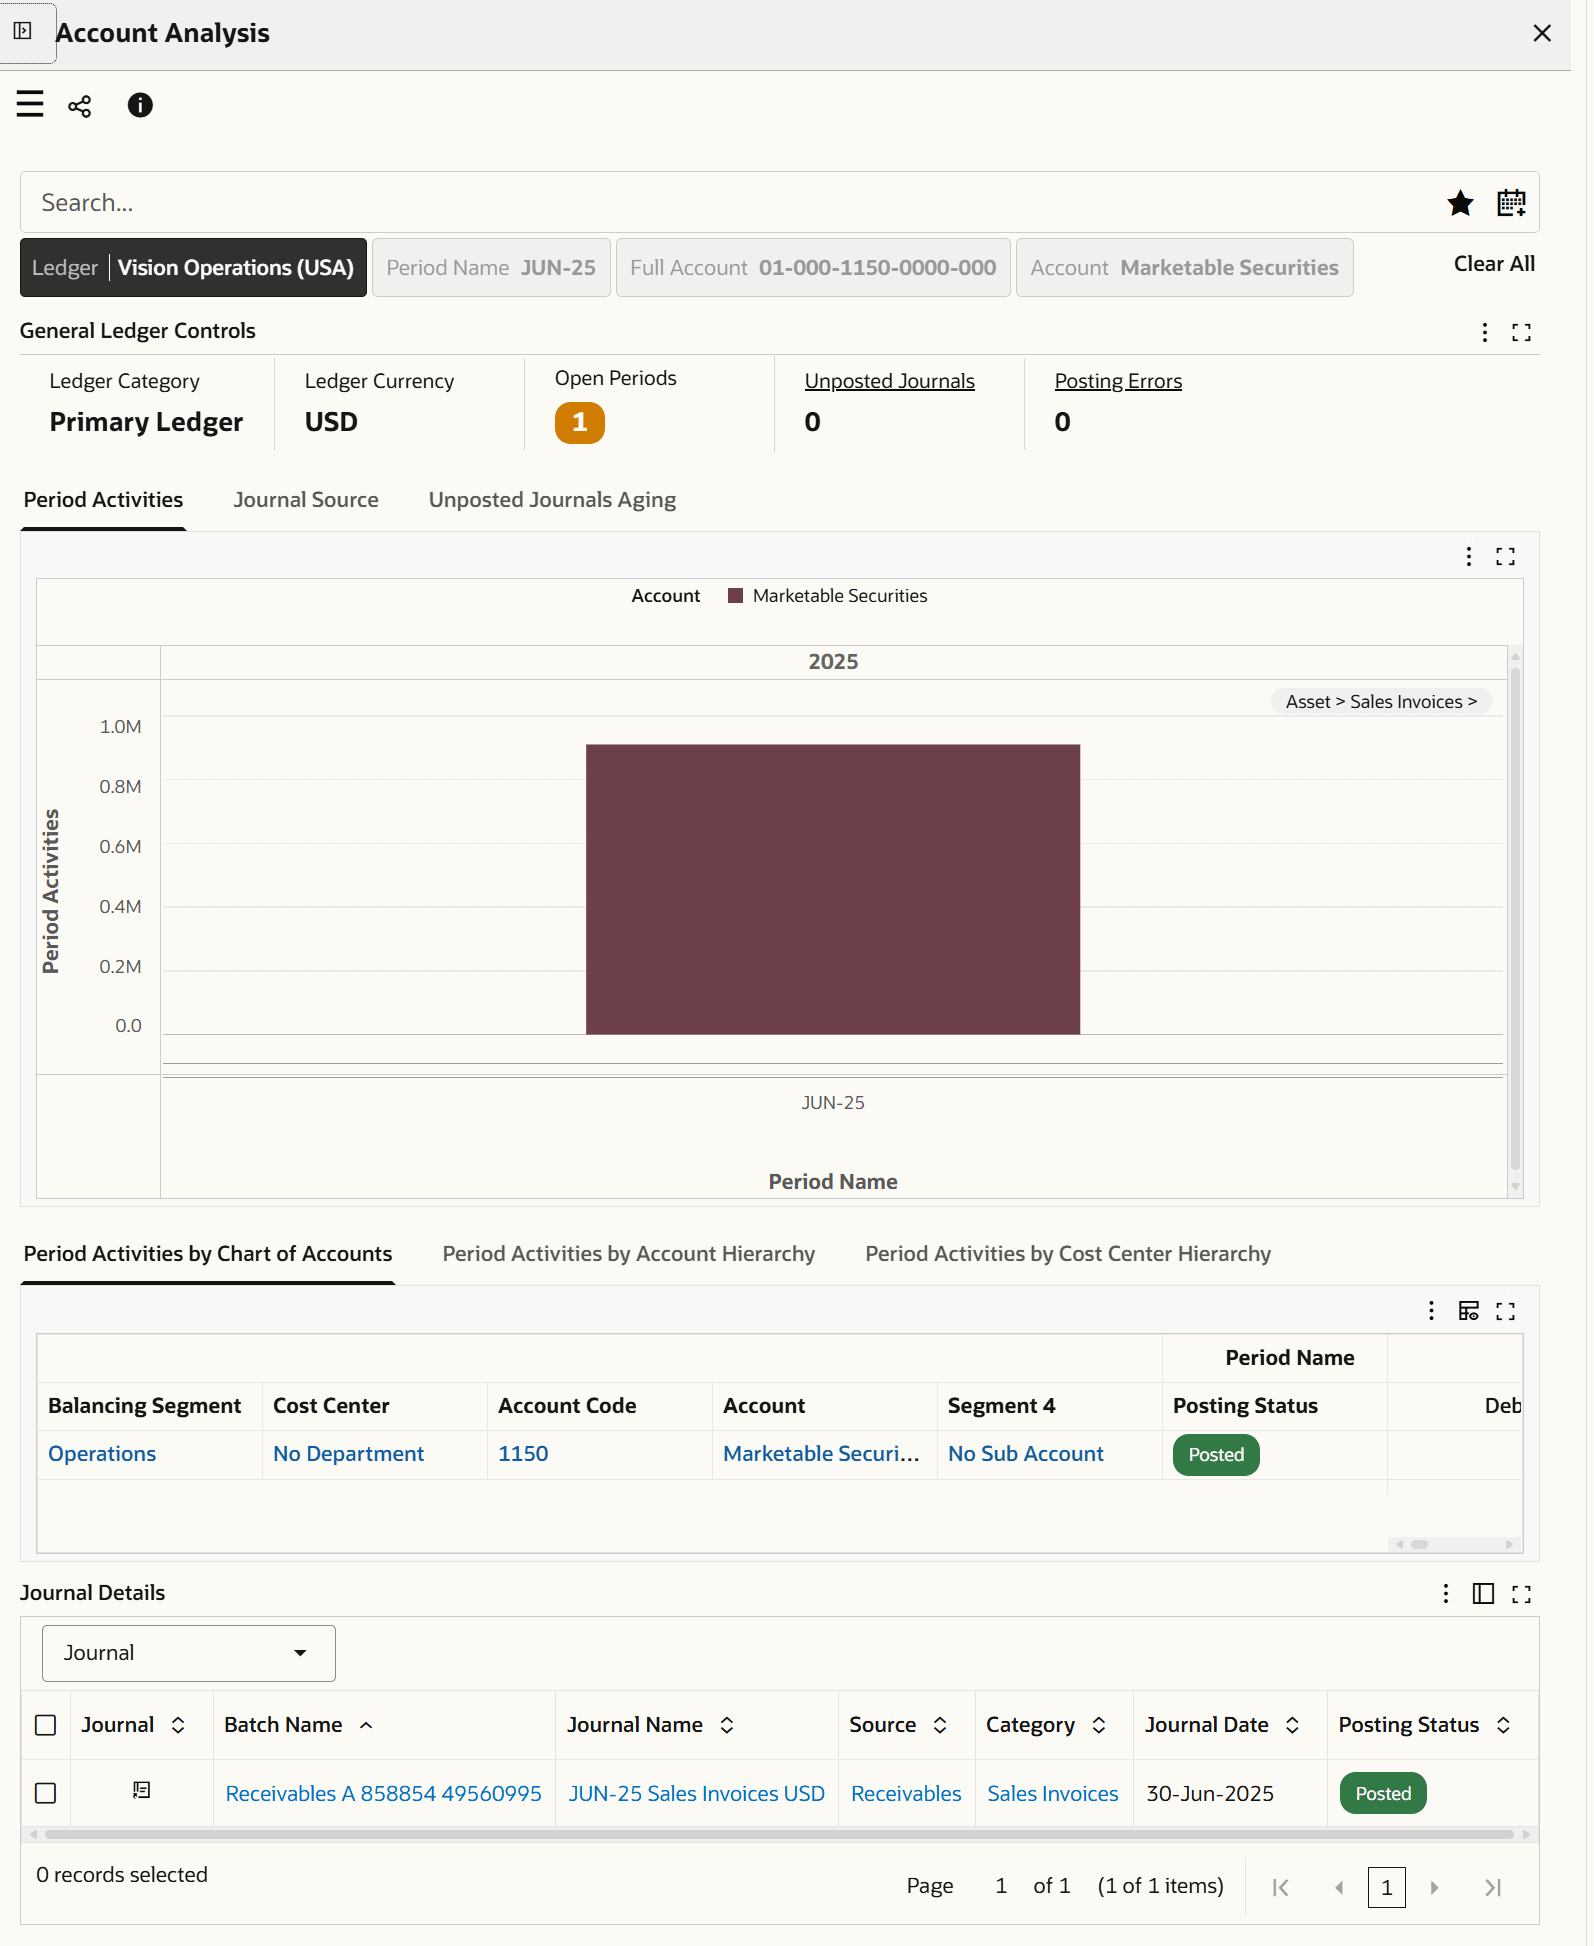
| Account Reconciliation (pivot table) | Use the Account Reconciliation pivot table to view the variance between Receivables and General Ledger for debit, credit, and net amounts. This table displays the Receivables and General Ledger regions side-by-side in the same table. Each region shows the corresponding debit, credit, net amounts for accounts in the selected period. To review General Ledger details of an account, click the General Ledger Net amount link for an account. The Account Analysis drawer appears with the details of the account in context. See Account Analysis Dashboard, Oracle General Ledger User's Guide for more information. Account Analysis Drawer
|
| Receivables Journals (results table) | In the Receivables Journals results table, you can view details such as transaction number, accounting class, accounting date, line, full account, debit, credit, line description, and GL journal link. Use the Hide/Show Attributes feature to view the required columns. |
| General Ledger Journals (results table) | In the General Ledger Journals results table, you can view journal name, category, source, journal date, line, full account, debit, credit, description, subledger journal link, and journal. Use the Hide/Show Attributes feature to view the required columns. |
| Options (table-level actions) | Export: Use this action to export the search results in a comma-separated values (CSV) file format. |
